. 2020 Nov 27;11(1):6024.
doi: 10.1038/s41467-020-19543-w.

Plasma N-terminal tau fragment levels predict future cognitive decline and neurodegeneration in healthy elderly individuals

Affiliations

Plasma N-terminal tau fragment levels predict future cognitive decline and neurodegeneration in healthy elderly individuals

Jasmeer P Chhatwal et al. Nat Commun. .

Abstract

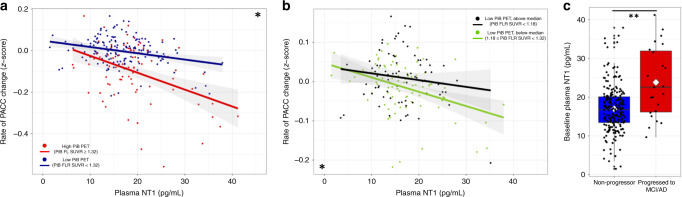
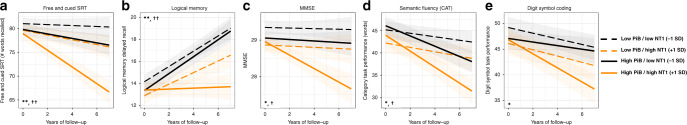
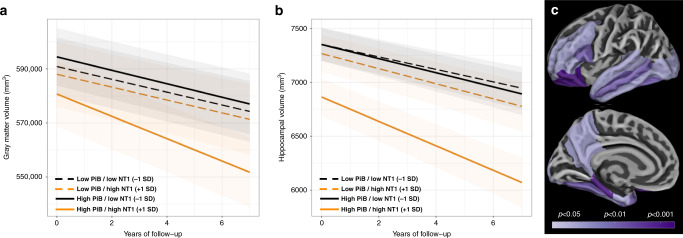
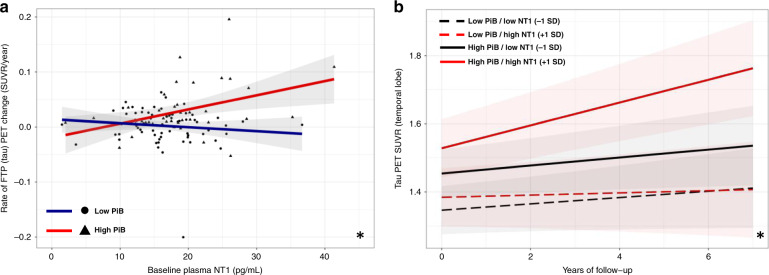
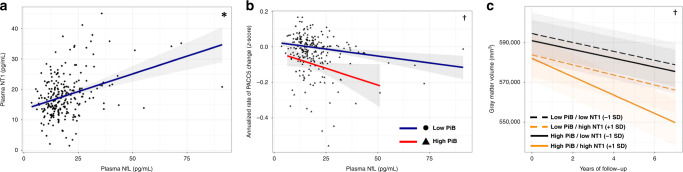
The availability of blood-based assays detecting Alzheimer's disease (AD) pathology should greatly accelerate AD therapeutic development and improve clinical care. This is especially true for markers that capture the risk of decline in pre-symptomatic stages of AD, as this would allow one to focus interventions on participants maximally at risk and at a stage prior to widespread synapse loss and neurodegeneration. Here we quantify plasma concentrations of an N-terminal fragment of tau (NT1) in a large, well-characterized cohort of clinically normal elderly who were followed longitudinally. Plasma NT1 levels at study entry (when all participants were unimpaired) were highly predictive of future cognitive decline, pathological tau accumulation, neurodegeneration, and transition to a diagnosis of MCI/AD. These predictive effects were particularly strong in participants with even modestly elevated brain β-amyloid burden at study entry, suggesting plasma NT1 levels capture very early cognitive, pathologic and neurodegenerative changes along the AD trajectory.


Conflict of interest statement

The authors declare no competing interests with regards to the content or interpretation of the data in the present study. Dr. Chhatwal has served on a medical advisory board for Otsuka Pharmaceuticals. Dr. Schultz has served on medical advisory boards for Janssen Pharmaceuticals and Biogen. Drs Sperling and Johnson are involved in public–private partnership clinical trials sponsored by the NIH and Eli Lilly and Co., who owns the distribution rights to Flortaucipir (AV-1451), but they do not have any personal financial relationship with Eli Lilly. Dr. Selkoe is a director and consultant for Prothena Biosciences.

Figures

Fig. 1
Fig. 1. Higher baseline NT1 is associated with greater cognitive decline and progression to clinical impairment, alone and synergistically with greater β-amyloid burden.
Greater levels of plasma NT1 were associated with greater performance declines on the preclinical Alzheimer’s cognitive composite (PACC5; a and b, both n = 236). Using previously defined cutoffs for high (PiB FLR SUVR ≥ 1.32; a: red line and circles) and low (PiB FLR SUVR < 1.32; a: blue line and circles) PiB groups, we observed that greater plasma NT1 at study baseline was associated with cognitive decline in both groups, though this association was stronger in the high PiB group (a; high PiB: t(74) = −3.09, p = 0.008; low PiB: t(151) = −3.00, p = 0.008). Focusing on only the low PiB group, plasma NT1 levels interacted with higher levels of PiB (b: green; PiB FLR SUVR between 1.18 and 1.32; t(75) = −3.5, p = 0.0025) to predict decline, but this same effect was not seen in participants with PiB FLR SUVR values below the median of the low PiB group (b: black; PiB FLR SUVR < 1.18; t(70) = 0.06, p = 0.95). Within this longitudinally-followed sample (n = 236), 23 participants progressed to clinical impairment during the follow-up period. Individuals who progressed to MCI or AD dementia during follow-up had greater plasma NT1 levels than those who did not progress to clinical impairment (c: blue: non-progressors; red: progressed to MCI or AD; white diamond corresponds to group mean; t(230) = −4.03, p = 0.0003). Shaded regions represent 95% confidence intervals for the fit of each linear regression model. * and ** corresponds to FDR corrected p ≤ 0.005 or 0.0005, respectively, for the association of baseline NT1 to longitudinal PACC performance (a, b) or to progression to clinical impairment during follow-up (c), after correction for age, sex, APOE ε4 status, and years of education. Two-tailed t-tests were used throughout. For the boxplot in panel c, the bounds of the 25th and 75th percentiles are represented in the box, whiskers correspond to +/−1.5 times the interquartile range, line indicates the median, diamond indicates the group mean, and all data points are shown.
Fig. 2
Fig. 2. Baseline NT1 predicts longitudinal change on all components of the PACC.
NT1 associations with cognitive performance were seen across all of the measures that comprise the PACC5. Individuals with both high NT1 (1 SD above the group mean; orange lines) and high PiB (mean value for the high Aβ group; solid lines) showed the greatest decreases in cognitive performance—especially in measures of episodic memory (a: t(1044) = −4.47, p = 0.00017; b: t(1070) = −3.92, p = 0.0005), but also on the MMSE (c; t(1070) = −2.69, p = 0.0013) and measures of language (d; t(1056) = −2.08, p = 0.05) and executive function (e; t(1069) = −2.05, p = 0.05). **, * corresponds to FDR corrected p ≤ 0.001 and ≤0.05, respectively, for the association of baseline NT1 to each longitudinal cognitive measure after correction for age, sex, APOE ε4 status, years of education; ††, † corresponds to FDR corrected p ≤ 0.01 and ≤0.05, respectively, for the interaction of baseline NT1 and PiB PET to each longitudinal cognitive measure after correction for age, sex, APOE ε4 status, and years of education. Two-tailed t-tests were used throughout. Shaded regions represent 95% confidence intervals for predictions based on each linear regression model.
Fig. 3
Fig. 3. Higher baseline NT1 is associated with greater longitudinal neurodegeneration as measured by longitudinal structural MRI, particularly in those with high β-amyloid at baseline.
Greater levels of plasma NT1 were associated with greater longitudinal declines in total gray matter volume (a t(291) = −2.16, p = 0.039) and hippocampal volume (b t(292) = −2.71, p = 0.013). These associations were present in individuals with both elevated (solid lines) and non-elevated levels of β-amyloid (dashed lines) assessed by PiB PET at study baseline, but the relationship of higher NT1 to neurodegeneration measures was particularly strong in individuals with higher amyloid burden (orange solid line). High (orange lines) and low NT1 (black lines) correspond to 1 SD above and below the group mean. High (solid lines) and low PiB (dashed lines) corresponds to the mean value for high PiB and low PiB individuals based on previously published cutoff values for PiB PET. An exploratory analysis of regions where the interaction of baseline NT1 and baseline PiB PET was significantly associated with regional cortical thickness is shown in panel (c), with nominal p-values indicated on the color scale. * corresponds to FDR corrected p < 0.05 for the association of NT1 with neurodegeneration; † to FDR corrected p < 0.05 for the interaction of NT1 and PiB group with respect to neurodegeneration. Two-tailed t-tests were used throughout. Shaded regions represent 95% confidence intervals for predictions based on each linear regression model.
Fig. 4
Fig. 4. Greater plasma NT1 is associated with greater increase in temporal tau PET signal in individuals with high β-amyloid burden.
In a subset of individuals with plasma NT1 and longitudinal FTP tau PET, greater levels of plasma NT1 at baseline were significantly associated with greater longitudinal increases in tau PET signal in the temporal composite region of interest. Panel a (n = 112) depicts the relationship of plasma NT1 to longitudinal FTP change in the temporal composite (NT1 by PiB interaction, t(141) = 2.78, p = 0.012). Panel (b) depicts the modeled change in temporal tau PET signal in individuals with high (red solid line; mean of high PiB group) and low PiB PET (black solid line; mean of low PiB group) and high (red lines; 1 SD above group mean for NT1) and low NT1 (black lines; 1 SD below group mean for NT1). Two-tailed t-tests were used throughout. Shaded regions represent 95% confidence intervals for the fit of each linear regression model in (a) and for model predictions in (b) * corresponds to FDR corrected p < 0.01 for the interaction of PiB and NT1 after correction for age, sex, and APOE ε4 status.
Fig. 5
Fig. 5. Plasma NfL levels are correlated with plasma NT1, longitudinal cognitive decline, and longitudinal GM volume.
NT1 and NfL in the same plasma samples were significantly associated with each other (a; n = 236; t(230) = 4.39, p = 0.0030). Greater baseline plasma NfL was associated with greater cognitive decline in individuals with high PiB PET at baseline (b; n = 236; t(1074) = −2.14, p = 0.046). Greater baseline plasma NfL was associated with greater gray matter volume loss in individuals with higher baseline β-amyloid as assessed by PiB PET (c; t(290) = −2.768, p = 0.0129). * corresponds to FDR corrected p < 0.05 for the main effect of NT1 after correction for age, sex, and APOE ε4 status; † corresponds to FDR corrected p < 0.05 for the interaction of NfL and PiB after correction for age, sex, APOE ε4 status, and years of education. Two-tailed t-tests were used throughout. Shaded regions represent 95% confidence intervals for the fit of each linear regression model in (a) and (b) and for model predictions in (c).

Similar articles

Cited by

References

    1. Sperling RA, et al. Toward defining the preclinical stages of Alzheimer’s disease: recommendations from the National Institute on Aging-Alzheimer’s Association workgroups on diagnostic guidelines for Alzheimer’s disease. Alzheimer’s Dement. 2011;7:280–292. doi: 10.1016/j.jalz.2011.03.003. - DOI - PMC - PubMed
    1. Jack CR, Jr., et al. NIA-AA Research Framework: toward a biological definition of Alzheimer’s disease. Alzheimers Dement. 2018;14:535–562. doi: 10.1016/j.jalz.2018.02.018. - DOI - PMC - PubMed
    1. Nakamura A, et al. High performance plasma amyloid-β biomarkers for Alzheimer’s disease. Nature. 2018;554:249–254. doi: 10.1038/nature25456. - DOI - PubMed
    1. Schindler SE, et al. High-precision plasma beta-amyloid 42/40 predicts current and future brain amyloidosis. Neurology. 2019;93:e1647–e1659. - PMC - PubMed
    1. Mielke MM, et al. Plasma phospho-tau181 increases with Alzheimer’s disease clinical severity and is associated with tau- and amyloid-positron emission tomography. Alzheimers Dement. 2018;14:989–997. doi: 10.1016/j.jalz.2018.02.013. - DOI - PMC - PubMed

Publication types

MeSH terms