. 2020 Nov 27;11(1):6044.
doi: 10.1038/s41467-020-19943-y.

Dynamic changes in anti-SARS-CoV-2 antibodies during SARS-CoV-2 infection and recovery from COVID-19

Affiliations

Dynamic changes in anti-SARS-CoV-2 antibodies during SARS-CoV-2 infection and recovery from COVID-19

Kening Li et al. Nat Commun. .

Abstract

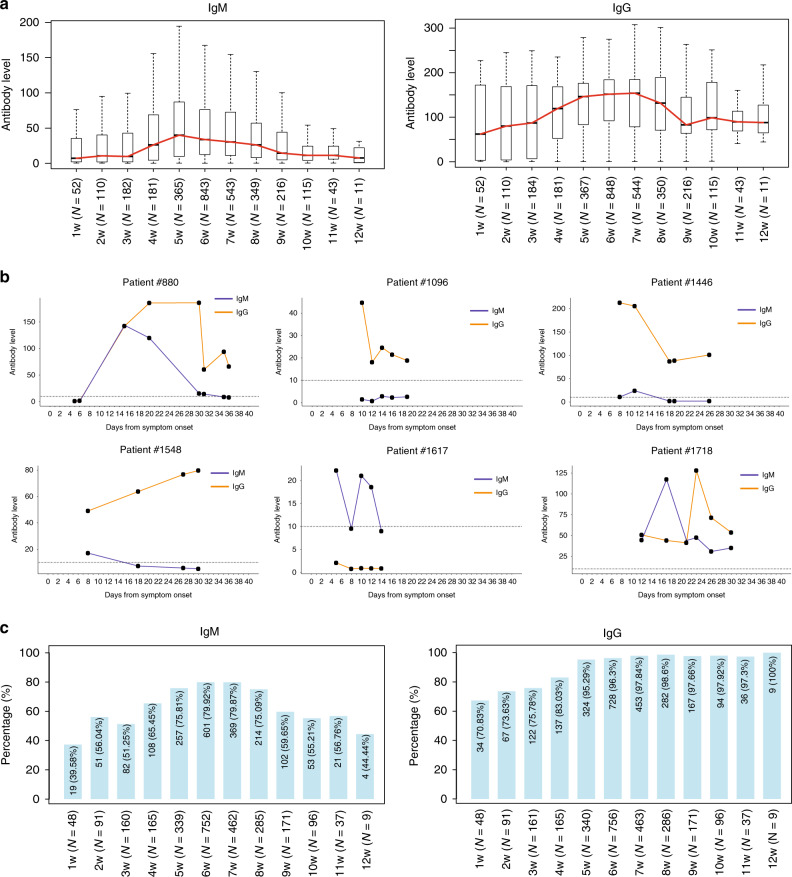
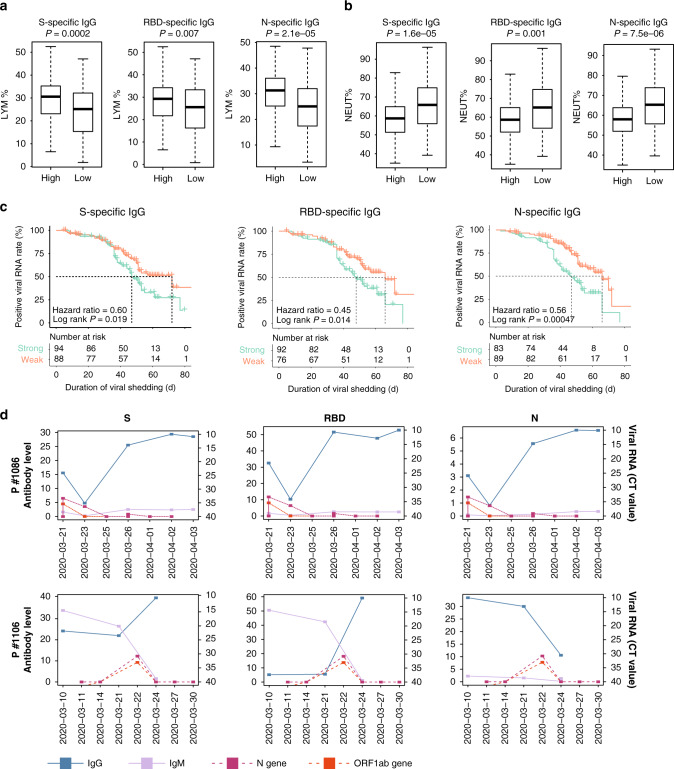
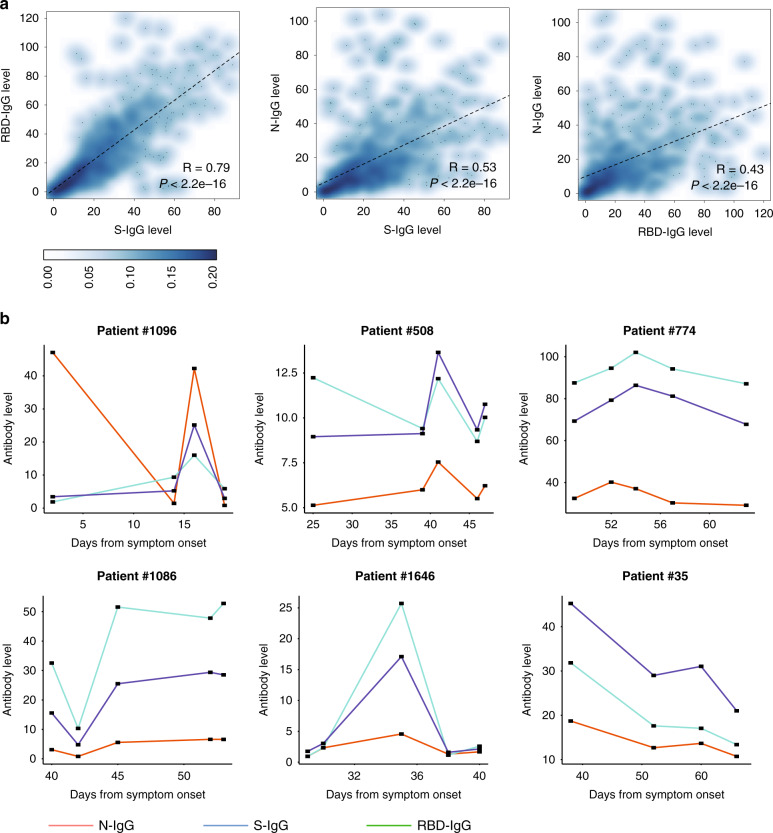
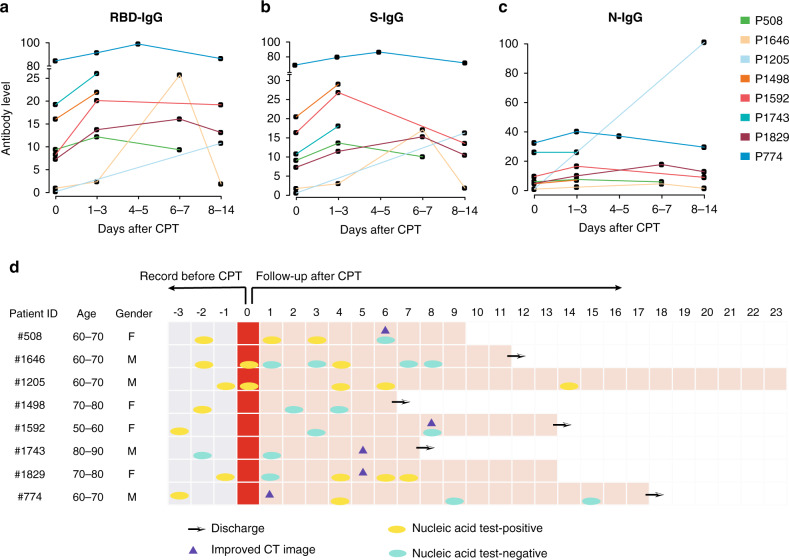
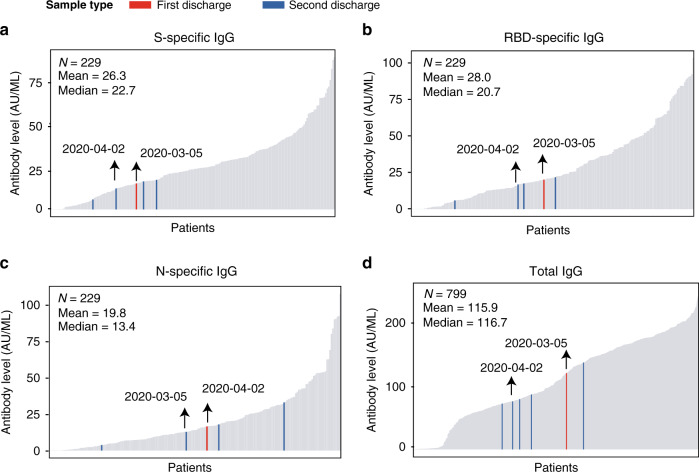
Deciphering the dynamic changes in antibodies against SARS-CoV-2 is essential for understanding the immune response in COVID-19 patients. Here we analyze the laboratory findings of 1,850 patients to describe the dynamic changes of the total antibody, spike protein (S)-, receptor-binding domain (RBD)-, and nucleoprotein (N)-specific immunoglobulin M (IgM) and G (IgG) levels during SARS-CoV-2 infection and recovery. The generation of S-, RBD-, and N-specific IgG occurs one week later in patients with severe/critical COVID-19 compared to patients with mild/moderate disease, while S- and RBD-specific IgG levels are 1.5-fold higher in severe/critical patients during hospitalization. The RBD-specific IgG levels are 4-fold higher in older patients than in younger patients during hospitalization. In addition, the S- and RBD-specific IgG levels are 2-fold higher in the recovered patients who are SARS-CoV-2 RNA negative than those who are RNA positive. Lower S-, RBD-, and N-specific IgG levels are associated with a lower lymphocyte percentage, higher neutrophil percentage, and a longer duration of viral shedding. Patients with low antibody levels on discharge might thereby have a high chance of being tested positive for SARS-CoV-2 RNA after recovery. Our study provides important information for COVID-19 diagnosis, treatment, and vaccine development.


Conflict of interest statement

The authors declare no competing interests.

Figures

Fig. 1
Fig. 1. Temporal dynamic changes of the total anti-SARS-CoV-2 IgM and IgG.
a The total anti-SARS-CoV-2 IgM and IgG level of confirmed COVID-19 patients from the first to 12th week after symptom onset. Horizontal lines in the boxplots represent the median, the lower, and the upper hinges correspond to the first and third quartiles, and the whiskers extend from the hinge up to 1.5 times the interquartile range from the hinge. The red line based on the median is used to profile the variation tendency. b The temporal dynamic changes of the antibody levels in six representative patients. The X axis represents the days since symptom onset, and Y axis represents the antibody level. c The prevalence of total anti-SARS-CoV-2 IgM and IgG. The X axis indicates the weeks after symptom onset, and the Y axis shows the antibody-prevalence among confirmed COVID-19 patients.
Fig. 2
Fig. 2. Relationship between the levels of IgG and the clinical outcome of COVID-19 patients.
The percentage of lymphocytes (a) and neutrophils (b) in severe/critical COVID-19 patients with different N-, RBD-, and S-specific IgG levels. Antibody levels and lymphocyte/neutrophil percentages were measured on the same day, with 112 sets of measurements for both the low- and high-antibody groups. Horizontal lines in the boxplots represent the median, the lower, and the upper hinges correspond to the first and third quartiles, and the whiskers extend from the hinge up to 1.5 times the interquartile range from the hinge. P values were calculated with a two-sided Wilcoxon rank-sum test. c Kaplan–Meier analysis of the viral shedding time in patients with strong and weak antibody responses. The X axis represents the duration of viral shedding (days). The Y axis represents the positive rate of viral RNA. P values were calculated with the log-rank test. d The dynamic changes in antibody levels and virus RNA load in Patients #1086 and #1106. The X axis represents the detection date. The Y axis on the left represents the antibody level, and the Y axis on the right represents the cycle threshold (CT) value of PCR for the detection of viral RNA load. A CT value <40 was defined as SARS-CoV-2 viral positive. Blue dots represent IgG levels, purple dots represent IgM levels. The ORF1ab and N genes of SARS-CoV-2 were represented as pink and orange dots, respectively.
Fig. 3
Fig. 3. Correlations between S-, RBD-, and N-IgG levels.
a Scatter plots of the pair-wise correlations among S-, RBD-, and N-IgG levels. Each point represents the IgG level of one sample. P values were calculated with the Pearson correlation test. The density of points is shown by color. b Examples of the dynamic changes in the S-, RBD-, and N-IgG levels.
Fig. 4
Fig. 4. Dynamic changes in the IgG levels after convalescent plasma transfusion.
ac The X axis represents the days since convalescent plasma transfusion therapy, and the Y axis represents the S-, RBD-, and N-specific IgG levels. Different colored lines represent the dynamic changes in antibody levels in different patients. d The clinical assessment of patients after receiving COVID-19 convalescent plasma transfusion therapy. Arrows represent the patients’ discharge date. Triangles represent radiological improvements. Yellow and green dots represent the date in which the RT-PCR tests for SARS-CoV-2 RNA were positive and negative, respectively.
Fig. 5
Fig. 5. Level of IgG on discharge.
Barplot displays of the level of S-specific (a), RBD-specific (b), N-specific (c), and total IgG (d) in patients on discharge. The red bar indicates the time of the first discharge, and the blue bar indicates the time of the second discharge. The black arrows indicate the antibody levels of Patient #515.

Similar articles

Cited by

References

    1. Guan WJ, et al. Clinical characteristics of coronavirus disease 2019 in China. N. Engl. J. Med. 2020;382:1708–1720. doi: 10.1056/NEJMoa2002032. - DOI - PMC - PubMed
    1. Wu, Z. & McGoogan, J. M. Characteristics of and important lessons from the coronavirus disease 2019 (COVID-19) outbreak in China: summary of a report of 72314 cases from the chinese center for disease control and prevention. J. Am. Med. Assoc.323, 1239–1242 (2020). - PubMed
    1. Grasselli, G. et al. Baseline characteristics and outcomes of 1591 patients infected with SARS-CoV-2 admitted to ICUs of the Lombardy Region, Italy. J. Am. Med. Assoc.323, 1574–1581 (2020). - PMC - PubMed
    1. To KK, et al. Temporal profiles of viral load in posterior oropharyngeal saliva samples and serum antibody responses during infection by SARS-CoV-2: an observational cohort study. Lancet Infect. Dis. 2020;20:565–574. doi: 10.1016/S1473-3099(20)30196-1. - DOI - PMC - PubMed
    1. Wolfel R, et al. Virological assessment of hospitalized patients with COVID-2019. Nature. 2020;581:465–469. doi: 10.1038/s41586-020-2196-x. - DOI - PubMed

Publication types

MeSH terms