. 2020 Nov 27;10(1):20764.
doi: 10.1038/s41598-020-77740-5.

Assessment of metastatic lymph nodes in head and neck squamous cell carcinomas using simultaneous 18F-FDG-PET and MRI

Affiliations

Assessment of metastatic lymph nodes in head and neck squamous cell carcinomas using simultaneous 18F-FDG-PET and MRI

Jenny Chen et al. Sci Rep. .

Abstract

In this study, we investigate the feasibility of using dynamic contrast enhanced magnetic resonance imaging (DCE-MRI), diffusion weighted imaging (DWI), and dynamic positron emission tomography (PET) for detection of metastatic lymph nodes in head and neck squamous cell carcinoma (HNSCC) cases. Twenty HNSCC patients scheduled for lymph node dissection underwent DCE-MRI, dynamic PET, and DWI using a PET-MR scanner within one week prior to their planned surgery. During surgery, resected nodes were labeled to identify their nodal levels and sent for routine clinical pathology evaluation. Quantitative parameters of metastatic and normal nodes were calculated from DCE-MRI (ve, vp, PS, Fp, Ktrans), DWI (ADC) and PET (Ki, K1, k2, k3) to assess if an individual or a combination of parameters can classify normal and metastatic lymph nodes accurately. There were 38 normal and 11 metastatic nodes covered by all three imaging methods and confirmed by pathology. 34% of all normal nodes had volumes greater than or equal to the smallest metastatic node while 4 normal nodes had SUV > 4.5. Among the MRI parameters, the median vp, Fp, PS, and Ktrans values of the metastatic lymph nodes were significantly lower (p = <0.05) than those of normal nodes. ve and ADC did not show any statistical significance. For the dynamic PET parameters, the metastatic nodes had significantly higher k3 (p value = 8.8 × 10⁻⁸) and Ki (p value = 5.3 × 10⁻⁸) than normal nodes. K1 and k2 did not show any statistically significant difference. Ki had the best separation with accuracy = 0.96 (sensitivity = 1, specificity = 0.95) using a cutoff of Ki = 5.3 × 10⁻³ mL/cm3/min, while k3 and volume had accuracy of 0.94 (sensitivity = 0.82, specificity = 0.97) and 0.90 (sensitivity = 0.64, specificity = 0.97) respectively. 100% accuracy can be achieved using a multivariate logistic regression model of MRI parameters after thresholding the data with Ki < 5.3 × 10⁻³ mL/cm3/min. The results of this preliminary study suggest that quantitative MRI may provide additional value in distinguishing metastatic nodes, particularly among small nodes, when used together with FDG-PET.


Conflict of interest statement

The authors declare no competing interests.

Figures
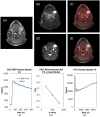
Figure 1
Figure 1
An example of a 50-year-old male patient with HNSCC in the floor of the mouth. A left level-1 metastatic lymph node can be detected in co-registered DCE-MRI (SimpleElastix v0.10.0; https://github.com/SuperElastix/SimpleElastix) (A), co-registered 18F-FDG-PET image (B), PET activity map overlaid on DCE-MRI (C), co-registered DWI b0 image (D) and DWI b0 image overlaid on DCE-MRI (E). The average data (blue dots) of the left level 1 metastatic lymph node (arrows) are shown for DCE-MRI (F), DWI (G), and PET (H) with their corresponding model fits (solid black lines).
Figure 2
Figure 2
Box–Whisker plots of metastatic and normal lymph node volume in 100 mm3 (A) and SUV (FDG-avid nodes only) (B). Red dots are for individual nodes. *Represents a statistical significance where p < 0.05 from Mann–Whitney U test.
Figure 3
Figure 3
Comparison of DCE-MRI and DWI data between metastatic and normal nodes. Box–Whisker plots show the median and inter-quartile range of ve, vp, Fp, PS, Ktrans, and ADC values of normal or metastatic nodes. *Represents a statistical significance where p < 0.05 from Mann–Whitney U test.
Figure 4
Figure 4
Comparison of dynamic PET data between metastatic and normal nodes. Box–Whisker plots show the median and inter-quartile range of K1, k2, k3, and Ki values of normal or metastatic nodes. (E) Scatter plot of Ki and SUV in metastatic and normal nodes. Included in the scatter plot are the nodes that were noted as FDG-avid in clinical assessment. These nodes have volumes > 574 mm3. *Represents a statistical significance where p < 0.05 from Mann–Whitney U test.
Figure 5
Figure 5
(A) ROC curves in single and (B) two parameter logistic regression using all 49 lymph nodes.
Figure 6
Figure 6
(A) Boxplot of Ki values of lymph nodes categorized by metastatic and normal nodes showing 5.3 × 10−3 mL/cm3/min threshold separating metastatic from normal nodes. (B) Scatter plot of PS vs volume and (C) ADC vs Ktrans after removing lymph nodes under the 5.3 × 10−3 mL/cm3/min Ki threshold with boundary separating the remaining two normal lymph nodes from metastatic lymph nodes.
Figure 7
Figure 7
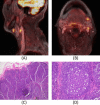
93-year-old male with left mandible SCC PET activity map overlaid on co-registered DCE-MRI (SimpleElastix v0.10.0; https://github.com/SuperElastix/SimpleElastix) (top). Sagittal (A) and axial (B) slices show 2 regions with SUV = 5.9 and mean Ki = 0.01 mL/cm3/min, discordant with negative pathology report. Low power view image showing lymphoid follicular hyperplasia (C) in lymph node with elevated SUV and high power view image showing tingible body microphages (D).

Similar articles

Cited by

References

    1. Siegel RL, Miller KD, Jemal A. Cancer statistics, 2020. CA Cancer J. Clin. 2020;70(1):7–30. doi: 10.3322/caac.21590. - DOI - PubMed
    1. de Bondt RB, et al. Detection of lymph node metastases in head and neck cancer: a meta-analysis comparing US, USgFNAC, CT and MR imaging. Eur. J. Radiol. 2007;64(2):266–272. doi: 10.1016/j.ejrad.2007.02.037. - DOI - PubMed
    1. Ludwig JA, Weinstein JN. Biomarkers in cancer staging, prognosis and treatment selection. Nat. Rev. Cancer. 2005;5(11):845–856. doi: 10.1038/nrc1739. - DOI - PubMed
    1. Kim S, et al. Diffusion-weighted magnetic resonance imaging for predicting and detecting early response to chemoradiation therapy of squamous cell carcinomas of the head and neck. Clin. Cancer Res. 2009;15(3):986–994. doi: 10.1158/1078-0432.CCR-08-1287. - DOI - PMC - PubMed
    1. Kim S, et al. Prediction of response to chemoradiation therapy in squamous cell carcinomas of the head and neck using dynamic contrast-enhanced MR imaging. AJNR Am. J. Neuroradiol. 2010;31(2):262–268. doi: 10.3174/ajnr.A1817. - DOI - PMC - PubMed

Publication types

MeSH terms

Substances