. 2020 Nov 27;3(1):719.
doi: 10.1038/s42003-020-01453-8.

The PAR2 inhibitor I-287 selectively targets Gαq and Gα12/13 signaling and has anti-inflammatory effects

Affiliations

The PAR2 inhibitor I-287 selectively targets Gαq and Gα12/13 signaling and has anti-inflammatory effects

Charlotte Avet et al. Commun Biol. .

Abstract

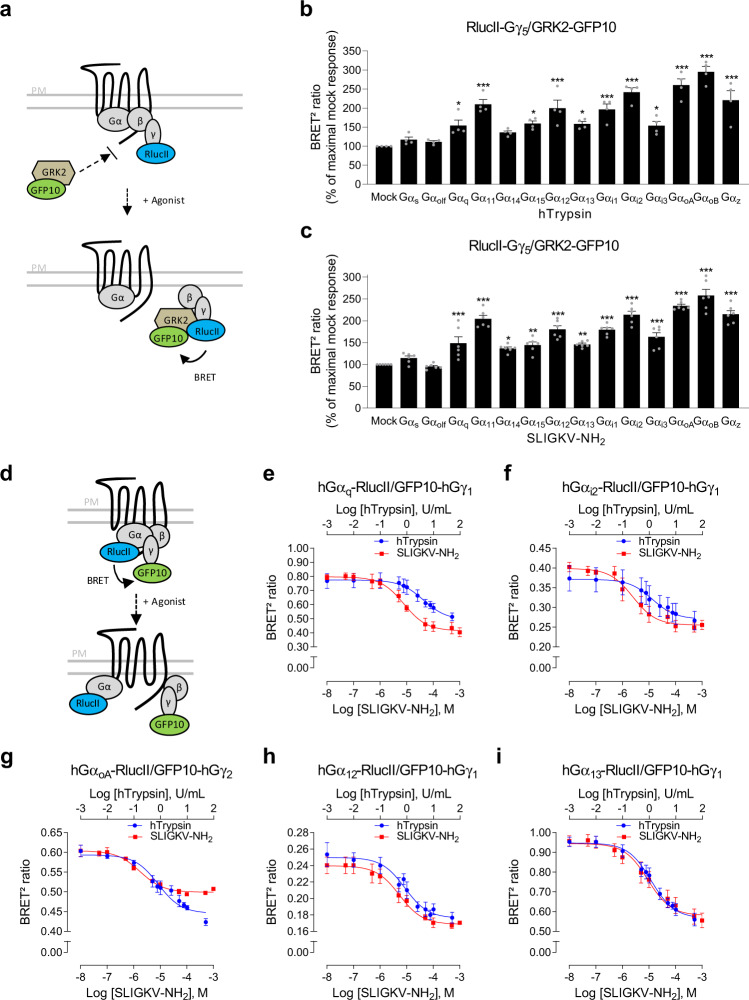
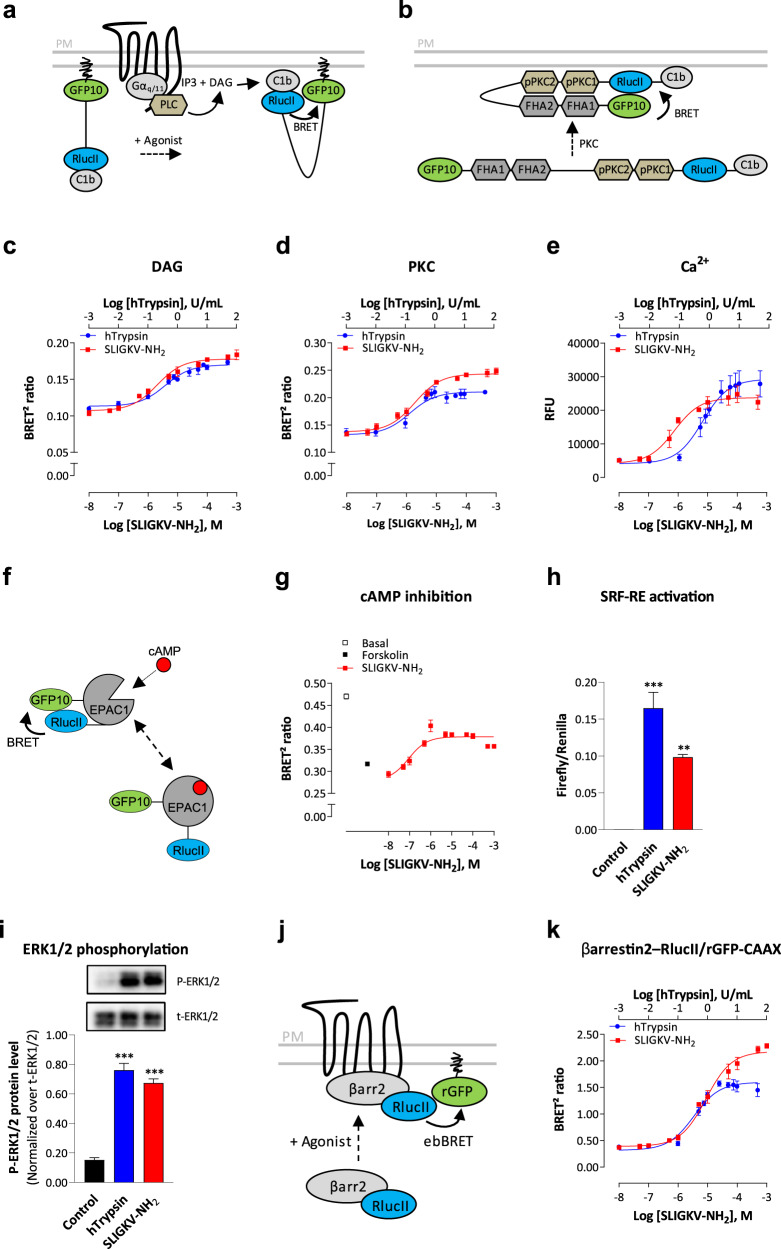
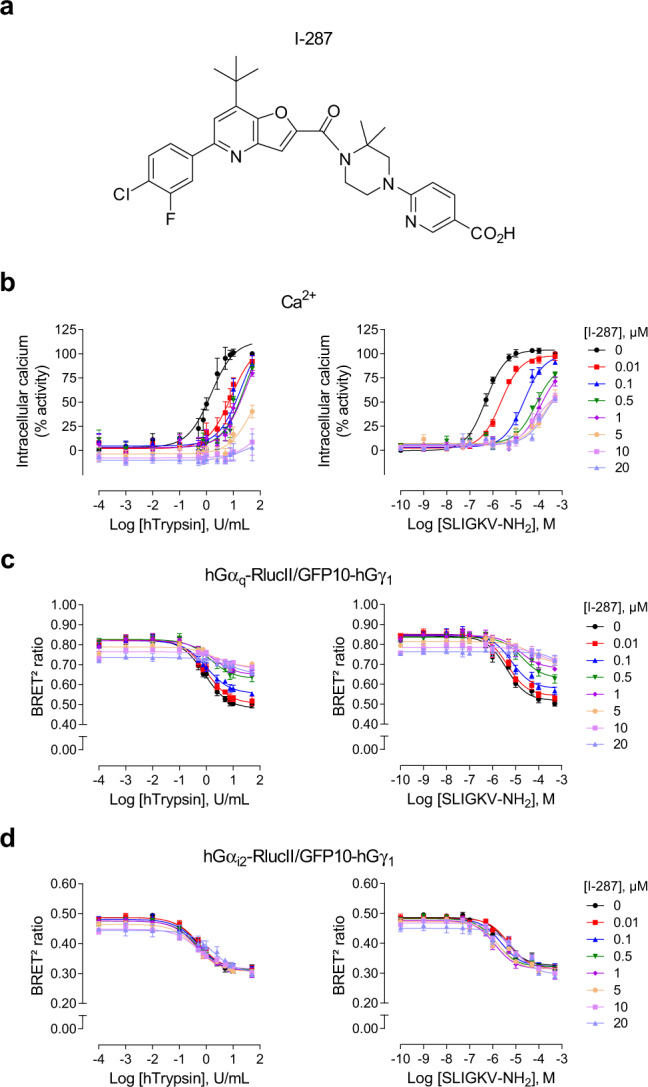
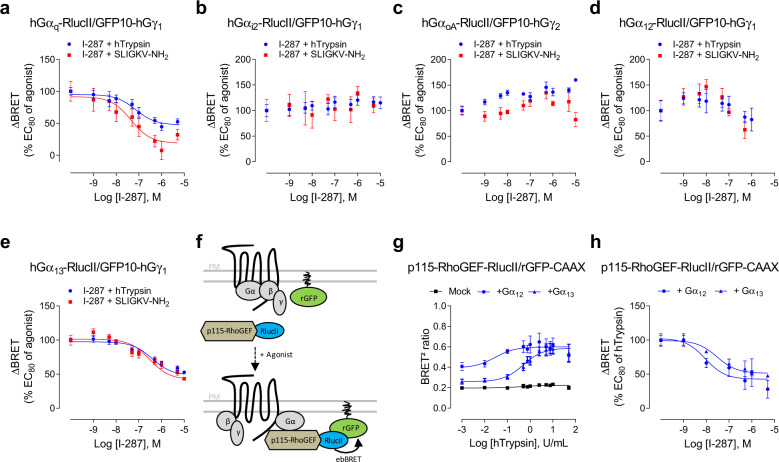
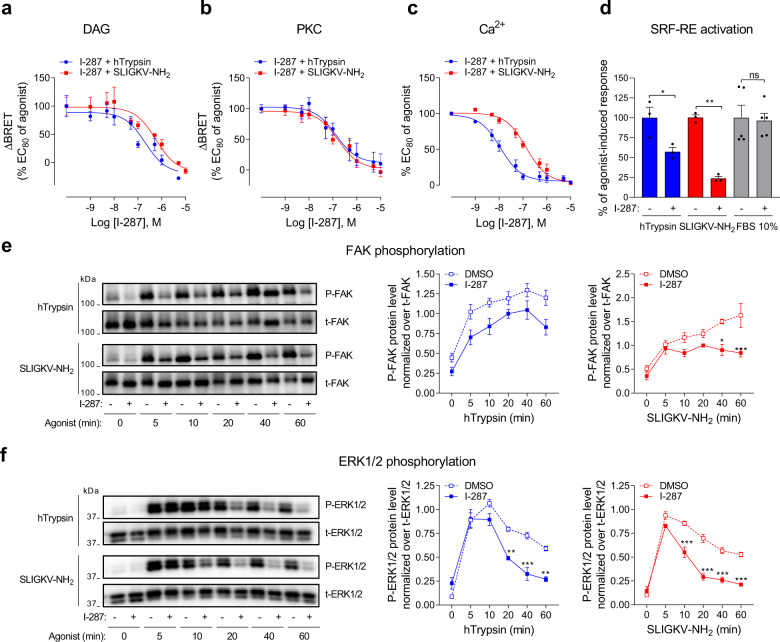
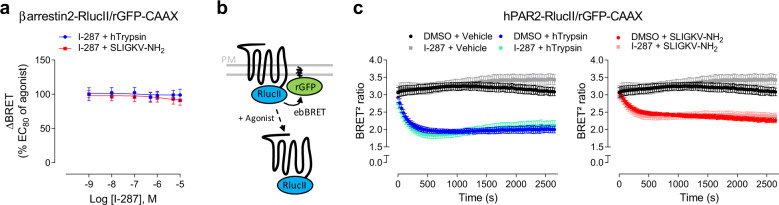
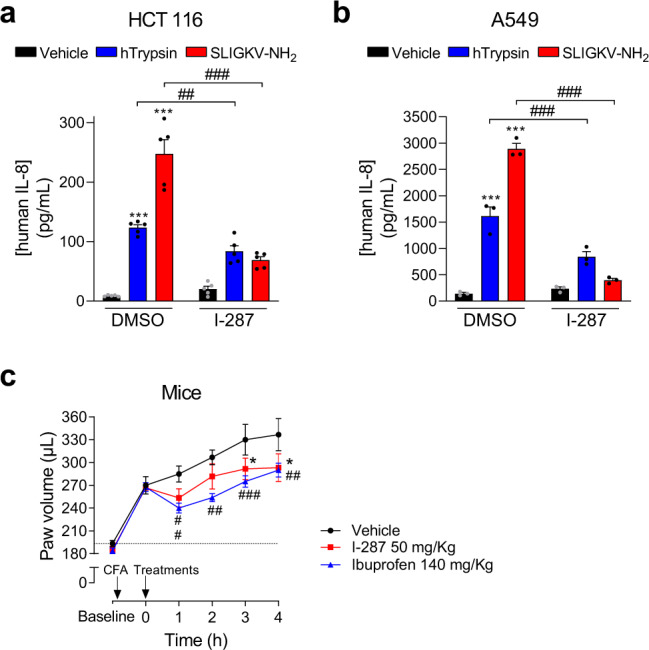
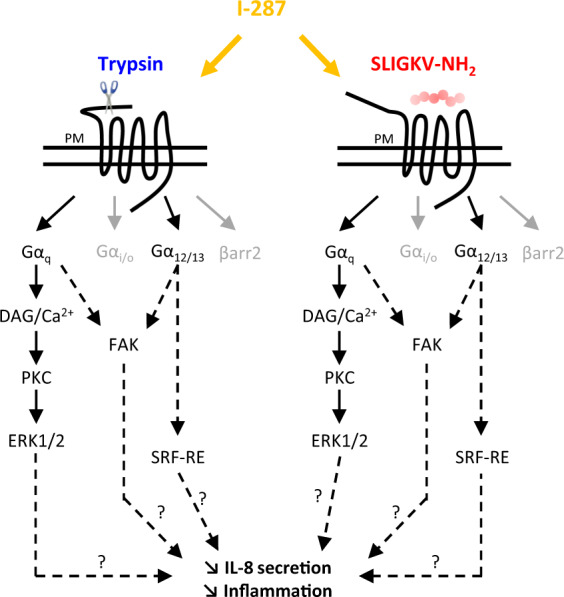
Protease-activated receptor-2 (PAR2) is involved in inflammatory responses and pain, therefore representing a promising therapeutic target for the treatment of immune-mediated inflammatory diseases. However, as for other GPCRs, PAR2 can activate multiple signaling pathways and those involved in inflammatory responses remain poorly defined. Here, we describe a new selective and potent PAR2 inhibitor (I-287) that shows functional selectivity by acting as a negative allosteric regulator on Gαq and Gα12/13 activity and their downstream effectors, while having no effect on Gi/o signaling and βarrestin2 engagement. Such selective inhibition of only a subset of the pathways engaged by PAR2 was found to be sufficient to block inflammation in vivo. In addition to unraveling the PAR2 signaling pathways involved in the pro-inflammatory response, our study opens the path toward the development of new functionally selective drugs with reduced liabilities that could arise from blocking all the signaling activities controlled by the receptor.


Conflict of interest statement

M.S. and F.G. were employees of IRIC at the Université de Montréal during their involvement in this work and are now employees of Domain Therapeutics N.A. to which some of the biosensors used in the present study were licensed for commercial purposes. C.S., Y.B., and C.E.S. were employees of Vertex Pharmaceuticals (Canada) during their involvement in this work and are now employees of Paraza Pharma, Inc., AdMare BioInnovations, and Ra Pharmaceuticals, respectively. Y.B. is CSO at AdMare BioInnovations and the Chair of the BOD of Domain Therapeutics. J.A.M. holds stocks of Vertex Pharmaceuticals. C.E.S. holds stocks of UCB. M.B. is the president of Domain Therapeutics SAB. C.S. and C.E.S. are among the inventers who filed a patent application related to the compound I-287. C.L.G. and M.B. are among the inventers who filed patent applications related to the biosensors used in this work. These biosensors were licensed to Domain Therapeutics for commercial use. C.A., S.G., and L.G. have no competing interests to declare.

Figures

Fig. 1
Fig. 1. G-protein activation profile of hPAR2 in response to hTrypsin and SLIGKV-NH2 in HEK293 cells.
a Schematic representation of the GRK-based BRET biosensor monitoring the activation of selective Gα subunits. Upon agonist stimulation, the Gα subunit dissociates from the βγ dimer (RlucII-Gγ5), allowing GRK2 sensor (GRK2-GFP10) recruitment to the βγ dimer and leading to an increase in BRET2 signal. b, c G-protein activation profiles induced by hTrypsin (10 U/mL, 15 min; b) or SLIGKV-NH2 (1 mM, 15 min; c) in HEK293 cells expressing hPAR2, and components of the G-protein activation sensor (RlucII-Gγ5, GRK2-GFP10, Gβ1, and the indicated Gα subunit). Results are expressed as BRET2 ratio in % of maximal response obtained in mock condition (mean ± SEM; n = 4–6; one-way ANOVA followed by Dunnett’s post hoc: *p < 0.05, **p < 0.01, and ***p < 0.001 compared to mock condition). d Schematic representation of the BRET2-based biosensor monitoring the agonist-promoted Gα and Gγ subunit separation. Upon agonist stimulation, the Gα subunit (Gα-RlucII) dissociates from the βγ dimer (GFP10-Gγ), leading to a decrease in BRET2 signal. ei Dose–response curves of G-protein activation induced by increasing concentrations of hTrypsin or SLIGKV-NH2 (1 min) in HEK293 cells expressing hPAR2, Gβ1, and the BRET2-based α/βγ dissociation biosensors (GFP10-Gγ1 (e, f, h, i) or GFP10-Gγ2 (g) along with the indicated Gα-RlucII subunit). Results are expressed as BRET2 ratio of absolute values (mean ± SEM; n = 3).
Fig. 2
Fig. 2. hPAR2 promotes signaling pathways downstream of Gαq, Gαi/o, and Gα12/13 proteins, and βarrestin2 recruitment at the plasma membrane in HEK293 cells.
a Schematic representation of the unimolecular DAG BRET sensor, which measures the generation of DAG by activated PLC. The recruitment of c1b DAG-binding domain of PKCδ to the plasma membrane by DAG brings RlucII and GFP10 in close proximity, leading to an increase of BRET signal. b Schematic representation of the unimolecular PKC BRET sensor. The phosphorylation of PKC consensus sequences (pPKC1 and 2) induces their interaction with phosphothreonine-binding domains (FHA1 and FHA2) of Rad53 and allows a conformational change, leading to the close proximity of RlucII and GFP10 and an increased BRET signal. c, d Dose–response curves of DAG production (c) and PKC activation (d) induced by increasing concentrations of hTrypsin or SLIGKV-NH2 during 1 (DAG) or 5 min (PKC) in HEK293 cells expressing hPAR2 and the corresponding unimolecular BRET2-based biosensors. Results are expressed as BRET2 ratio of absolute values (mean ± SEM; n = 3). e Dose–response curves of Ca2+ mobilization (increases of peak values in relative fluorescence unit, RFU) induced by increasing concentrations of hTrypsin or SLIGKV-NH2 in HEK293 cells endogenously expressing hPAR2 (mean ± SEM; n = 5–7). f Schematic representation of the unimolecular EPAC BRET sensor, which measures the generation of cAMP by activated adenylate cyclase. cAMP binding to EPAC1 domain induces a conformational change, increasing the distance between RlucII and GFP10, and yielding to a reduction of the BRET signal . g Dose–response curves of hPAR2-mediated inhibition of forskolin-induced cAMP production in HEK293 cells expressing hPAR2. Cells expressing EPAC biosensor were stimulated during 5 min with increasing concentrations of SLIGKV-NH2 and then treated with forskolin (1.5 µM, 5 min) before measurement of cAMP production. Results are expressed as BRET2 ratio of absolute values (mean ± SEM; n = 3). h hPAR2-mediated activation of SRF-RE reporter gene, reflecting RhoA activation, induced by hTrypsin (10 U/mL, 6 h) or SLIGKV-NH2 (100 µM, 6 h) in HEK293 cells expressing hPAR2. Results are expressed as a ratio of Firefly over Renilla luminescence (mean ± SEM; n = 3; one-way ANOVA: **p < 0.01 and ***p < 0.001 compared to control cells). i ERK1/2 phosphorylation in HEK293 cells expressing hPAR2 and stimulated with hTrypsin (1 U/mL) or SLIGKV-NH2 (100 µM) for 10 min. Representative immunoblots of ERK1/2 phosphorylation are shown. Western blottings were quantified and expressed as the ratio of phosphorylated ERK (P-ERK1/2) protein level normalized over total ERK (t-ERK1/2) protein (mean ± SEM; n = 4; one-way ANOVA: ***p < 0.001 compared to control cells). j Schematic representation of the ebBRET-based assay that monitors energy transfer between βarrestin2–RlucII and rGFP-CAAX targeted to the plasma membrane. k Dose–response curves of βarrestin2 recruitment induced by increasing concentrations of hTrypsin or SLIGKV-NH2 (15 min) in HEK293 cells expressing hPAR2 and ebBRET sensors βarrestin2–RlucII/rGFP-CAAX. Results are expressed as BRET2 ratio of absolute values (mean ± SEM; n = 3–4).
Fig. 3
Fig. 3. Identification of I-287 as a negative PAR2 allosteric modulator.
a Chemical structure of compound I-287. b Impact of I-287 pretreatment (30 min) on the Ca2+ responses evoked by increasing concentrations of hTrypsin (left panel) or SLIGKV-NH2 (right panel) in HEK293 cells endogenously expressing hPAR2. Results are expressed as % of the maximal induced-response in the absence of I-287 (% activity; mean ± SEM; n = 3–6). c, d Impact of I-287 pretreatment (15 min) on the Gαq (c) and Gαi2 (d) proteins activation induced after 1 min stimulation with increasing concentrations of hTrypsin (left panel) or SLIGKV-NH2 (right panel) in HEK293 cells co-expressing hPAR2 and the human BRET2-based biosensors Gαq-RlucII or Gαi2-RlucII and GFP10-Gγ1. Results are expressed as BRET2 ratio of absolute values (mean ± SEM; n = 3).
Fig. 4
Fig. 4. Biased effect of I-287 on hPAR2-promoted Gα protein activation.
ae Impact of I-287 on hPAR2-promoted G-protein activation measured by BRET2. HEK293 cells co-expressing hPAR2 and the human BRET2-based α/βγ dissociation biosensors (GFP10-Gγ1 or GFP10-Gγ2 along with the indicated Gα-RlucII subunit), were pretreated with increasing concentrations of I-287 for 15 min followed by 1 min stimulation with an EC80 concentration of hTrypsin or SLIGKV-NH2. Results are expressed as ΔBRET in % of the response induced by EC80 of respective agonists in the absence of I-287 (mean ± SEM; n = 3–6). f Schematic representation of the ebBRET-based biosensor to selectively monitor Gα12/13 activation. Upon agonist stimulation, activated Gα12 or Gα13 subunits recruit their selective effector p115-RhoGEF tagged with RlucII to the plasma membrane, leading to an increase of ebBRET with the membrane-anchored rGFP-CAAX. g Dose–response curves of p115-RhoGEF recruitment at the plasma membrane induced by increasing concentrations of hTrypsin for 1 min in HEK293 cells expressing hPAR2 and the p115-RhoGEF-RlucII/rGFP-CAAX sensors in the absence (mock) or in the presence of Gα12 or Gα13 subunits. Results are expressed as BRET2 ratio of absolute values (mean ± SEM; n = 4). h Inhibitory action of increasing concentrations of I-287 (15 min) on the G12/13-mediated recruitment of p115-RhoGEF at plasma membrane induced by an EC80 concentration of hTrypsin in HEK293 cells co-expressing hPAR2 and the human BRET2-based biosensors p115-RhoGEF-RlucII/rGFP-CAAX along with Gα12 or Gα13 subunits. Results are expressed as ΔBRET in % of the response induced by EC80 of hTrypsin in the absence of I-287 (mean ± SEM; n = 3).
Fig. 5
Fig. 5. I-287 inhibits PAR2-mediated activation of DAG/Ca2+/PKC and RhoA/SRF-RE, as well as FAK and ERK1/2 signaling pathways.
a, b Impact of increasing concentrations of I-287 (15 min) on DAG production (a) and PKC activation (b) induced after 1 (DAG) or 5 (PKC) min stimulation with an EC80 concentration of hTrypsin or SLIGKV-NH2 in HEK293 cells co-expressing hPAR2 and the indicated unimolecular BRET2-based biosensors. Results are expressed as ΔBRET in % of the response induced by EC80 of respective agonists in the absence of I-287 (mean ± SEM; n = 4–5). c Impact of increasing concentrations of I-287 (30 min) on intracellular Ca2+ mobilization induced by an EC80 concentration of hTrypsin or SLIGKV-NH2 in HEK293 cells endogenously expressing hPAR2. Results are expressed as % of the response induced by respective agonists in the absence of I-287 (mean ± SEM; n = 3-4). d Impact of I-287 (10 µM, 30 min) on hPAR2-promoted SRF-RE reporter gene activation induced after 6 h stimulation with hTrypsin (10 U/mL) or SLIGKV-NH2 (100 µM) in HEK293 cells expressing hPAR2. FBS (10%) was used as control. Results are expressed as % of the response induced by respective agonists in the absence of I-287 (mean ± SEM; n = 3–5; unpaired t-test: *p < 0.05 and **p < 0.01 compared to respective control cells, ns: nonsignificant). e, f Kinetics of FAK and ERK1/2 phosphorylation in HEK293 cells expressing hPAR2 and pretreated with DMSO or I-287 (10 µM, 30 min) before stimulation with hTrypsin (1 U/mL) or SLIGKV-NH2 (100 µM) at the indicated times. Representative immunoblots of FAK and ERK1/2 phosphorylation are shown. Western blots were quantified and expressed as the ratio of phosphorylated protein level (P-FAK or P-ERK1/2) normalized over total protein (t-FAK or t-ERK1/2; mean ± SEM; n = 3–5; two-way ANOVA followed by Tukey’s post hoc test: *p < 0.05, **p < 0.01, and ***p < 0.001 compared to DMSO-treated cells at the respective time).
Fig. 6
Fig. 6. I-287 has no effect on βarrestin2 recruitment and PAR2 internalization.
a Impact of increasing concentrations of I-287 (15 min) on βarrestin2 recruitment at the plasma membrane induced by an EC80 concentration of hTrypsin or SLIGKV-NH2 (15 min) in HEK293 cells co-expressing hPAR2 and the ebBRET sensors βarrestin2–RlucII/rGFP-CAAX. Results are expressed as ΔBRET in % of the response induced by EC80 of respective agonists in the absence of I-287 (mean ± SEM; n = 5). b Schematic representation of receptor internalization BRET-based biosensor using the hPAR2-RlucII and rGFP-CAAX sensors to monitor loss of hPAR2 from cell surface. c Impact of I-287 (1 µM, 15 min) on hPAR2 internalization kinetics induced by an EC80 concentration of hTrypsin or SLIGKV-NH2 in HEK293 cells expressing the hPAR2-RlucII/rGFP-CAAX sensors. Results are expressed as BRET2 ratio of absolute values (mean ± SEM; n = 3).
Fig. 7
Fig. 7. I-287 inhibits PAR2-induced secretion of IL-8 cytokine in vitro and reduces CFA-induced inflammation in mice.
a, b Impact of I-287 (10 µM, 30 min) on hPAR2-promoted IL-8 cytokine release induced after 6 h stimulation with vehicle, hTrypsin (1 U/mL) or SLIGKV-NH2 (100 µM) in culture medium of HCT 116 (a) and A549 (b) cells expressing hPAR2. Data are expressed as IL-8 concentration in pg/mL (mean ± SEM; n = 3–5; two-way ANOVA followed by Tukey’s post hoc test: ***p < 0.001 compared to control cells with vehicle; ##p < 0.01 and ###p < 0.001 compared to control cells with respective agonist). c Impact of I-287 on complete Freund’s adjuvant (CFA)-induced inflammation in mice. One hour after CFA injection, mice were given I-287 (50 mg/kg) or vehicle (95% TPGS – 5% NMP) by gavage. A group of animals received Ibuprofen (140 mg/kg) as a reference drug. The volume of the hindpaw was measured every hour to evaluate swelling/inflammation using a plethysmometer (mean ± SEM; n = 6 for vehicle and I-287 groups and n = 8 for Ibuprofen group; two-way repeated-measures ANOVA followed by Dunnett’s post hoc test: *p < 0.05 for I-287 vs. vehicle and ##p < 0.01, ###p < 0001 for Ibuprofen vs. vehicle).
Fig. 8
Fig. 8. Effect of I-287 on intracellular signaling pathways induced by the two human PAR2 agonists, Trypsin, and SLIGKV-NH2.
The pathways inhibited by I-287 are in black, whereas the unaffected pathways are in gray.

Similar articles

Cited by

References

    1. Adams MN, et al. Structure, function and pathophysiology of protease activated receptors. Pharm. Ther. 2011;130:248–282. doi: 10.1016/j.pharmthera.2011.01.003. - DOI - PubMed
    1. Ramachandran R, Noorbakhsh F, Defea K, Hollenberg MD. Targeting proteinase-activated receptors: therapeutic potential and challenges. Nat. Rev. Drug Discov. 2012;11:69–86. doi: 10.1038/nrd3615. - DOI - PubMed
    1. Nystedt S, Emilsson K, Wahlestedt C, Sundelin J. Molecular cloning of a potential proteinase activated receptor. Proc. Natl Acad. Sci. USA. 1994;91:9208–9212. doi: 10.1073/pnas.91.20.9208. - DOI - PMC - PubMed
    1. Oikonomopoulou K, et al. Proteinase-mediated cell signalling: targeting proteinase-activated receptors (PARs) by kallikreins and more. Biol. Chem. 2006;387:677–685. doi: 10.1515/BC.2006.086. - DOI - PubMed
    1. Camerer E, Huang W, Coughlin SR. Tissue factor- and factor X-dependent activation of protease-activated receptor 2 by factor VIIa. Proc. Natl Acad. Sci. USA. 2000;97:5255–5260. doi: 10.1073/pnas.97.10.5255. - DOI - PMC - PubMed

Publication types

MeSH terms

Substances

LinkOut - more resources