. 2020 Nov 27;3(1):723.
doi: 10.1038/s42003-020-01452-9.

An inducible CRISPR interference library for genetic interrogation of Saccharomyces cerevisiae biology

Affiliations

An inducible CRISPR interference library for genetic interrogation of Saccharomyces cerevisiae biology

Amir Momen-Roknabadi et al. Commun Biol. .

Abstract

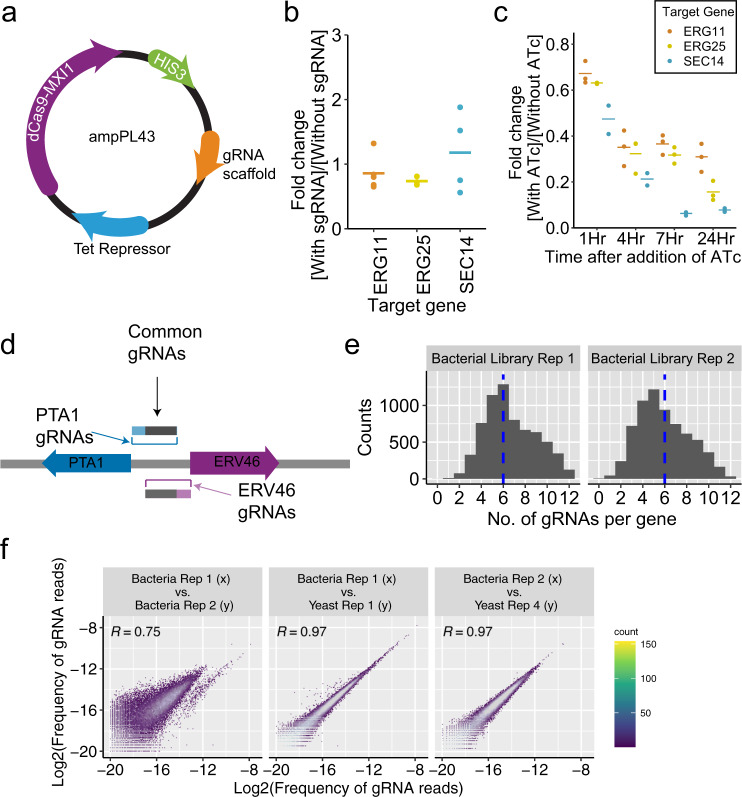
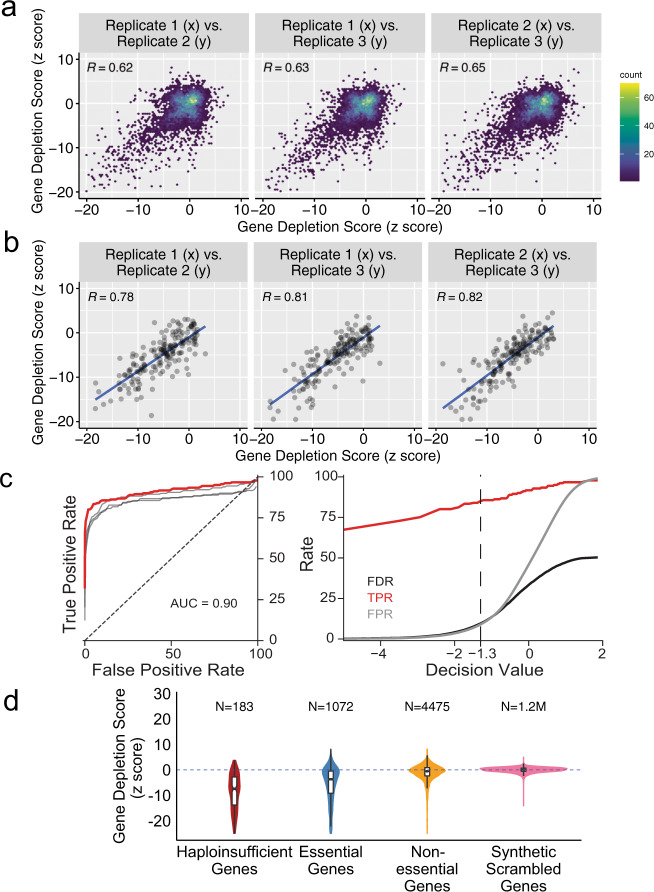
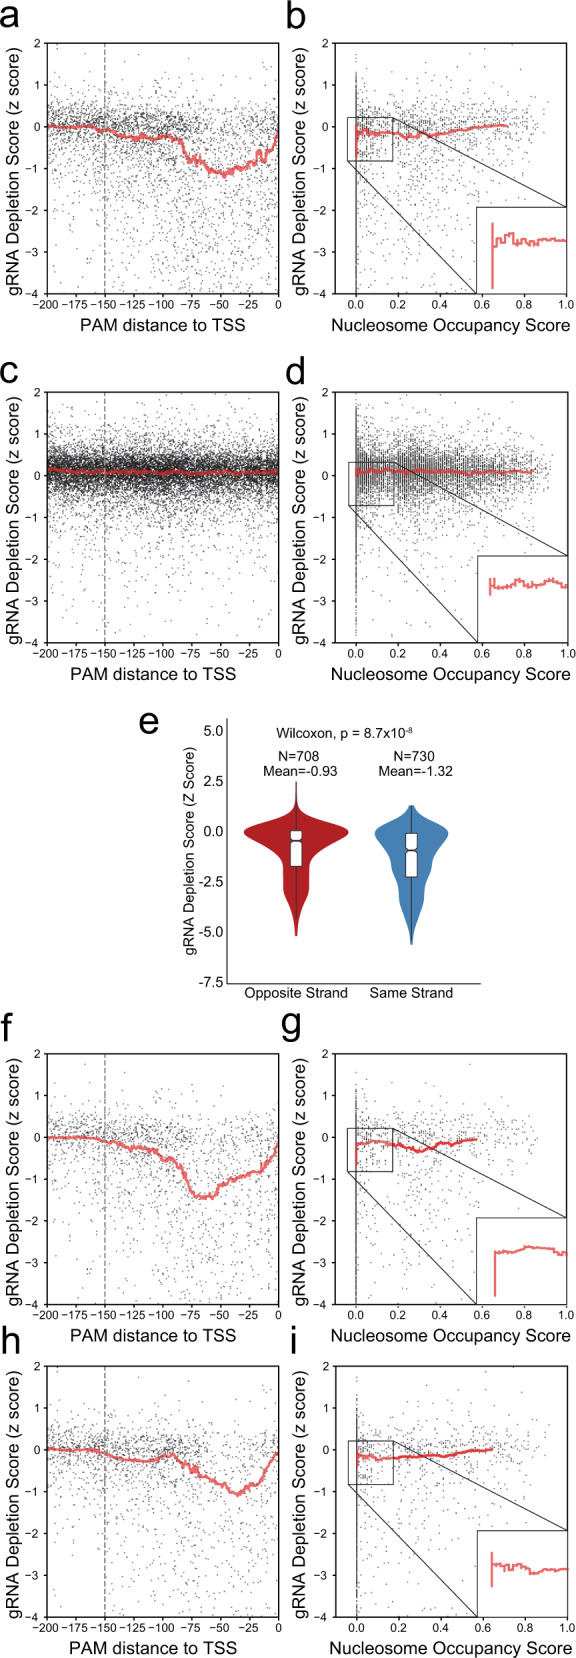
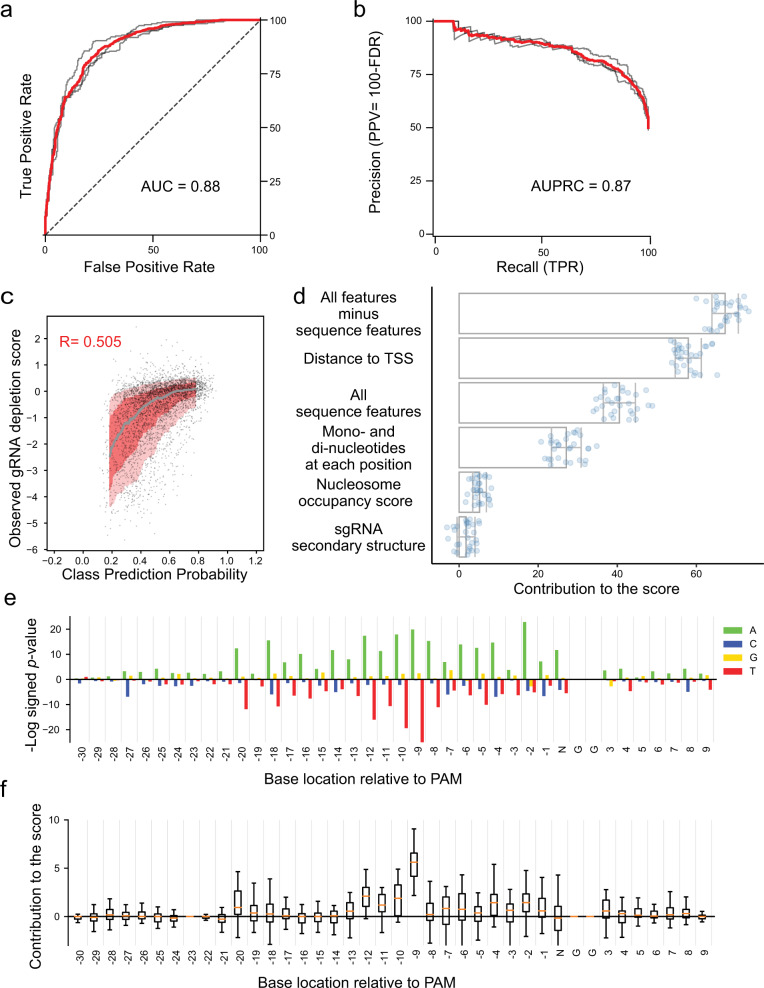
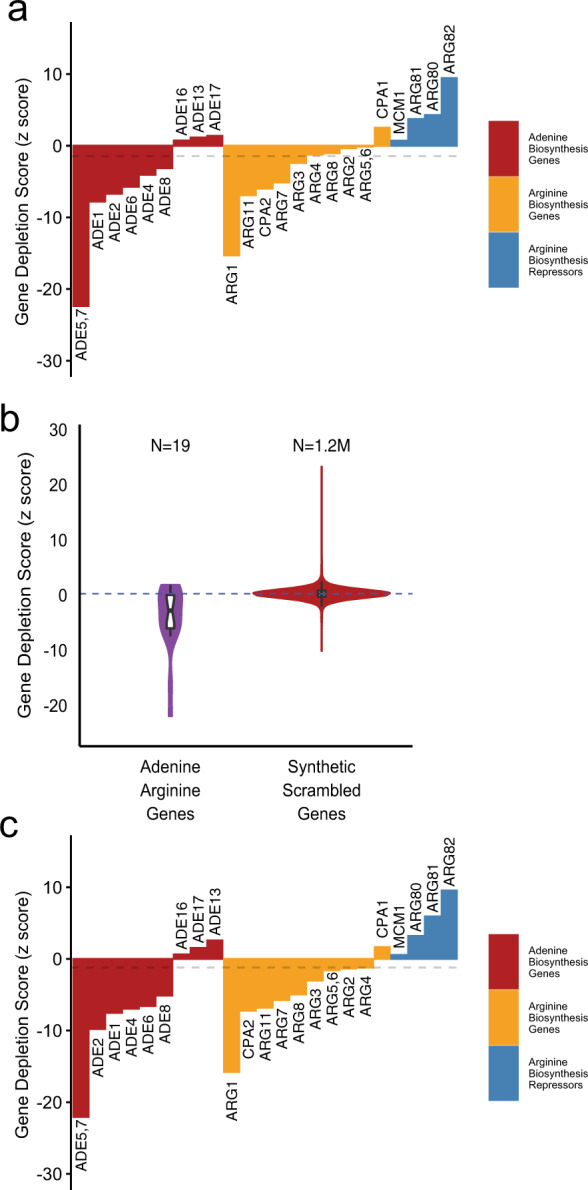
Genome-scale CRISPR interference (CRISPRi) is widely utilized to study cellular processes in a variety of organisms. Despite the dominance of Saccharomyces cerevisiae as a model eukaryote, an inducible genome-wide CRISPRi library in yeast has not yet been presented. Here, we present a genome-wide, inducible CRISPRi library, based on spacer design rules optimized for S. cerevisiae. We have validated this library for genome-wide interrogation of gene function across a variety of applications, including accurate discovery of haploinsufficient genes and identification of enzymatic and regulatory genes involved in adenine and arginine biosynthesis. The comprehensive nature of the library also revealed refined spacer design parameters for transcriptional repression, including location, nucleosome occupancy and nucleotide features. CRISPRi screens using this library can identify genes and pathways with high precision and a low false discovery rate across a variety of experimental conditions, enabling rapid and reliable assessment of genetic function and interactions in S. cerevisiae.


Conflict of interest statement

The authors declare no competing interests.

Figures

Fig. 1
Fig. 1. CRISPRi library design and properties.
a Schematic of amPL43 expression vector for inducible CRISPRi library in S. cerevisiae. b The expression fold change of each target: ERG25 (three replicates), ERG11 (five replicates), and Sec14 (four replicates), as a result of presence of sgRNA, without induction after 24 hours, as measured by qPCR. The mean for each sample is represented by a solid line. c The expression fold change of each target: ERG25 (three replicates), ERG11 (three replicates), and Sec14 (two replicates), as a result of gRNA induction by ATc, was calculated over time by qPCR. The mean for each sample is represented by a solid line. d Schematic depicting the genomic region of PTA1 and ERV46. The gRNAs targeting the region between the two genes, depending on their proximity to each gene, could affect both genes. e Histogram depicting the number of gRNAs per gene in two library replicates. The dashed blue line denotes the median: ~6. f Scatter plot depicting the frequency of reads per gRNA between select biological replicates of the CRISPRi library. Pearson Correlation R value is reported for each pair.
Fig. 2
Fig. 2. High-throughput identification of haploinsufficient and dosage-sensitive genes.
a Binned scatter plots of gene depletion score between the replicates. Pearson Correlation R value is reported for each pair. b Binned scatter plots of gene depletion score, limited to haploinsufficient genes, between the replicates. Pearson Correlation R value is reported for each pair. c The Receiver Operating Characteristic Curve (ROC) for the detection of haploinsufficient genes and FDR, TPR, and FPR trends based on decision values. ROC curve shows that the depletion z score is a strong classifier for haploinsufficient genes. The individual replicates are shown in gray. Area under the curve is 0.90. Dashed line denotes the decision value for FDR < 10%. d Violin plots depicting the gene depletion score distribution for the haploinsufficient genes, essential genes, nonessential genes and synthetic scrambled genes, resulting from 200× random sampling of synthetic randomly shuffled gRNAs, in induced (SC-His+ATc) versus uninduced samples (SC-His-ATc).
Fig. 3
Fig. 3. Correlation of gRNA depletion score with distance to TSS, nucleosome occupancy score, and strandedness.
a Scatter plot depicting the gRNA depletion score for gRNAs targeting dosage-sensitive essential genes versus the distance from TSS. The red line represents the rolling average (window of 200). The dashed line signifies 150 bp upstream of TSS. b Scatter plot depicting the gRNA depletion score for gRNAs targeting dosage-sensitive essential genes versus the nucleosome occupancy score. The red line represents the rolling average (window of 200). c Scatter plot depicting the gRNA depletion score for gRNAs targeting nonessential genes versus the distance from TSS. The dashed line signifies 150 bp upstream of TSS. The red line represents the rolling average as above. d Scatter plot depicting the gRNA depletion score for gRNAs targeting nonessential genes versus the nucleosome occupancy score. The red line represents the rolling average as above. e Violin plots depicting the distribution of gRNA depletion scores for gRNAs on the opposite or same strand as the target ORF. f Scatter plot depicting the gRNA depletion score for gRNAs targeting dosage-sensitive essential genes with PAM on the same strand as TSS versus the distance from TSS. The red line represents the rolling average as above. The dashed line marks 150 bp upstream of TSS. g Scatter plot depicting the gRNA depletion score for gRNAs targeting dosage-sensitive essential genes with PAM on the same strand as TSS versus the nucleosome occupancy score. The red line represents the rolling average as above. h Scatter plot depicting the gRNA depletion score for gRNAs targeting dosage-sensitive essential genes with PAM on the opposite strand as TSS versus the distance from TSS. The red line represents the rolling average as above. The dashed line marks 150 bp upstream of TSS. i Scatter plot depicting the gRNA depletion score for gRNAs targeting dosage-sensitive essential genes with PAM on the opposite strand as TSS versus the nucleosome occupancy score. The red line represents the rolling average as above.
Fig. 4
Fig. 4. A random forest model can classify efficient gRNAs.
a The receiver operating characteristic curve (ROC) for the classification of efficient sgRNAs using random forest classification (one of the ten replicates). ROC curve shows strong classifier performance. The individual trends for the three cross-validation models assessed on their respective testing set are shown in gray. Area under the curve is 0.88. b The Precision–Recall curve for the classification of the efficient sgRNAs using random forest (one of the ten replicates). The individual trends for the three cross-validation models assessed on their respective testing set are shown in gray. Area under the curve is 0.87. c Class prediction probability vs. observed gRNA depletion score for the random forest classifier. The class prediction probability is based on the probability of the gRNA being classified as efficient by the classifier, and therefore does not have the same range as the observed gRNA depletion scores. The spearman correlation is 0.505. d Percentage contribution of the features to the predicted efficacy score of gRNA. The features were the distance of PAM to TSS, sequence features (GC Content, longest run of each poly nucleotide, mono- and di-nucleotide composition at each position), nucleosome score and stability of sgRNA. The error bars are equivalent to the standard deviation. e -Log of signed p value of the over and under representation of each nucleotide in every position for the top 20% gRNAs predicted to be efficient compared with all the gRNAs in the model. For each position, we inferred the significance of having A, G, C, or T at that position. P value was calculated using a hypergeometric test. f The contribution of each base to the efficacy of gRNA was calculated by shuffling the nucleotides at that position between all of the test set. The box extends from the lower to the upper quartile values, while whiskers extend 1.5 times the interquartile range from the edge of the box.
Fig. 5
Fig. 5. Identification of adenine and arginine biosynthetic genes.
a Bar plots showing the depletion scores for the known annotated genes involved in adenine and arginine biosynthesis pathways in addition to arginine regulatory genes. Dashed gray line marks the threshold for FDR = 10%. b Violin plots depicting the gene depletion score distribution for the adenine arginine deprivation experiment (SC-His-Ade-Arg +ATc vs. SC-His +ATc), shown for the known adenine/arginine biosynthetic genes, and synthetic scrambled genes, resulting from 200× random sampling of synthetic randomly shuffled gRNAs. c Bar plots showing the depletion scores for the annotated genes involved in adenine and arginine biosynthesis pathways in addition to arginine regulatory genes, restricted to gRNAs with PAM located within 150 bp of TSS. Dashed gray line marks the threshold for FDR = 10%.

Similar articles

Cited by

References

    1. Burns N, et al. Large-scale analysis of gene expression, protein localization, and gene disruption in Saccharomyces cerevisiae. Genes Dev. 1994;8:1087–1105. doi: 10.1101/gad.8.9.1087. - DOI - PubMed
    1. Deutschbauer AM, et al. Mechanisms of haploinsufficiency revealed by genome-wide profiling in yeast. Genetics. 2005;169:1915–1925. doi: 10.1534/genetics.104.036871. - DOI - PMC - PubMed
    1. Giaever G, et al. Genomic profiling of drug sensitivities via induced haploinsufficiency. Nat. Genet. 1999;21:278–283. doi: 10.1038/6791. - DOI - PubMed
    1. Girgis HS, Liu Y, Ryu WS, Tavazoie S. A comprehensive genetic characterization of bacterial motility. PLoS Genet. 2007;3:1644–1660. doi: 10.1371/journal.pgen.0030154. - DOI - PMC - PubMed
    1. Qian W, Ma D, Xiao C, Wang Z, Zhang J. The genomic landscape and evolutionary resolution of antagonistic pleiotropy in yeast. Cell Rep. 2012;2:1399–1410. doi: 10.1016/j.celrep.2012.09.017. - DOI - PMC - PubMed

Publication types