Review
. 2021 Oct 15:474:63-79.
doi: 10.1016/j.neuroscience.2020.11.014. Epub 2020 Nov 26.

Glymphatic Cerebrospinal Fluid and Solute Transport Quantified by MRI and PET Imaging

Affiliations
Review

Glymphatic Cerebrospinal Fluid and Solute Transport Quantified by MRI and PET Imaging

Helene Benveniste et al. Neuroscience. .

Abstract

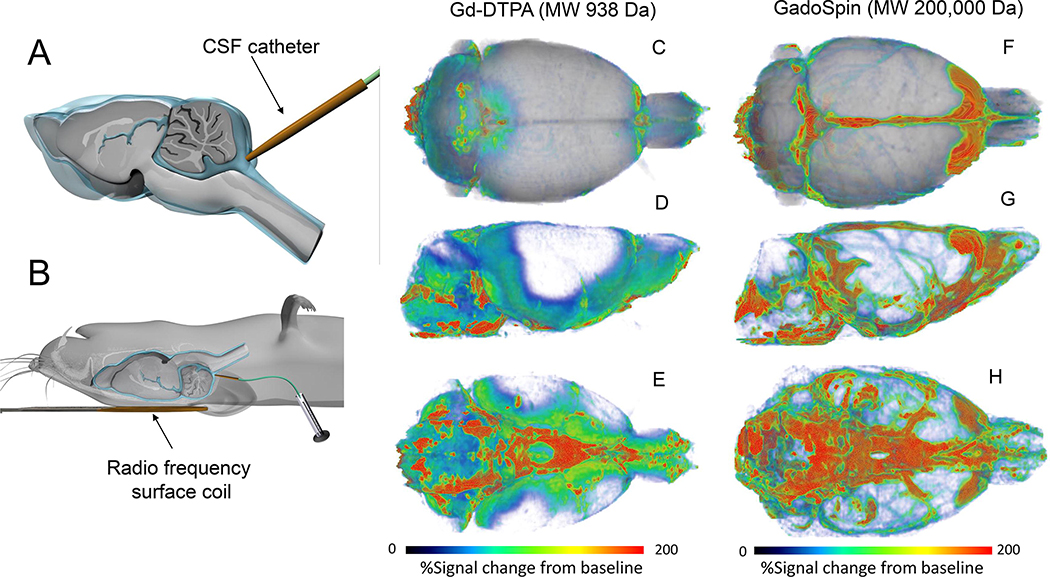
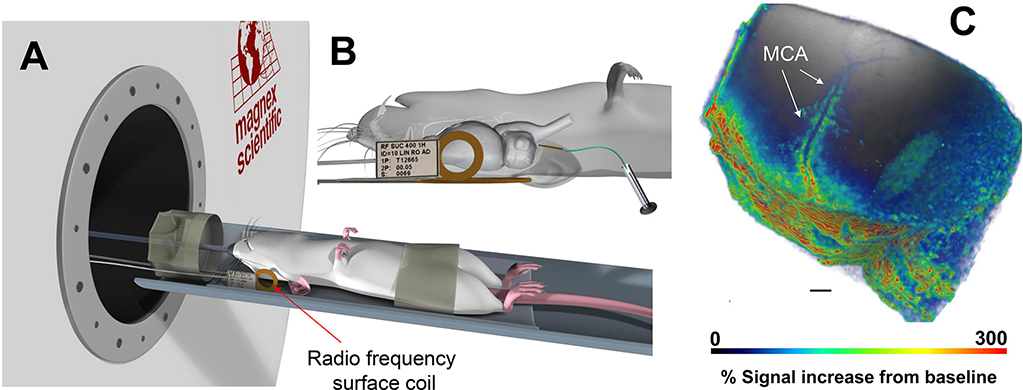
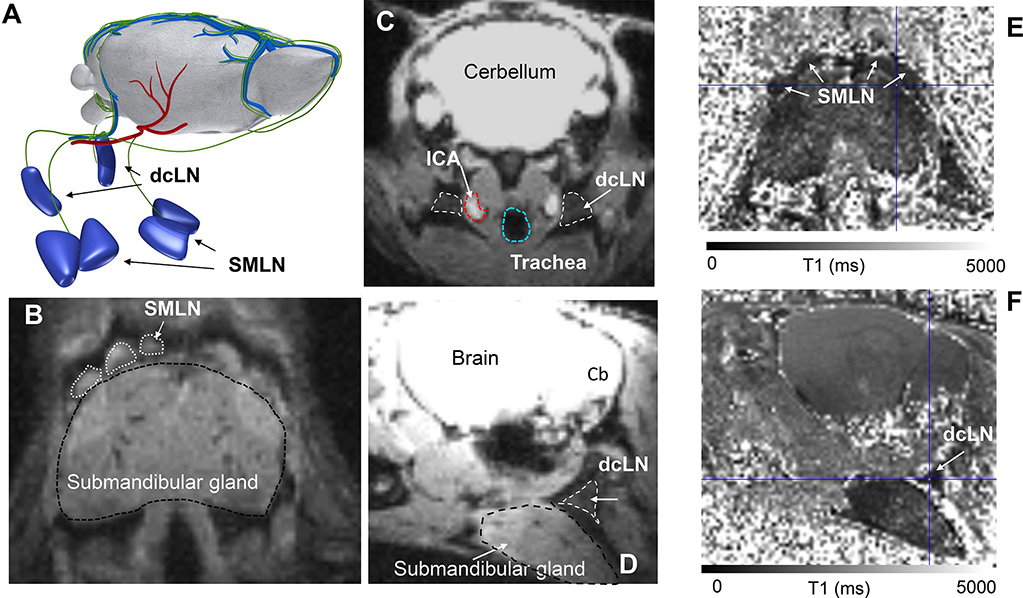
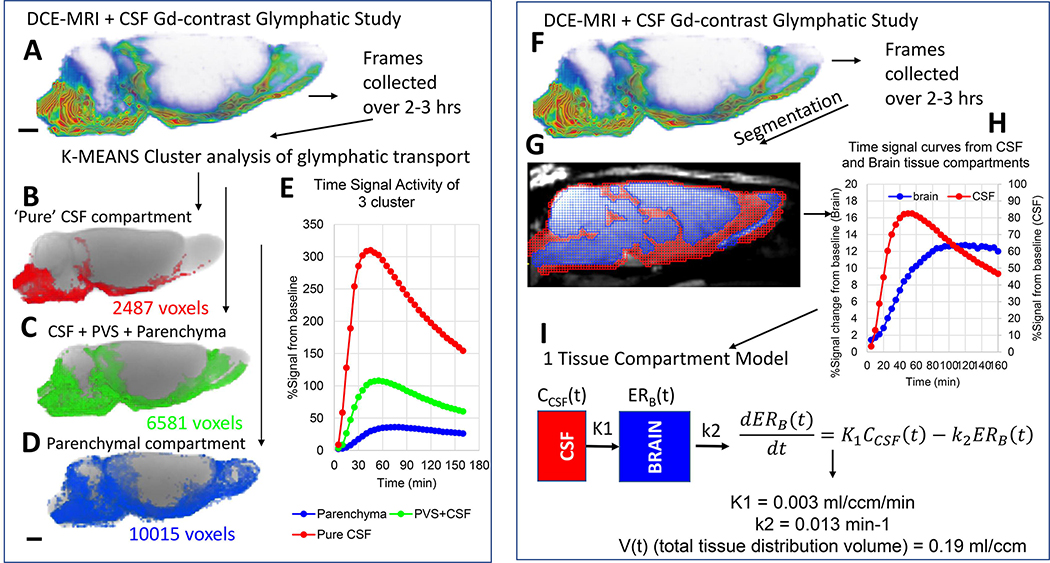
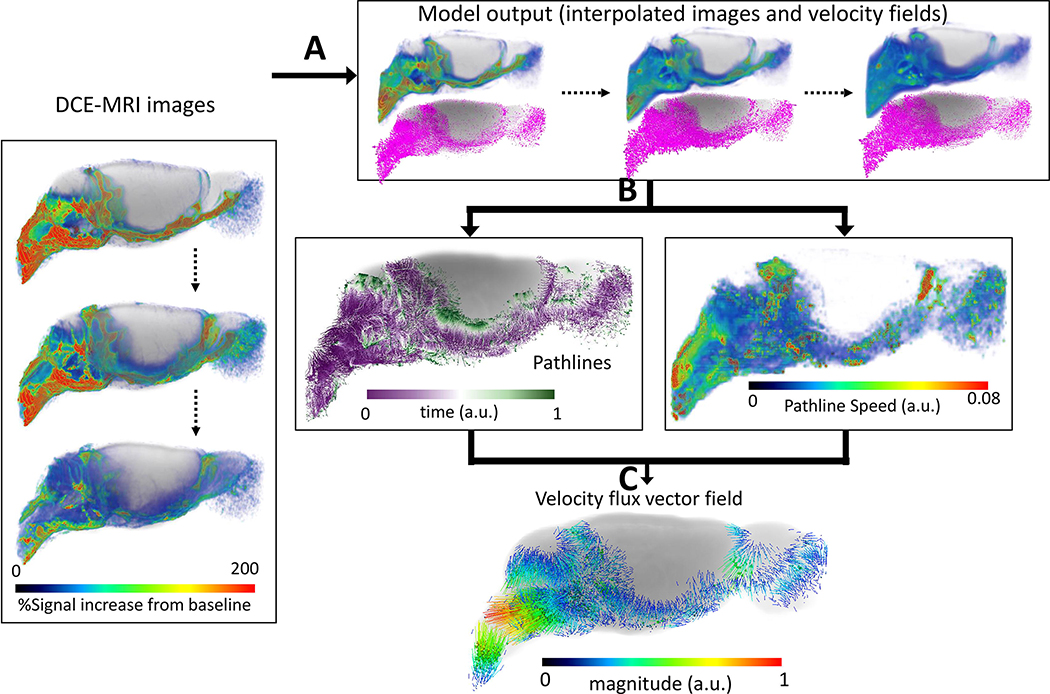
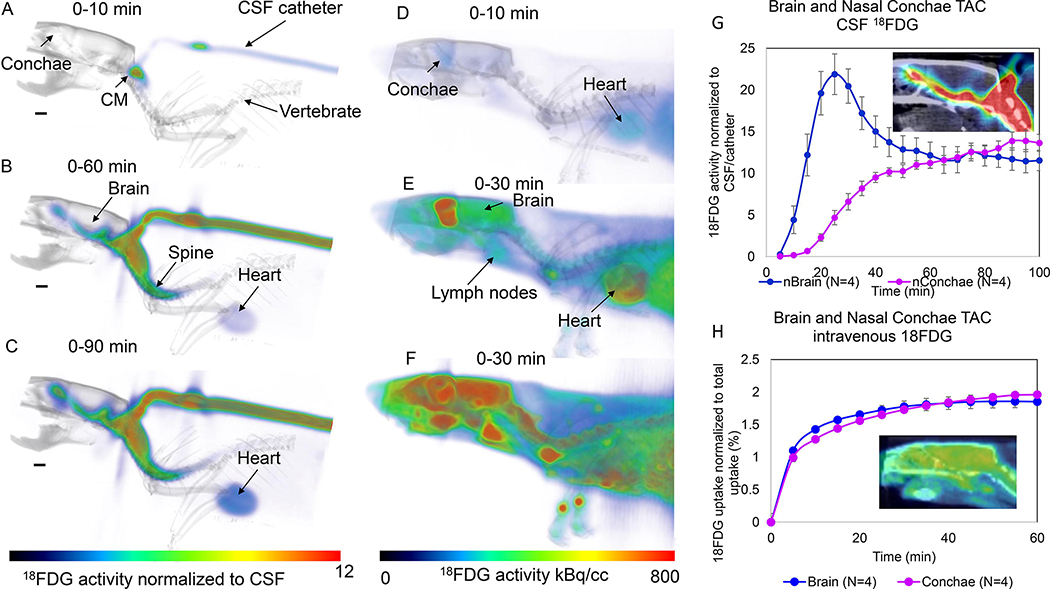
Over the past decade there has been an enormous progress in our understanding of fluid and solute transport in the central nervous system (CNS). This is due to a number of factors, including important developments in whole brain imaging technology and computational fluid dynamics analysis employed for the elucidation of glymphatic transport function in the live animal and human brain. In this paper, we review the technical aspects of dynamic contrast enhanced magnetic resonance imaging (DCE-MRI) in combination with administration of Gd-based tracers into the cerebrospinal fluid (CSF) for tracking glymphatic solute and fluid transport in the CNS as well as lymphatic drainage. Used in conjunction with advanced computational processing methods including optimal mass transport analysis, one gains new insights into the biophysical forces governing solute transport in the CNS which leads to intriguing new research directions. Considering drainage pathways, we review the novel T1 mapping technique for quantifying glymphatic transport and cervical lymph node drainage concurrently in the same subject. We provide an overview of knowledge gleaned from DCE-MRI studies of glymphatic transport and meningeal lymphatic drainage. Finally, we introduce positron emission tomography (PET) and CSF administration of radiotracers as an alternative method to explore other pharmacokinetic aspects of CSF transport into brain parenchyma as well as efflux pathways.

Keywords: cerebrospinal fluid; gadolinium; glymphatic; lymphatic; magnetic resonance imaging; positron emission tomography.


Conflict of interest statement

Conflicts of interest: None

Figures

Fig. 1.
Fig. 1.. Overview of dynamic contrast enhanced MRI with Gd-contrast into CSF
A: Illustration of catheter position for Gd- contrast delivery into cerebrospinal fluid (CSF, blue liquid) via the cisterna magna of a rat brain. The rat brain is shown in a sagittal transverse cut to show the CSF compartment (blue) in relation to the brain tissue (grey color). B: In preparation for magnetic resonance imaging (MRI) and glymphatic transport, the anesthetized rat with the indwelling CSF catheter is positioned supine with the small radio frequency surface coil placed under the head. C-E: 3D volume rendered dynamic contrast enhanced MRI (DCE)-MRI) images of a rat brain in top (C), lateral decubitus (D) and caudal/ventral view (E) are shown ~ 90 min after CSF administration of Gd-DTPA (molecular weight, (MW) 938 Da). The DCE-MRI data has been processed so that the color-coded map represents ‘% signal change from baseline’. Red and blue colors represent high and low glymphatic transport of Gd-DTPA, respectively. There is high glymphatic uptake of Gd-DTPA into the cerebellum, ventral hippocampus, and olfactory bulb. F-H: 3D volume rendered DCE-MRI of another rat ~ 90 min after CSF administration of GadoSpin which is a large molecule (MW 200,000 Da) compared to Gd-DTPA. Again, the color-coded map represents %signal from baseline. The distribution pattern of GadoSpin is remarkably different from Gd-DTPA and the bulk of the signal remains in the CSF compartment and the perivascular space along large arteries on the ventral surface of the brain. There is almost no tissue uptake of GadoSpin over 90 min. DCE-MRI data are from Iliff et al., (Iliff, et al., 2013).
Fig. 2.
Fig. 2.. Dynamic contrast enhanced MRI for tracking perivascular solute transport
A: Illustration of anesthetized rodent positioned supine with the small radio-frequency (RF) surface coil positioned on the lateral side of the head. B: Higher magnification of the RF surface coil position with details of the rat brain and indwelling CSF catheter showing that only part of the rat’s brain is captured in this experimental set up. C: 3D volume rendered MRI of glymphatic transport of 1:5 dilution of Gd-DOTA ~90min after administration into CSF. The higher ‘mass’ of Gd-DOTA administered enables tracking of solute movement along the middle cerebral artery (MCA). Scale bar = 2mm. Data are from Koundal et al., (Koundal, et al., 2020).
Fig. 3:
Fig. 3:. T1 mapping for quantifying glymphatic and cervical lymph node transport
A: Illustration of the superficial submandibular lymph nodes (SMLN) and deep cervical lymph nodes (dcLN) in relation to the whole rodent brain. The green vasculature represents meningeal and extracranial lymphatic vessels draining to the nodes. We note that the illustration of the afferent draining lymphatics to the nodes are not based on accurate anatomical landmarks. B: Proton density weighted (PDW) MRI from a mouse at the level of the submandibular gland showing the position of the SMLN. C: PDW MRI from mouse illustrating the position of the dcLN in relation to key anatomical landmarks including the internal carotid artery (ICA) and trachea in an axial cut. D: Sagittal cut of the same PDW MRI shown in C, illustrating that the dcLN is positioned deep to the submandibular gland. E: Corresponding T1 map from a mouse shown in B after CSF administration of Gd-DOTA. The darkness of the SMLNs indicates that Gd-DOTA has drained from the CSF/brain to the nodes thereby shortening the T1. F: The same T1 map as shown in E now sliced at the level of the dcLN which appear as a dark triangle due to uptake of Gd-DOTA. MRI data are from Xue et al., (Xue, et al., 2020).
Fig. 4:
Fig. 4:. Glymphatic transport analysis by k-means cluster analysis and kinetic modeling
A: DCE-MRI glymphatic study with CSF Gd-DOTA from a normal 3M old Sprague Dawley rat. The time-series of DCE-MRI images is used as data input for the k-means cluster analysis. B-D: Three tissue ‘cluster’ compartments derived from the cluster analysis are shown as binary volume rendered color-coded masks overlaid on the corresponding anatomical brain. The red cluster (B) represents the smallest volume and is located in the CSF compartment proper. The large blue cluster represents ‘parenchymal’ glymphatic transport (D). The green cluster (C) represents mixed cluster of subarachnoid CSF, peri-vascular CSF of large arteries as well as adjacent tissue. E: The corresponding time signal curves (TSC) from each of the three clusters are shown. The red CSF cluster TSC is characterized by high peak magnitude (~300% signal increase) and rapid decay. The blue parenchymal TSC is characterized by lowest peak signal magnitude and slowest decay when compared to the other two clusters which contain CSF. F: DCE-MRI glymphatic study of normal rat. G: The red and blue masks overlaid on the MRI represent the CSF and tissue compartment derived using voxel-based morphometry analysis. H: The CSF and tissue masks are used to extract TSC from the two compartments. I: Mathematical expression of 1-tissue compartment model and the derived quantitative output. K1 = influx rate constant and k2 is the efflux rate constant. For more detail see (Mortensen, et al., 2019).
Fig. 5:
Fig. 5:. Regularized optimal mass transport (rOMT) analysis of glymphatic solute transport
Computational processing pipeline of rOMT analysis: A: DCE-MRI images over a pre-defined time period (45–210 min) after CSF administration of Gd-DTPA are fed into the transport (rOMT) model which, returns interpolated images and dynamic velocity fields. B: Lagrangian dynamic formulation is employed to process the output to obtain glymphatic solute pathlines and pathline speed. The binary pathlines show the trajectories of solute transport and the purple to green color of each pathline represents start points to end points, respectively. The total volume of the pathline network measures the volume of dynamic glymphatic flow. The pathline speed reflects the relative speed within the pathlines which, is used to evaluate transport difference across the brain compartments. C: The velocity flux vector field of the pathlines can also be derived and demonstrates the direction and magnitude of glymphatic solute movement. (MRI data are from Benveniste et al., (Benveniste, et al., 2017)).
Fig. 6:
Fig. 6:. Brain-wide glymphatic transport in rat brain of 18FDG evaluated by PET-CT
A-C: Dynamic summed 18FDG PET images are shown (A = 0–10min), B = 0–60 min, C = 0–90min from the time of administration of 18FDG into the CSF via the cisterna magna (CM). The 3D volume rendered color-coded maps represent the summed 18FDG activity normalized to activity in the CSF (cisterna magna/catheter) which are overlaid on the corresponding 3D volume rendered image for anatomical landmarking. At the earliest time, 18FDG is presented in the CM only (A), and at later timepoints 18FDG is observed along the ventral surface of the brain/CSF, inside the brain proper as well as in the nasal conchae (B, C). Faint uptake in the heart can also be appreciated. D-F: Dynamic summed 18FDG PET images are shown from a rat receiving i.v. 18FDG. The 3D volume rendered color coded maps represent 18FDG activity summed over a given time interval to show the uptake pattern over time. At early time after i.v. administration 18FDG uptake is evident in the brain, heart, spine and lymph nodes. G: Time activity curves (TAC) from the whole brain and nasal conchae from four rats receiving 18FDG. The data are presented as mean ± SEM. The TAC from brain peaks at ~25 min after the 18FDG administration into the CSF, whereas the TAC from the nasal conchae steadily increase from 40–100min. The insert shows 18FDG activity at 90min overlaid on the CT image. H: Corresponding TACs from brain and nasal conchae from 4 rats receiving i.v. 18FDG. There is an immediate increase in activity over the first 10min and plateau is reached at ~35–40min after i.v. 18FDG. The insert shows 18FDG activity at 60min in the brain and nasal conchae overlaid on the corresponding CT image.

References

    1. Abbott NJ, Pizzo ME, Preston JE, Janigro D, Thorne RG (2018), The role of brain barriers in fluid movement in the CNS: is there a ‘glymphatic’ system? Acta Neuropathol 135:387–407. - PubMed
    1. Agency FD, Dotarem - FDA.
    1. Alluri SR, Kim SW, Volkow ND, Kil KE (2020), PET Radiotracers for CNS-Adrenergic Receptors: Developments and Perspectives. Molecules 25. - PMC - PubMed
    1. Antila S, Karaman S, Nurmi H, Airavaara M, Voutilainen MH, Mathivet T, Chilov D, Li Z, et al. (2017), Development and plasticity of meningeal lymphatic vessels. J Exp Med 214:3645–3667. - PMC - PubMed
    1. Ashok AH, Mizuno Y, Volkow ND, Howes OD (2017), Association of Stimulant Use With Dopaminergic Alterations in Users of Cocaine, Amphetamine, or Methamphetamine: A Systematic Review and Meta-analysis. JAMA Psychiatry 74:511–519. - PMC - PubMed