. 2021 Mar 3;29(3):1028-1046.
doi: 10.1016/j.ymthe.2020.11.025. Epub 2020 Nov 26.

Evaluating the Genomic Parameters Governing rAAV-Mediated Homologous Recombination

Affiliations

Evaluating the Genomic Parameters Governing rAAV-Mediated Homologous Recombination

Laura P Spector et al. Mol Ther. .

Abstract

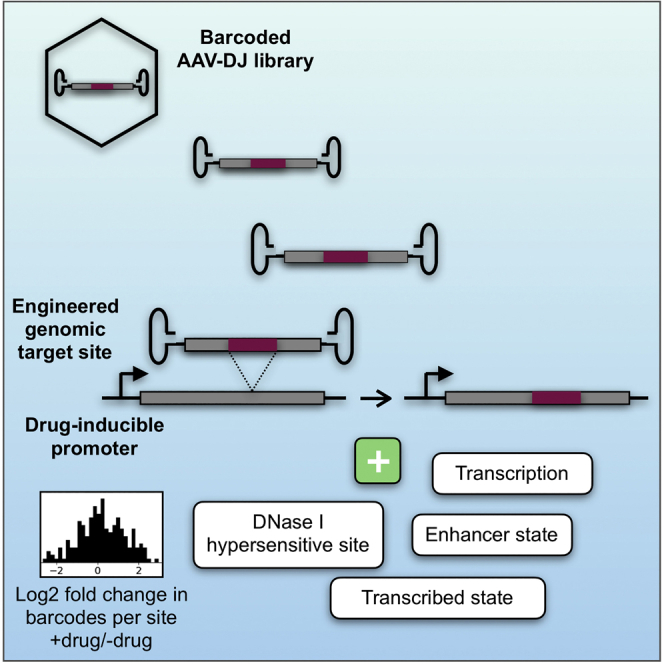
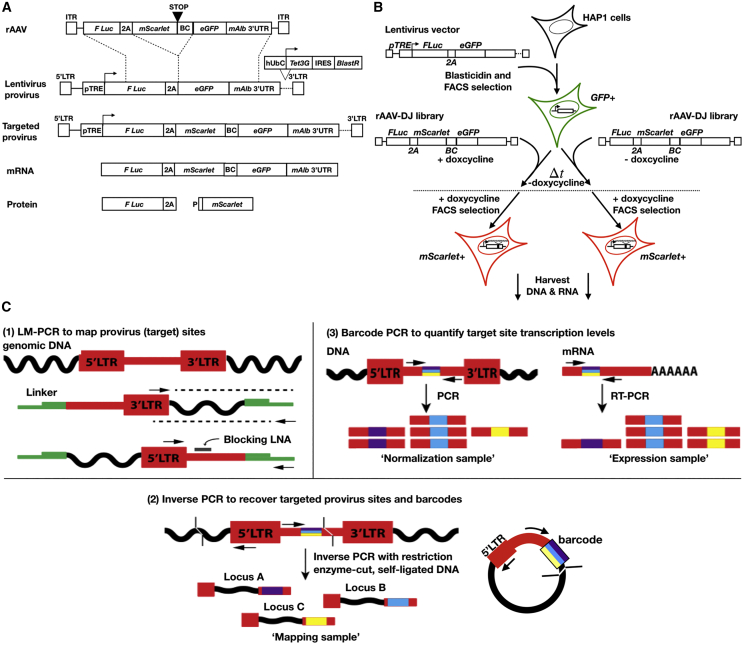
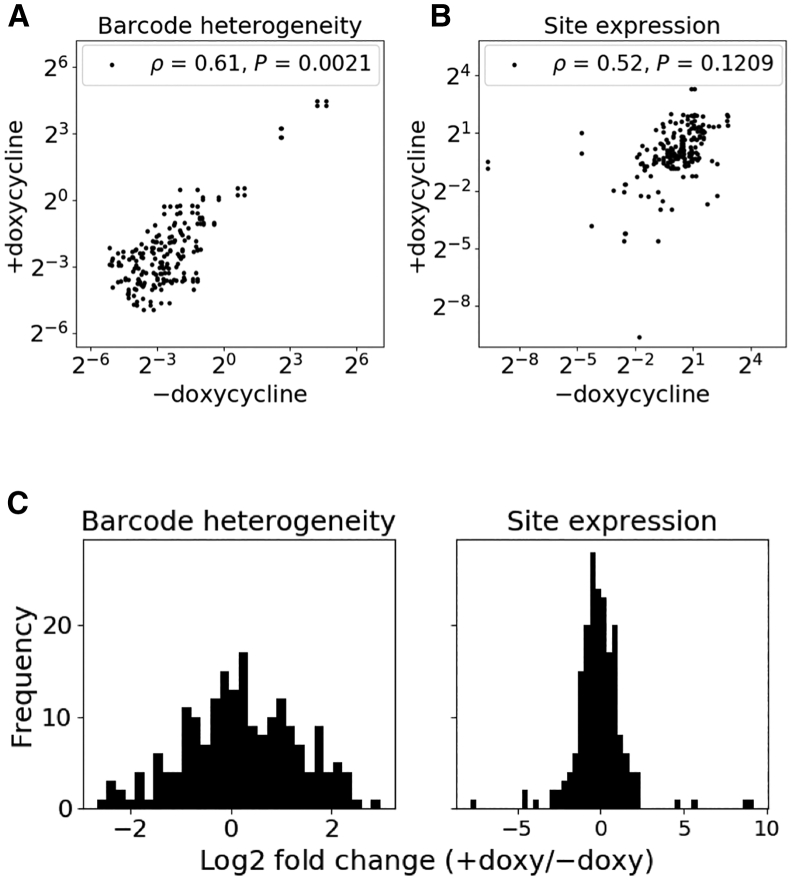
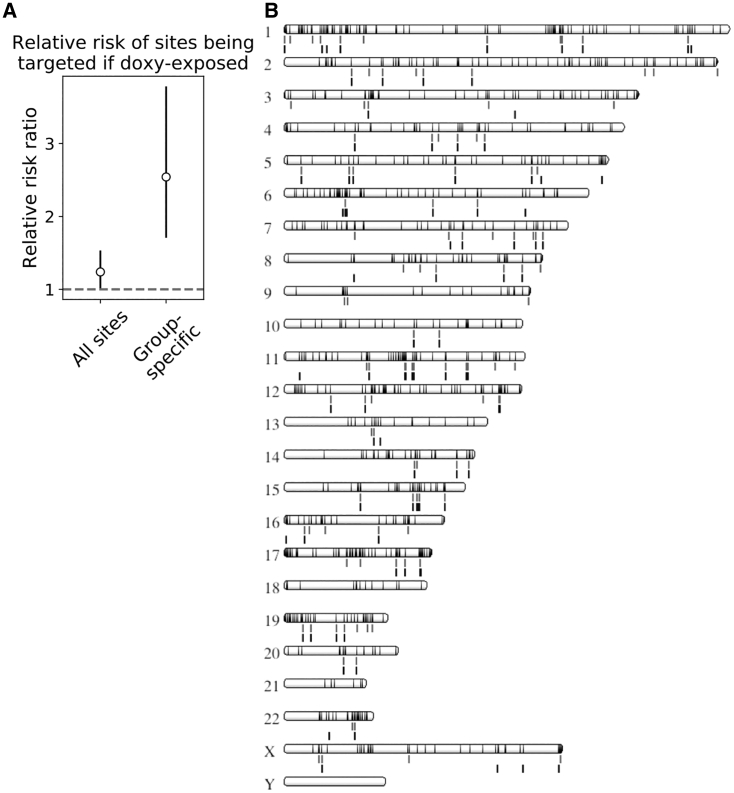
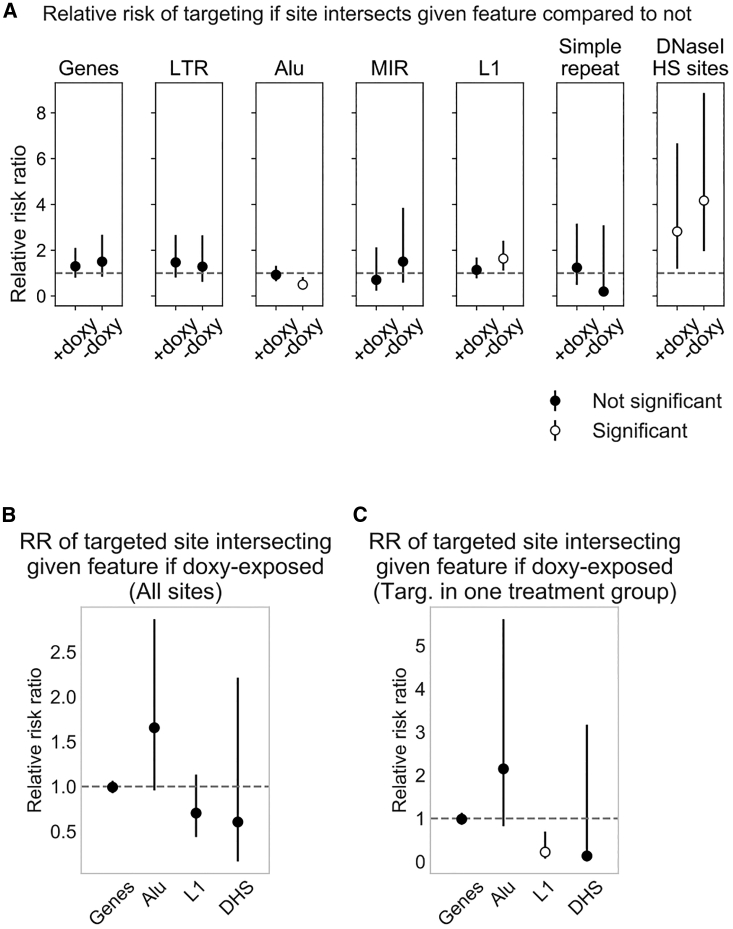
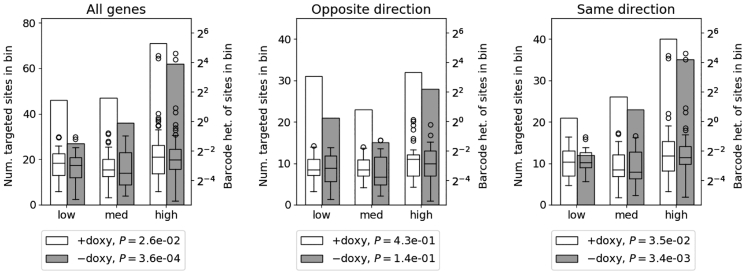
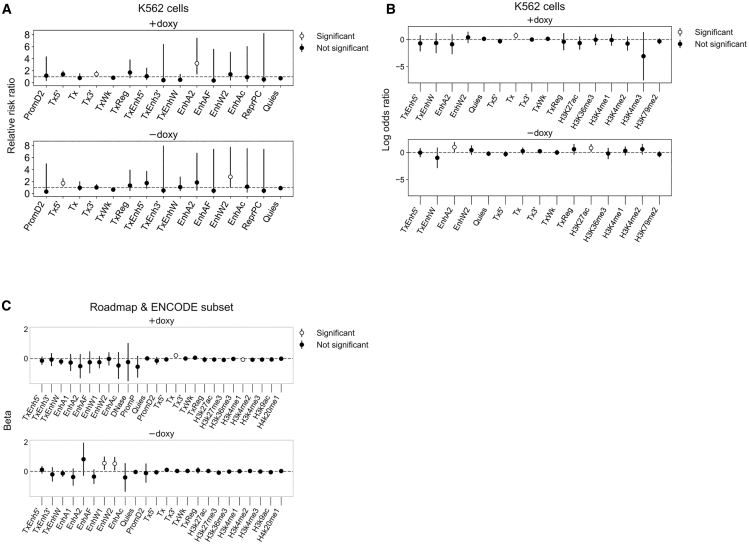
Recombinant adeno-associated virus (rAAV) vectors have the unique ability to promote targeted integration of transgenes via homologous recombination at specified genomic sites, reaching frequencies of 0.1%-1%. We studied genomic parameters that influence targeting efficiencies on a large scale. To do this, we generated more than 1,000 engineered, doxycycline-inducible target sites in the human HAP1 cell line and infected this polyclonal population with a library of AAV-DJ targeting vectors, with each carrying a unique barcode. The heterogeneity of barcode integration at each target site provided an assessment of targeting efficiency at that locus. We compared targeting efficiency with and without target site transcription for identical chromosomal positions. Targeting efficiency was enhanced by target site transcription, while chromatin accessibility was associated with an increased likelihood of targeting. ChromHMM chromatin states characterizing transcription and enhancers in wild-type K562 cells were also associated with increased AAV-HR efficiency with and without target site transcription, respectively. Furthermore, the amenability of a site to targeting was influenced by the endogenous transcriptional level of intersecting genes. These results define important parameters that may not only assist in designing optimal targeting vectors for genome editing, but also provide new insights into the mechanism of AAV-mediated homologous recombination.

Keywords: chromatin; genomic states affecting HR; homologous recombination; rAAV.


Conflict of interest statement

M.A.K. is a co-founder, Board of Directors (BOD) member, advisor, and holds equity in LogicBio Therapeutics. While there is no intellectual property (IP) directly related to this study, LogicBio has licensed IP from Stanford University related to nuclease free AAV-mediated homologous recombination. S.B.M. is on the Scientific Advisory Board (SAB) of MyOme. The remaining authors declare no competing interests.

Figures

None
Graphical abstract
Figure 1
Figure 1
Vector Design and Experimental Scheme (A) The rAAV-DJ vector (rAAV) encodes an mScarlet coding sequence followed by a stop codon, barcode of 12 degenerate nucleotides (BC), and an additional 38 bp to introduce a frameshift after HR. These are flanked by 1.6-kb homology arms comprising a (5′) partial firefly luciferase (F Luc) coding sequence followed by 2A-peptide sequence and (3′) EGFP coding sequence and partial mouse albumin 3′ UTR (mAlb 3′ UTR). The target site (provirus), generated by integration of a lentivirus vector, encodes firefly luciferase and EGFP coding sequences linked by a 2A-peptide and followed by the mouse albumin 3′ UTR, under the control of a TRE3Gs tetracycline-responsive promoter (pTRE). It also encodes a Tet-On 3G transactivator (Tet3G)-IRES-blasticidin resistance gene (BlastR) cassette under control of the human ubiquitin C (hUbC) promoter. Stop codons are excluded from coding sequences that immediately precede 2A-peptides, and start codons are excluded from coding sequences that immediately follow 2A-peptides. After integration by HR, firefly luciferase and mScarlet+barcode are fused at the DNA and RNA levels, but two separate proteins are produced as the result of ribosomal skipping. The stop codon and frameshift introduced by HR abolish EGFP expression. (B) A polyclonal population of >1,000 clones was generated by infecting wild-type HAP1 cells with the lentiviral vector at an MOI of <0.1. Clones were selected by blasticidin resistance and FACS. The polyclonal population was plated in two biological replicates for each experimental arm (+doxycycline and −doxycycline), then transduced with the barcoded rAAV-DJ library under the indicated doxycycline exposure. After several weeks, both experimental arms were exposed to doxycycline for sorting targeted cells (mScarlet+/EGFP). Similarly, DNA and RNA were harvested after doxycycline exposure. (C) (1) Lentiviral provirus integration sites were sequenced from the 3′ LTR by LM-PCR, including a locked nucleic acid (blocking LNA) to inhibit PCR amplification into the provirus sequence. (2) For mapping barcodes, DNA was digested with the complementary overhang restriction enzymes AseI (cleaving just downstream of the barcode) and NdeI and then self-circularized. Fragments from circularized DNA were PCR amplified across the barcode and ligated adjacent genomic DNA, as well as into genomic DNA from the 5′ LTR. Genomic loci that overlapped in LM-PCR and iPCR were considered “targeted sites.” (3) Number of unique barcodes mapped to each genomic locus is referred to as “barcode heterogeneity.” Barcodes were amplified from cDNA, and counts were normalized to corresponding barcode counts from genomic DNA to measure targeted site expression.
Figure 2
Figure 2
Effect of Target Site Transcriptional Induction on AAV-HR Efficiency Following FACS enrichment of cells with AAV-HR events, the number of unique barcodes mapped to each site (barcode heterogeneity) and average expression were quantified at targeted provirus sites, using the set of barcodes recovered in both iPCR and DNA barcode sequencing samples (see Materials and Methods). Here, measurements are compared only for those provirus sites targeted in both doxycycline- and non-doxycycline-treated samples. (A and B) Barcode heterogeneity (A) and expression (B) at targeted sites, measured at all pairwise targeted sites between treatment groups (concatenated biological replicates). Spearman’s rank correlation coefficient ρ is shown. p values were determined by a one-sided Wilcoxon signed-rank test (H0 = +doxycycline is not greater than −doxycycline) for barcode heterogeneity and a two-sided Wilcoxon signed-rank test for expression (n = 194). (C) Frequency histogram of log2 fold change in barcode heterogeneity and site expression for each pair of sites plotted in (A) and (B), respectively. For expression, RNA was extracted after administering doxycycline to both groups regardless of doxycycline exposure at the time of rAAV transduction.
Figure 3
Figure 3
Effect of Target Site Transcriptional Induction on Number of Unique Sites Targeted (A) Relative risk ratio of a site having at least one integrated barcode in a doxycycline-treated sample compared to a non-doxycycline-treated sample. Sites from biological duplicates were assembled into a 2 × 2 contingency table for which the exposure is +doxycycline/−doxycycline and the outcome is targeted/not targeted. 95% confidence intervals are shown. We consider the relative risk ratio statistically significant when the 95% confidence interval does not overlap 1, shown by white circles. All sites, all targeted sites (considered out of n = 3,901 provirus sites across all samples); Group-specific, sites targeted in one treatment group and not the other. For group-specific sites, the set of provirus sites was first filtered to sites present in the polyclonal population transduced in both treatment groups but targeted exclusively in one treatment group or the other (n = 277). There were no zero values in the tables. (B) Ideogram of all provirus sites considered for targeting (1,246 sites; black bars, overlay), showing targeted sites below each chromosome in +doxycycline samples (gray bars, first row) and targeted sites in −doxycycline samples (black bars, second row), generated using the NCBI Genome Decoration Page (https://www.ncbi.nlm.nih.gov/genome/tools/gdp/).
Figure 4
Figure 4
Association of Targeted Sites with Chromosomal Features (A) Relative risk ratio of a site having at least one integrated barcode, given that the site intersects the feature indicated above the plot. Sites were assembled into a 2 × 2 contingency table for which the exposure is intersection/no intersection and the outcome is targeted/not targeted. There were no 0 values in the tables. +doxycycline, n = 2,013; −doxycycline, n = 1,888. 95% confidence intervals are shown. We consider the relative risk ratio statistically significant when the 95% confidence interval does not overlap 1, shown by white circles. DNase I hypersensitive sites were obtained by intersecting provirus sites with DNase I-seq called peaks (see Materials and Methods). Low-complexity repeats were excluded due to large confidence intervals. (B and C) Relative risk ratio of a targeted site intersecting the feature indicated, given that it was targeted in a doxycycline-treated sample, for (B) all sites (+doxycycline, n = 181; −doxycycline, n = 137) or (C) sites targeted in only one treatment group (+doxycycline, n = 64; −doxycycline, n = 25). For (C), provirus sites were initially filtered to sites present in both treatment groups and targeted exclusively in one treatment group, as in Figure 3 (Group-specific). For (B) and (C), only targeted sites were assembled into a 2 × 2 contingency table for which the exposure is +doxycycline/−doxycycline and the outcome is intersection/no intersection. 0.5 was added to all cells for tables with a 0 value, as was the case for DNase I hypersensitive sites in (C). DHS, DNase I hypersensitive site.
Figure 5
Figure 5
Association of Targeted Sites with GENCODE Genes by Expression Level Genes intersecting provirus sites were split into equal-sized bins after ranking mean FPKM values for these genes from lowest to highest. Left y axis (bar chart) indicates the number of targeted sites in each bin. Right y axis (boxplot) indicates the barcode heterogeneity for targeted sites in each bin. Boxplot whiskers extend the first and third quartiles by 1.5 × interquartile range (IQR) with outlying data points shown as circles. All genes intersecting provirus sites (targeted gene counts +doxycycline 46, 47, 71 and −doxycycline 27, 36, 62), genes transcribed in the opposite direction relative to the doxycycline-inducible promoter (targeted gene counts +doxycycline 31, 23, 32 and −doxycycline 21, 15, 28), and genes transcribed in the same direction relative to the doxycycline-inducible promoter (targeted gene counts +doxycycline 21, 26, 40 and −doxycycline 12, 23, 35) are shown. p values shown for binned targeted sites were determined by a one-way chi-square test against the uniform distribution. A Cochran-Armitage trend test was used to compare between treatment groups but no significant differences were detected. A chi-square test of independence was used to compare gene counts at genes transcribed in the opposite versus same direction within each treatment group but no significant differences were detected. Median FPKM and interquartile range of transcripts in each bin for all transcripts in the source study and the genes intersecting provirus sites are provided in Table S3.
Figure 6
Figure 6
Chromatin States and Epigenetic Measures Associated with AAV-HR (A) Relative risk ratio of a site having at least one integrated barcode, given that it overlaps the indicated ChromHMM chromatin state segment, using chromatin state predictions in K562 cells. Sites were assembled into a 2 × 2 contingency table for which the exposure is intersection/no intersection and the outcome is targeted/not targeted. 95% confidence intervals are shown. We consider the relative risk ratio statistically significant when the 95% confidence interval does not overlap 1, shown by white circles. States with large confidence intervals were excluded but are given in Tables S4 and S5. Where incidence for either group is 0, 0.5 was added to all cells prior to computing relative risk ratio. (B) Predicting the presence of an overlapping ChromHMM or ENCODE feature peak in K562 cells from barcode heterogeneity at targeted sites using independent logistic regression models, filtering out features with high standard deviation. Exp(log odds ratio) represents the change in odds of overlapping a given feature for every unit increase in barcode heterogeneity. (C) Predicting barcode heterogeneity at targeted sites from the proportion of cell types assigned to a given ChromHMM state or ENCODE feature peak in the region over that site using independent linear regression models, filtering out features with high standard deviation. The cell types are a subset of seven cell types shared by both the Roadmap and ENCODE annotations (GM12878, H1-hESC, HSMM, HUVEC, K562, NHEK, and NHLF). Beta represents the mean change in barcode heterogeneity given a one-unit change in the proportion of assigned cell types. For (B) and (C), data were centered and scaled to a mean of 0 and standard deviation of 1 prior to model fitting. 95% confidence intervals are shown. A feature is considered predictive of targeting when the 95% confidence interval does not overlap 0, shown by white circles. Estimates and standard errors for all states are provided in Tables S6 and S7. For regression analyses, sites with barcode heterogeneity greater than the third quartile+3 × IQR of their respective treatment group were excluded.

References

    1. Barzel A., Paulk N.K., Shi Y., Huang Y., Chu K., Zhang F., Valdmanis P.N., Spector L.P., Porteus M.H., Gaensler K.M., Kay M.A. Promoterless gene targeting without nucleases ameliorates haemophilia B in mice. Nature. 2015;517:360–364. - PMC - PubMed
    1. Xiao A., Wang Z., Hu Y., Wu Y., Luo Z., Yang Z., Zu Y., Li W., Huang P., Tong X. Chromosomal deletions and inversions mediated by TALENs and CRISPR/Cas in zebrafish. Nucleic Acids Res. 2013;41:e141. - PMC - PubMed
    1. Adikusuma F., Piltz S., Corbett M.A., Turvey M., McColl S.R., Helbig K.J., Beard M.R., Hughes J., Pomerantz R.T., Thomas P.Q. Large deletions induced by Cas9 cleavage. Nature. 2018;560:E8–E9. - PubMed
    1. Kosicki M., Tomberg K., Bradley A. Repair of double-strand breaks induced by CRISPR-Cas9 leads to large deletions and complex rearrangements. Nat. Biotechnol. 2018;36:765–771. - PMC - PubMed
    1. Nakai H., Wu X., Fuess S., Storm T.A., Munroe D., Montini E., Burgess S.M., Grompe M., Kay M.A. Large-scale molecular characterization of adeno-associated virus vector integration in mouse liver. J. Virol. 2005;79:3606–3614. - PMC - PubMed

Publication types