. 2021 Feb 1:226:117549.
doi: 10.1016/j.neuroimage.2020.117549. Epub 2020 Nov 26.

Impact of concatenating fMRI data on reliability for functional connectomics

Affiliations

Impact of concatenating fMRI data on reliability for functional connectomics

Jae Wook Cho et al. Neuroimage. .

Abstract

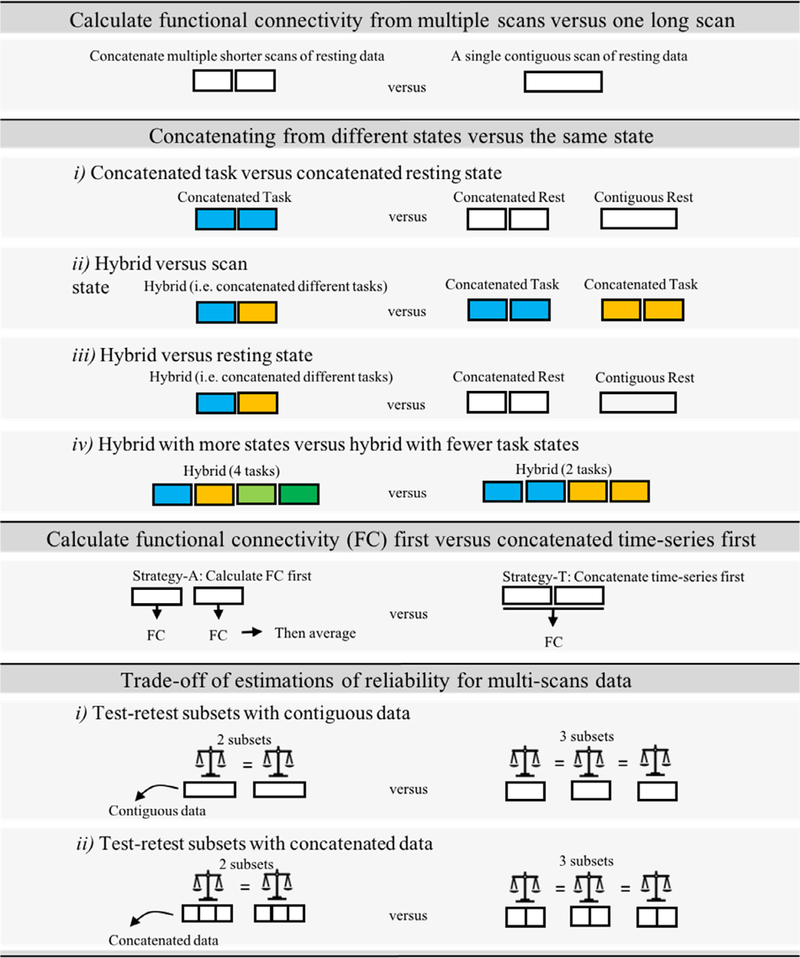
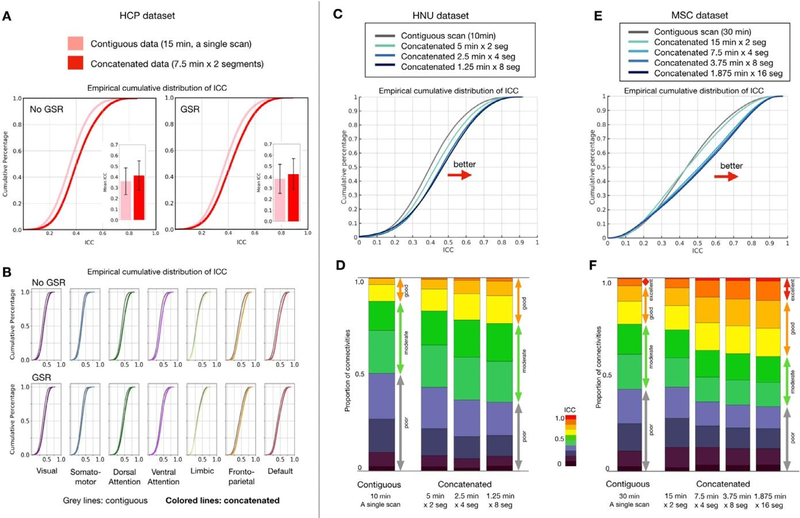
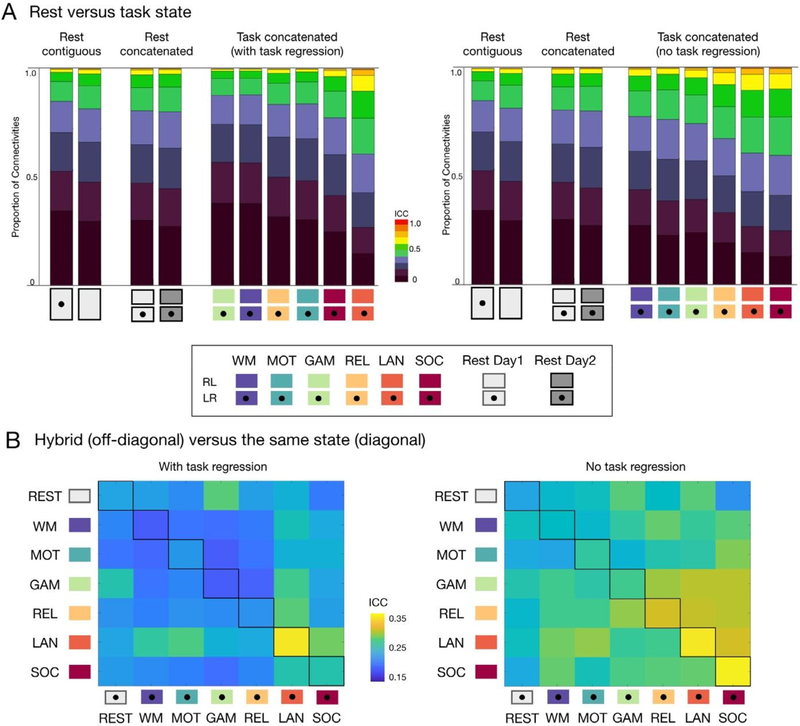
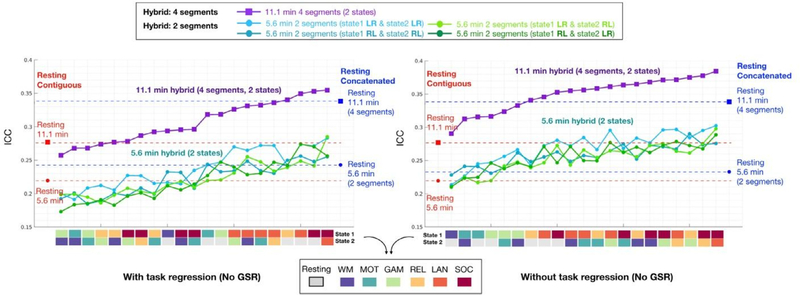
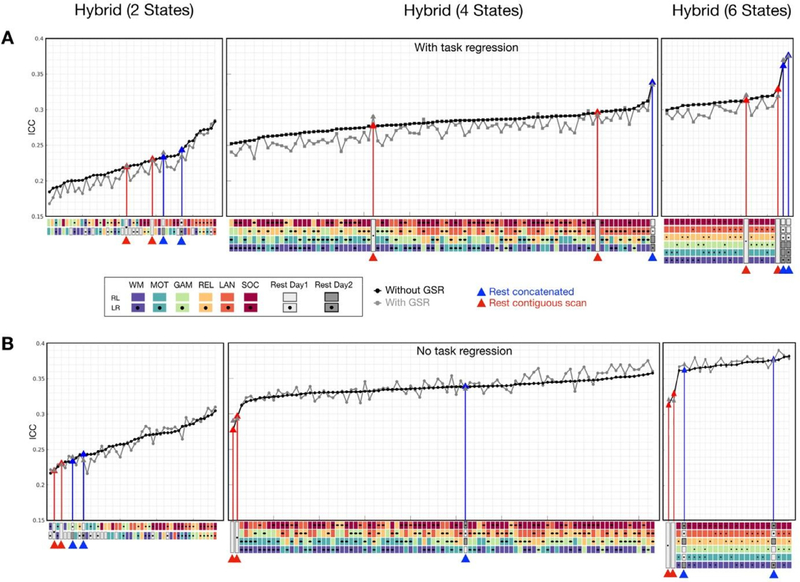
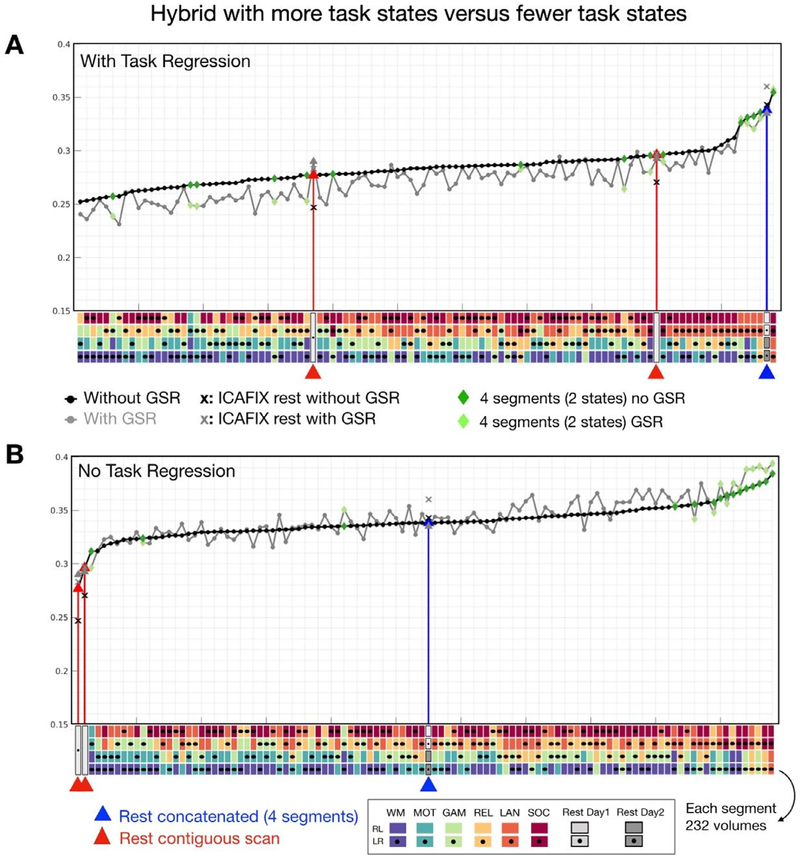
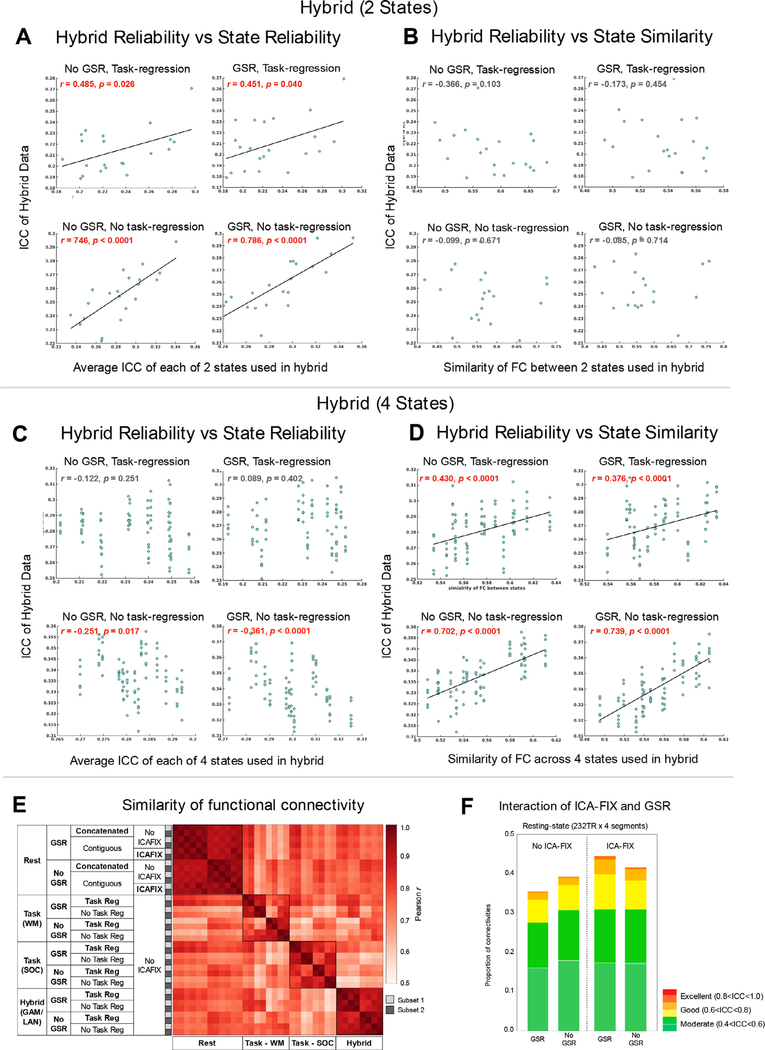
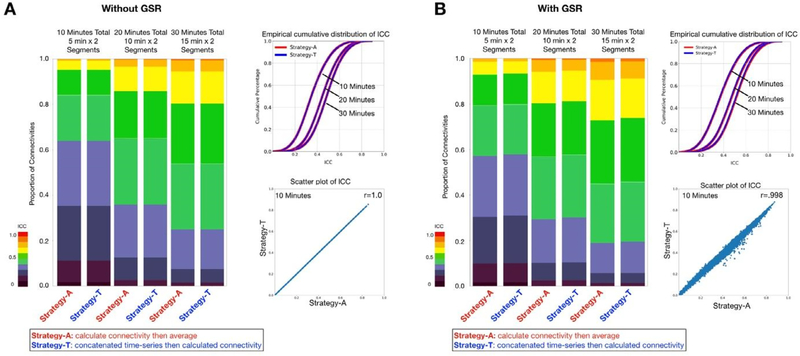
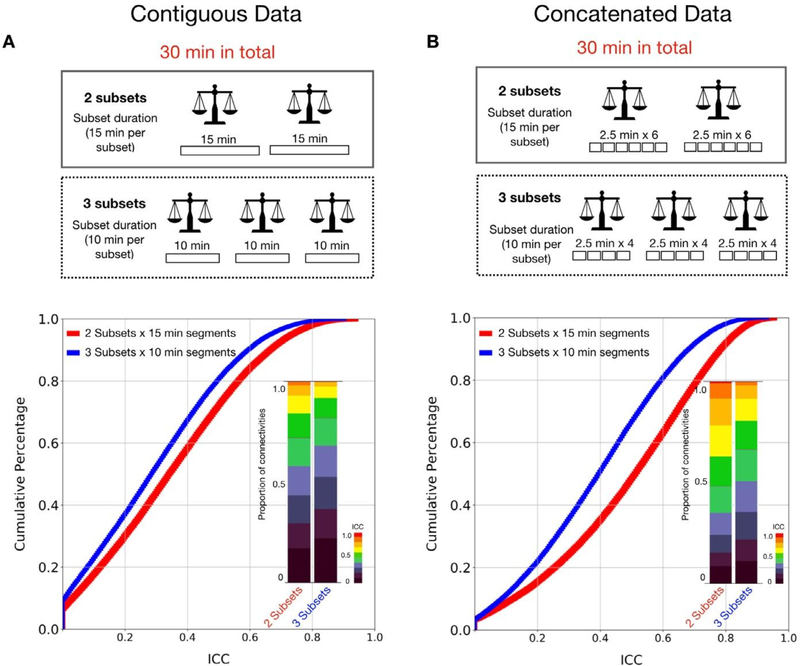
Compelling evidence suggests the need for more data per individual to reliably map the functional organization of the human connectome. As the notion that 'more data is better' emerges as a golden rule for functional connectomics, researchers find themselves grappling with the challenges of how to obtain the desired amounts of data per participant in a practical manner, particularly for retrospective data aggregation. Increasingly, the aggregation of data across all fMRI scans available for an individual is being viewed as a solution, regardless of scan condition (e.g., rest, task, movie). A number of open questions exist regarding the aggregation process and the impact of different decisions on the reliability of resultant aggregate data. We leveraged the availability of highly sampled test-retest datasets to systematically examine the impact of data aggregation strategies on the reliability of cortical functional connectomics. Specifically, we compared functional connectivity estimates derived after concatenating from: 1) multiple scans under the same state, 2) multiple scans under different states (i.e. hybrid or general functional connectivity), and 3) subsets of one long scan. We also varied connectivity processing (i.e. global signal regression, ICA-FIX, and task regression) and estimation procedures. When the total number of time points is equal, and the scan state held constant, concatenating multiple shorter scans had a clear advantage over a single long scan. However, this was not necessarily true when concatenating across different fMRI states (i.e. task conditions), where the reliability from the aggregate data varied across states. Concatenating fewer numbers of states that are more reliable tends to yield higher reliability. Our findings provide an overview of multiple dependencies of data concatenation that should be considered to optimize reliability in analysis of functional connectivity data.


Figures

Fig. 1.
Fig. 1.
Graphical summary of comparisons for different data aggregation strategies.
Fig. 2.
Fig. 2.
Edgewise functional connectivity calculated from concatenated scans is more reliable than that based on a single contiguous scan of equal length. (A) Empirical cumulative distribution and bar plots of mean intraclass correlation coefficient (ICC) with error bars (standard deviation) for test-retest reliability of functional connectivities from contiguous and concatenated resting-state fMRI scans; results for calculation based on data with and without global signal regression (GSR) are depicted. (B) Empirical cumulative distribution of ICC for each network. Distribution of ICC from contiguous data is shown in gray while colored lines represent ICC from concatenated data. See FC and ICC matrices in Fig S1B. (C) Empirical cumulative distribution of ICC and (D) stacked bar plots depicting proportion of connections with poor, moderate, good and excellent ICC for contiguous and concatenated resting-state scans, calculated using the HNU dataset and the Midnight Scan Club dataset (E, F). (For interpretation of the references to color in this figure legend, the reader is referred to the web version of this article.)
Fig. 3.
Fig. 3.
Reliability of edgewise functional connectivity measures calculated for resting-state, task and hybrid fMRI data without GSR. (A) Proportion of connections with poor, moderate, good and excellent ICC when calculated for resting state and each of six task conditions in the HCP dataset, with (left-panel) and without task regression (right-panel). (B) Mean ICC for functional connectivity measures based on hybrid data generated by concatenating two scans from two different states (off-diagonal, upper triangle: LR scans, lower triangle: RL scans) and the same state (diagonal). See results with GSR in Fig. S4.
Fig. 4.
Fig. 4.
Reliability of edgewise functional connectivity measures calculated for resting and hybrid data generated from 2 tasks using either 2 or 4 segments without GSR. The label color for task states from cold to warm represents the reliability (i.e., mean ICC) of each state from low to high (detailed distribution shown in Fig. 3A). The same length of contiguous resting data was truncated from LR scans of the Day 1 session (red dots, 5.6 min; red square: 11.1 min). The concatenated resting data was generated from 2 scans (blue dot: 5.6 min, LR and RL scans from Day 1) and 4 scans (blue square: 11.1 min, LR, RL scans from Day 1 and Day 2). See results with GSR in Fig. S5. (For interpretation of the references to color in this figure legend, the reader is referred to the web version of this article.)
Fig. 5.
Fig. 5.
Reliability of edgewise functional connectivity for resting and hybrid data as a function of the numbers of states combined in the concatenation process (2, 4 and 6 different states). The mean ICC for data preprocessed with GSR (gray) and without GSR (black) was shown in ascending order. The same length of contiguous resting data was truncated from LR and RL scans of Day 1 session (highlighted with red lines). The concatenated resting data was generated from 2, 4, and 6 segments of resting scans (highlighted with blue lines). (For interpretation of the references to color in this figure legend, the reader is referred to the web version of this article.)
Fig. 6.
Fig. 6.
Reliability of edgewise functional connectivity for hybrid data as a function of the numbers of task states (2 versus 4 tasks) combined in the concatenation process. Hybrid combinations with less task states (green: 2 tasks) exhibited higher reliability than hybrid combining from more task states (black: 4 tasks). (For interpretation of the references to color in this figure legend, the reader is referred to the web version of this article.)
Fig. 7.
Fig. 7.
The factors that contribute to reliabilities of hybrid data and the effect of preprocessing steps for different states. (A, C) The correlations between the reliability of hybrid data and the average ICC of states used in 2-states hybrid (A) and 4-states hybrid (C). (B, D) The correlations between the reliability of hybrid data and the similarity of FC across states used in 2-states hybrid (B) and 4-states hybrid (D). (E) Averaged within-individual similarity (Pearson’s r) of functional connectivity patterns for rest, task, and hybrid data (5.6 min in total) with different preprocessing options. Working memory (WM) and social (SOC) state was shown as an example of the task condition and concatenation from GAM and LAN for the hybrid condition. The group averaged functional connectivity matrices with different preprocessing options are shown in Fig S6. (F) Proportion of connections with moderate, good, and excellent ICC for concatenated resting-state data preprocessed with and without both GSR and ICA-FIX.
Fig. 8.
Fig. 8.
Calculation of edgewise functional connectivity measures for scans individually and then averaging, versus calculation after concatenation of scans. Two segments of 5 min, 10 min, and 15 min of data were generated. The strategy calculating the FC of each segment first then average all the FC as the final FC for each subset was denoted as Strategy-A, while concatenating time-series of all segments then calculating FC per subset as Strategy-T. The stacked bar and the empirical cumulative distribution of ICC showed no differences in ICC distribution between two strategies. The scatter plot shows the ICC of functional connectivity was almost the same between two strategies for 10 min data (2 segments x 5 min).
Fig. 9.
Fig. 9.
Reliability of functional connectivity estimated using less subsets yields greater reliability than using more subsets given the same total time duration. (A) Cumulative distribution and stacked bar plots of reliability estimates for 2 subsets x 15 min contiguous scans versus 3 subsets x 10 min scans. (B) Cumulative distribution and stacked bar plots of reliability estimates for 2 subsets x 15 min concatenated data versus 3 subsets x 10 min concatenated data.

References

    1. Afshinpour Babak, Hossein-Zadeh Gholam-Ali, Soltanian-Zadeh Hamid, 2008. Nonparametric trend estimation in the presence of fractal noise: application to fMRI time-series analysis. J. Neurosci. Methods 171 (2), 340–348. - PubMed
    1. Akhrif Atae, Romanos Marcel, Domschke Katharina, Schmitt-Boehrer Angelika, Neufang Susanne, 2018. Fractal analysis of BOLD time series in a network associated with waiting impulsivity. Front. Physiol. 9 (October), 1378. - PMC - PubMed
    1. Arbabshirani Mohammad R., Preda Adrian, Vaidya Jatin G., Potkin Steven G., Pearlson Godfrey, Voyvodic James, Mathalon Daniel, et al. , 2019. Autoconnectivity: a new perspective on human brain function. J. Neurosci. Methods 323 (July), 68–76. - PubMed
    1. Biobank UK 2014. “About UK biobank. ” Available at H Ttps://www.Ukbiobank.Ac.Uk/aBout-Biobank-Uk. https://biobank.ndph.ox.ac.uk/~bbdatan/Accessing_UKB_data_v2.1.pdf.
    1. Birn Rasmus M., Molloy Erin K., Patriat Rémi, Parker Taurean, Meier Timothy B., Kirk Gregory R., Nair Veena A., Elizabeth Meyerand M, Prabhakaran Vivek, 2013. The effect of scan length on the reliability of resting-state fMRI connectivity estimates. Neuroimage 83 (December), 550–558. - PMC - PubMed

Publication types