. 2021 Feb 1:226:117585.
doi: 10.1016/j.neuroimage.2020.117585. Epub 2020 Nov 26.

Is it time to switch your T1W sequence? Assessing the impact of prospective motion correction on the reliability and quality of structural imaging

Affiliations

Is it time to switch your T1W sequence? Assessing the impact of prospective motion correction on the reliability and quality of structural imaging

Lei Ai et al. Neuroimage. .

Abstract

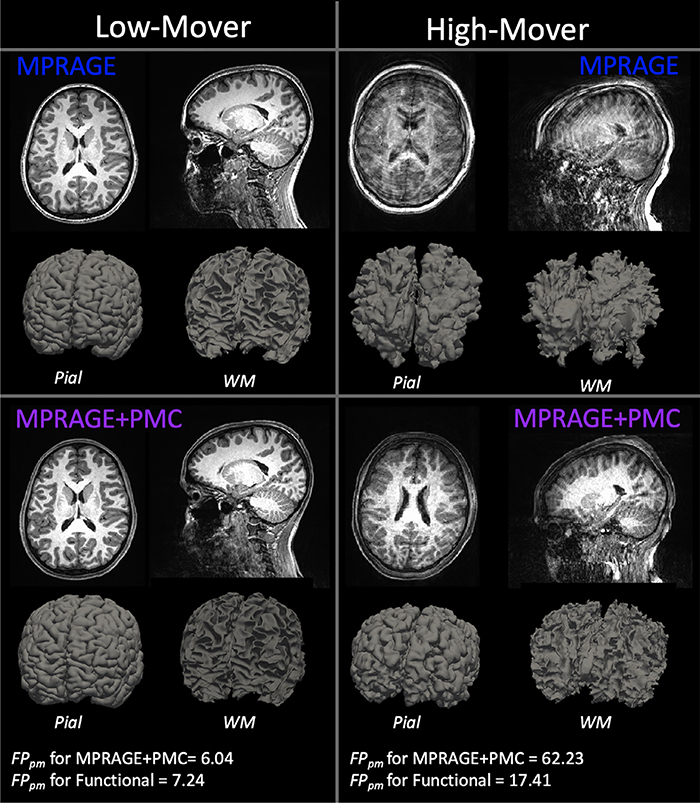
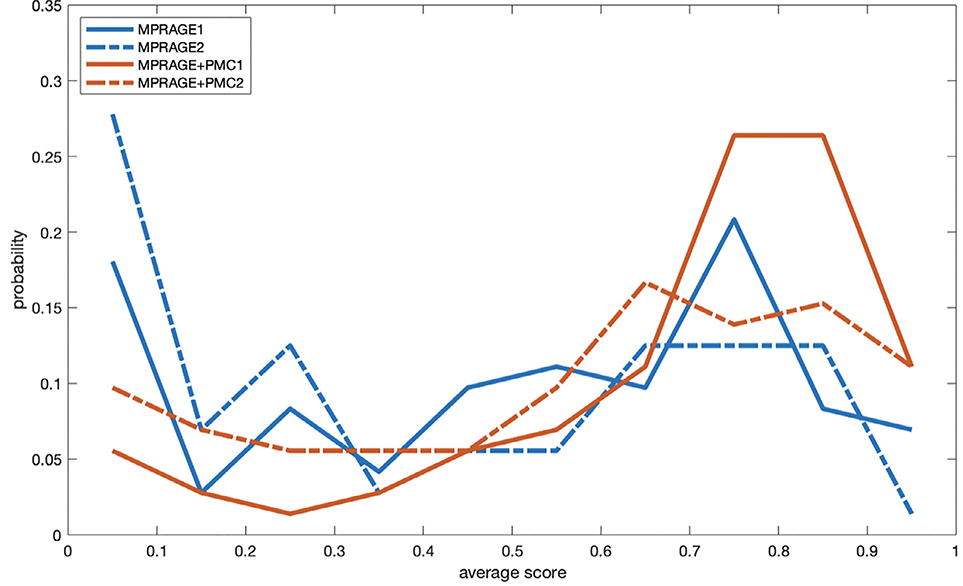
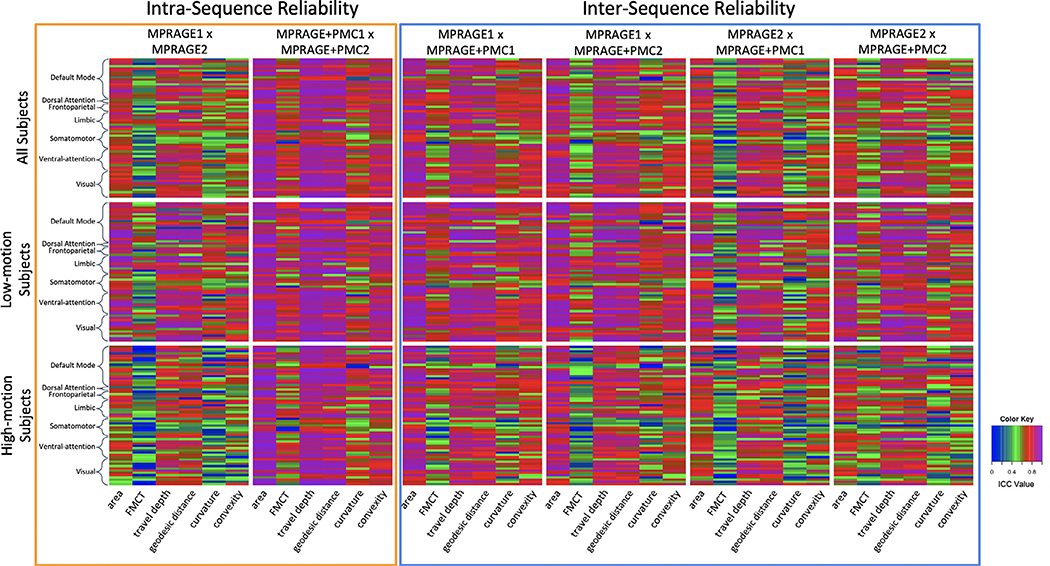
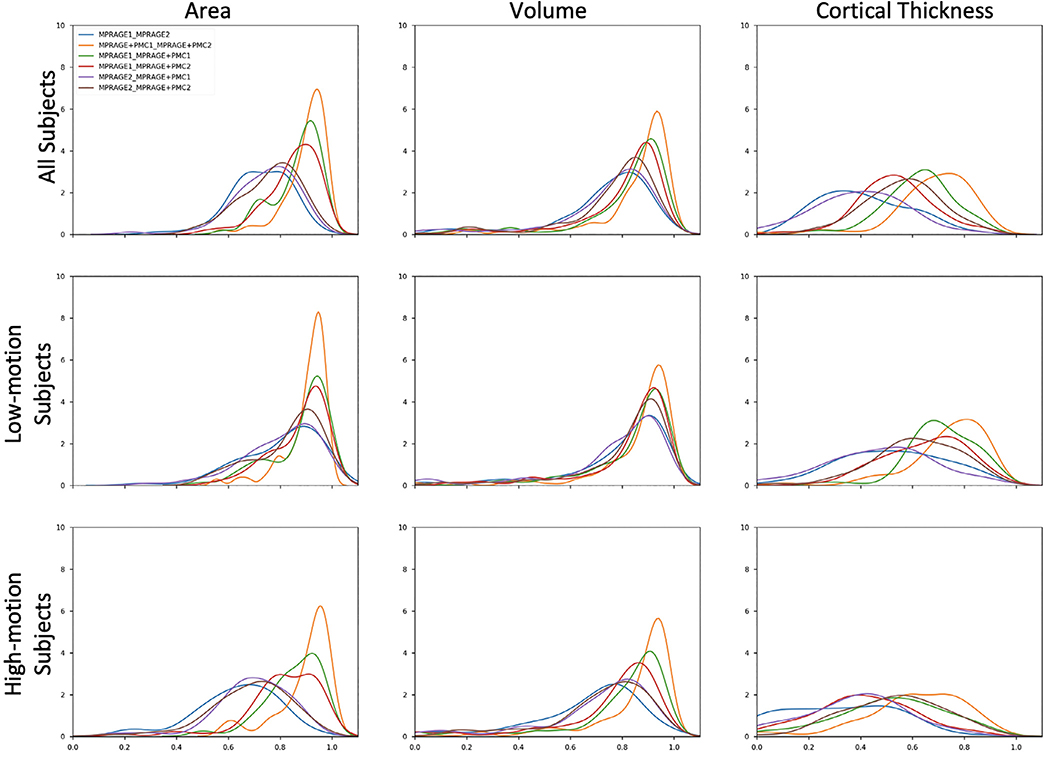
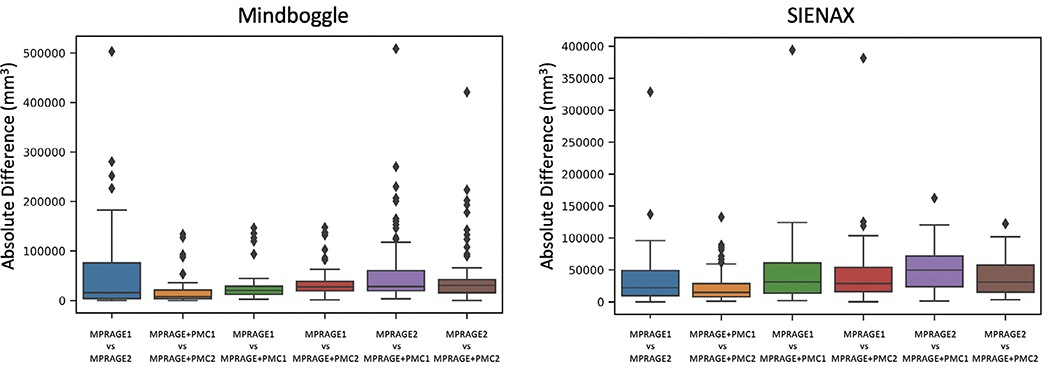
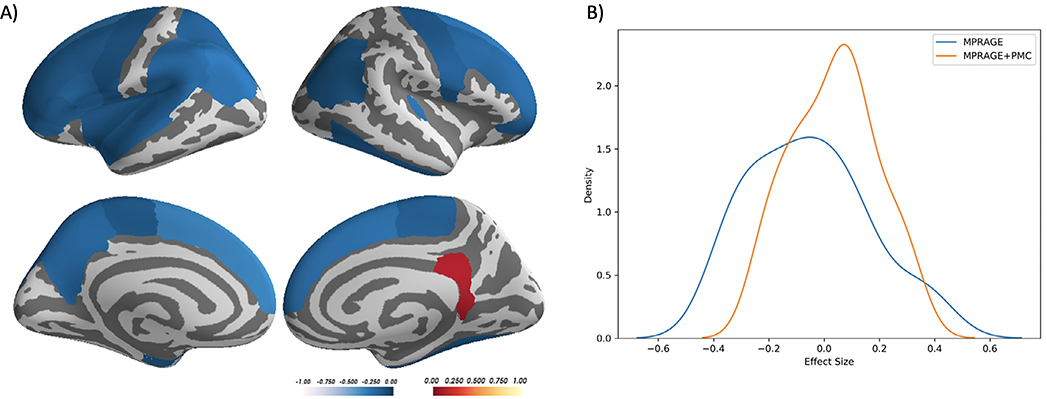
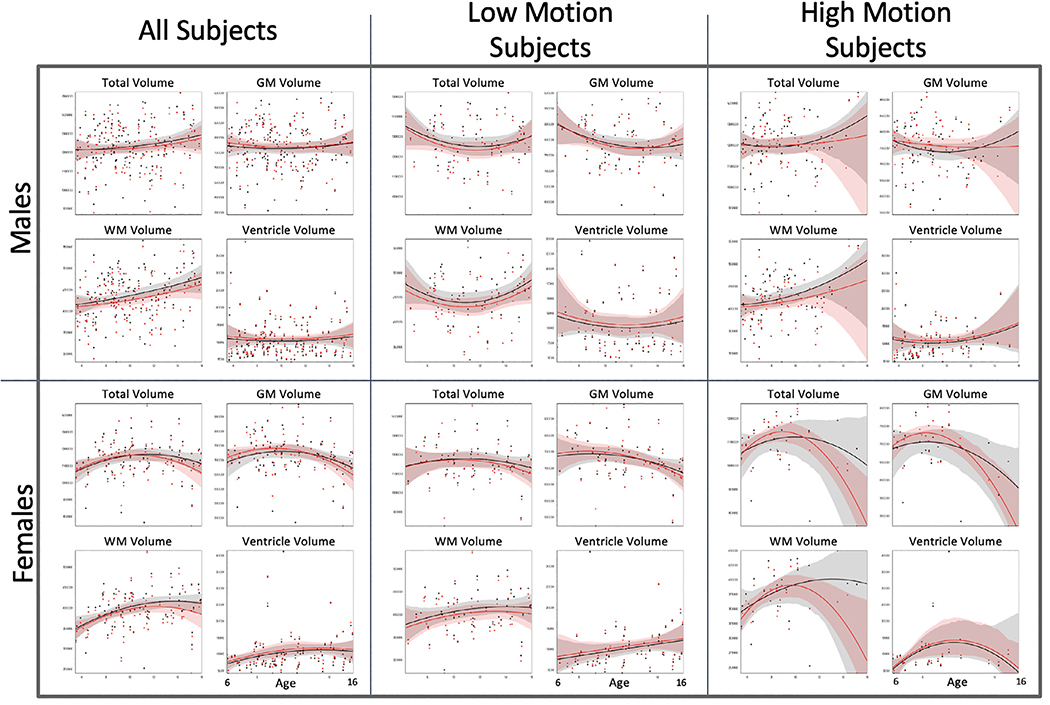
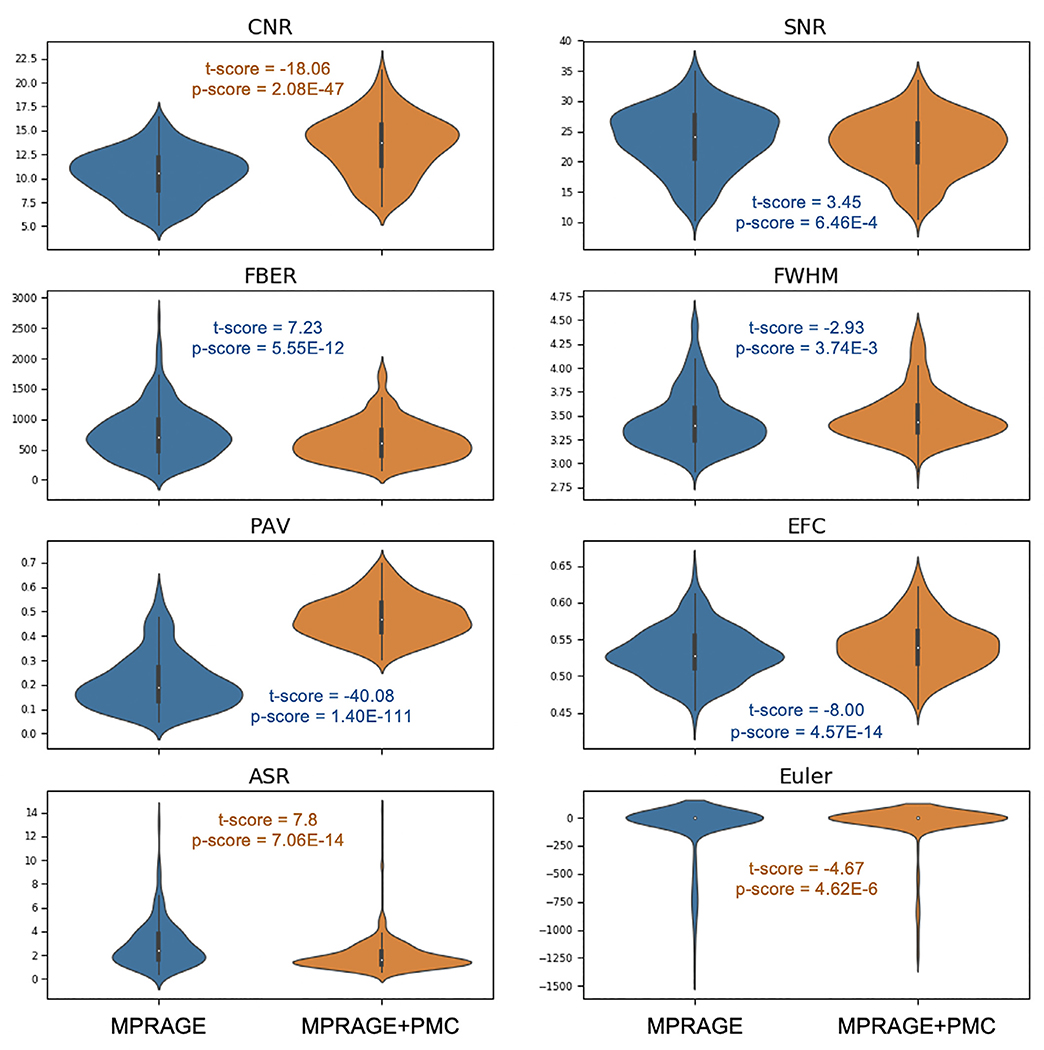
New large neuroimaging studies, such as the Adolescent Brain Cognitive Development study (ABCD) and Human Connectome Project (HCP) Development studies are adopting a new T1-weighted imaging sequence with prospective motion correction (PMC) in favor of the more traditional 3-Dimensional Magnetization-Prepared Rapid Gradient-Echo Imaging (MPRAGE) sequence. Here, we used a developmental dataset (ages 5-21, N = 348) from the Healthy Brain Network (HBN) Initiative to directly compare two widely used MRI structural sequences: one based on the Human Connectome Project (MPRAGE) and another based on the ABCD study (MPRAGE+PMC). We aimed to determine if the morphometric measurements obtained from both protocols are equivalent or if one sequence has a clear advantage over the other. The sequences were also compared through quality control measurements. Inter- and intra-sequence reliability were assessed with another set of participants (N = 71) from HBN that performed two MPRAGE and two MPRAGE+PMC sequences within the same imaging session, with one MPRAGE (MPRAGE1) and MPRAGE+PMC (MPRAGE+PMC1) pair at the beginning of the session and another pair (MPRAGE2 and MPRAGE+PMC2) at the end of the session. Intraclass correlation coefficients (ICC) scores for morphometric measurements such as volume and cortical thickness showed that intra-sequence reliability is the highest with the two MPRAGE+PMC sequences and lowest with the two MPRAGE sequences. Regarding inter-sequence reliability, ICC scores were higher for the MPRAGE1 - MPRAGE+PMC1 pair at the beginning of the session than the MPRAGE1 - MPRAGE2 pair, possibly due to the higher motion artifacts in the MPRAGE2 run. Results also indicated that the MPRAGE+PMC sequence is robust, but not impervious, to high head motion. For quality control metrics, the traditional MPRAGE yielded better results than MPRAGE+PMC in 5 of the 8 measurements. In conclusion, morphometric measurements evaluated here showed high inter-sequence reliability between the MPRAGE and MPRAGE+PMC sequences, especially in images with low head motion. We suggest that studies targeting hyperkinetic populations use the MPRAGE+PMC sequence, given its robustness to head motion and higher reliability scores. However, neuroimaging researchers studying non-hyperkinetic participants can choose either MPRAGE or MPRAGE+PMC sequences, but should carefully consider the apparent tradeoff between relatively increased reliability, but reduced quality control metrics when using the MPRAGE+PMC sequence.


Conflict of interest statement

Declaration of Competing Interest All authors declare that they do not have any conflicts of interest.

Figures

Fig. 1.
Fig. 1.
T1 structural images for the two sequences, MPRAGE and MPRAGE+PMC. The top row shows the MPRAGE sequence, while the bottom row shows the images that were generated with the MPRAGE+PMC sequence. Columns represent two different participants, one with minimal head motion (left, Low-Mover) and another with a large quantity of motion (right, High-Mover). Pial and white matter (WM) surface reconstruction from Freesurfer are also shown.
Fig. 2.
Fig. 2.
Density plots of the average Braindr score of each scan type for the test-retest group.
Fig. 3.
Fig. 3.
Test-retest reliabilityICC results for Mindboggle measurements within each of the 62 Desikan-Killiany Atlas cortical regions. Regions have been sorted by the Yeo 7 Network Atlas (Yeo et al. 2011). Measurements tested were (1) area, (2) Freesurfer median cortical thickness (FMCT), (3) travel depth, (4) geodesic distance, (5) curvature, and (6) convexity.
Fig. 4.
Fig. 4.
Density plots of ICC for the test-retest group that performed two MPRAGE scans and two MPRAGE+PMC scans within the same session. ICC is calculated for Area, Volume, and Cortical Thickness.
Fig. 5.
Fig. 5.
The absolute difference in gray matter volume within the test-retest group. Gray matter was measured using MindBoggle and SIENAX.
Fig. 6.
Fig. 6.
A) Desikan Atlas regions that showed a significant partial correlation (p<0.05), corrected by age and sex, between the difference in cortical thickness measurements (MPRAGE-MPRAGE+PMC) and mean FD across the functional scans. B) The distribution of the effect size (correlation of cortical thickness and motion estimates) across cortical regions for each sequence.
Fig. 7.
Fig. 7.
Black dots and lines (with 95% confidence intervals) are developmental measures for the MPRAGE sequence, while the red dots and lines are for the MPRAGE+PMC sequence. GM: Gray Matter; WM: White Matter.
Fig. 8.
Fig. 8.
Quality control metrics for the MPRAGE and MPRAGE+PMC images across 287 participants. Metrics include; Contrast to Noise Ratio (CNR), Signal to Noise Ratio (SNR), (FBER), Smoothness of Voxels (FWHM), Percent Artifact Voxels (PAV), Entropy Focus Criterion (EFC), Anterior-to-Superior Ratio (ASR), and Freesurfer’s Euler number. Results of the paired t-tests comparing each of the quality control metrics are also shown. The t-scores and p-values are color-coded to indicate which image (MPRAGE or MPRAGE+PMC) performed better at each paired comparison, blue for MPRAGE and orange for MPRAGE+PMC.
Fig. 9.
Fig. 9.
Correlation of the FDpm of all the runs. The main diagonal shows the distribution of FDpm each run (MPRAGE+PMC1 to movieTP) and the average FDpm of the functional runs (“Mean”). The bottom left of the diagonal shows the scatter plot of the motion parameters across runs, while the top right of the diagonal. The values on the left column show the average FDpm for each run.

References

    1. Alexander-Bloch A, Clasen L, Stockman M, Ronan L, Lalonde F, Giedd J, Raznahan A, 2016. Subtle in-scanner motion biases automated measurement of brain anatomy from in vivo MRI. Hum. Brain Mapp. 37 (7), 2385–2397. - PMC - PubMed
    1. Alexander-Bloch AF, Shou H, Liu S, Satterthwaite TD, Glahn DC, Shinohara RT, Vandekar SN, Raznahan A, 2018. On testing for spatial correspondence between maps of human brain structure and function. Neuroimage 178 (September), 540–551. - PMC - PubMed
    1. Alexander LM, Escalera J, Ai L, Andreotti C, Febre K, Mangone A, Vega-Potler N, et al., 2017. An open resource for transdiagnostic research in pediatric mental health and learning disorders. Sci. Data 4 (December), 170181. - PMC - PubMed
    1. Andersen M, Björkman-Burtscher IM, Marsman A, Petersen ET, Boer VO, 2019. Improvement in diagnostic quality of structural and angiographic MRI of the brain using motion correction with interleaved, volumetric navigators. PLoS ONE 14 (5), e0217145. - PMC - PubMed
    1. Atkinson D, Hill DL, Stoyle PN, Summers PE, Keevil SF, 1997. Automatic correction of motion artifacts in magnetic resonance images using an entropy focus criterion. IEEE Trans. Med. Imaging 16 (6), 903–910. - PubMed

Publication types