Case Reports
. 2020 Dec 23;183(7):1901-1912.e9.
doi: 10.1016/j.cell.2020.10.049. Epub 2020 Nov 4.

Case Study: Prolonged Infectious SARS-CoV-2 Shedding from an Asymptomatic Immunocompromised Individual with Cancer

Affiliations
Case Reports

Case Study: Prolonged Infectious SARS-CoV-2 Shedding from an Asymptomatic Immunocompromised Individual with Cancer

Victoria A Avanzato et al. Cell. .

Abstract

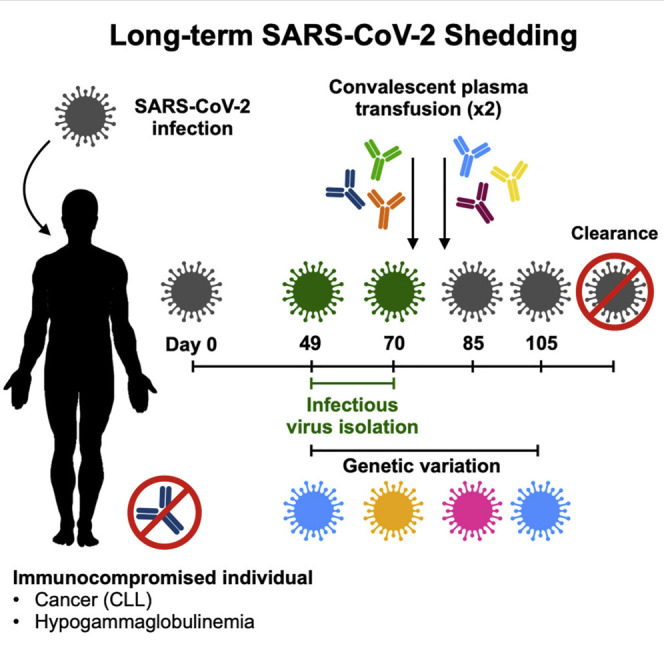
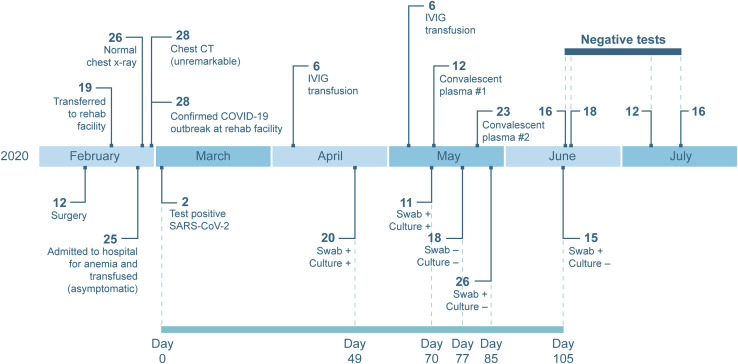
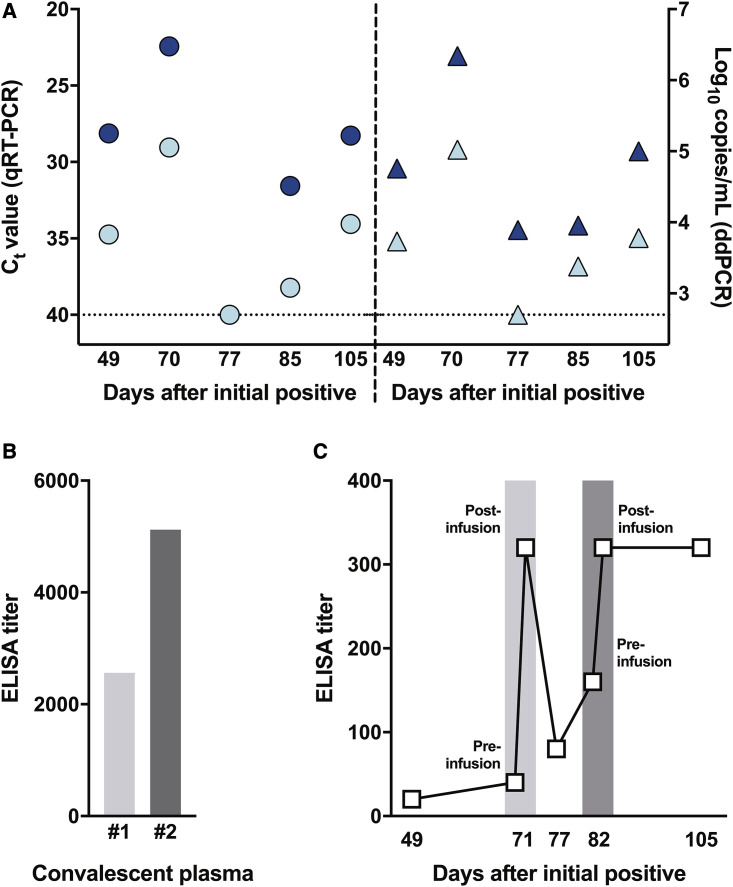
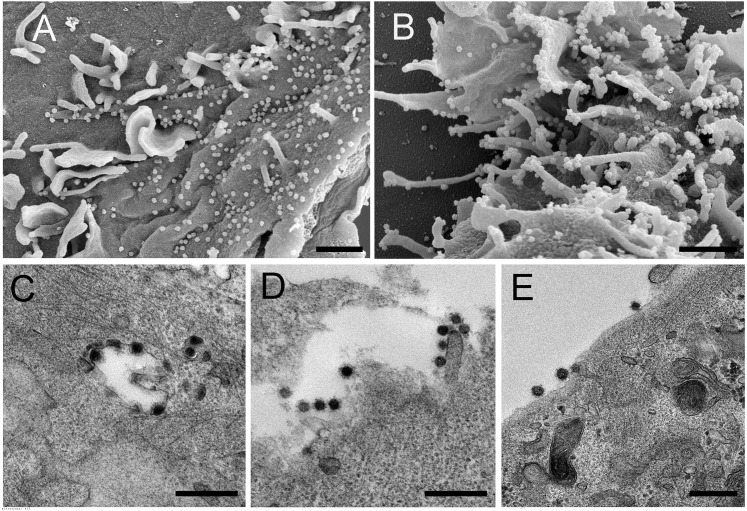
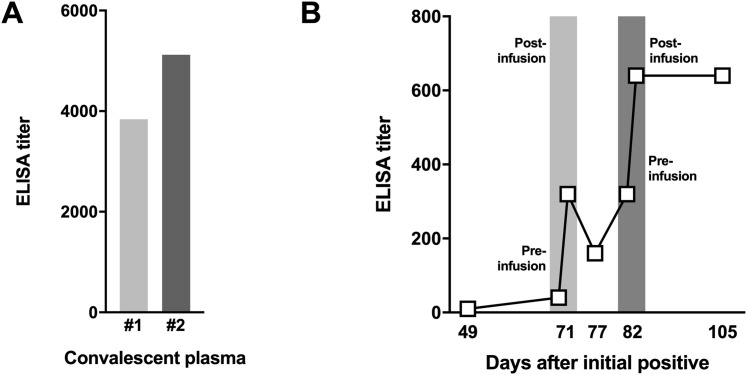
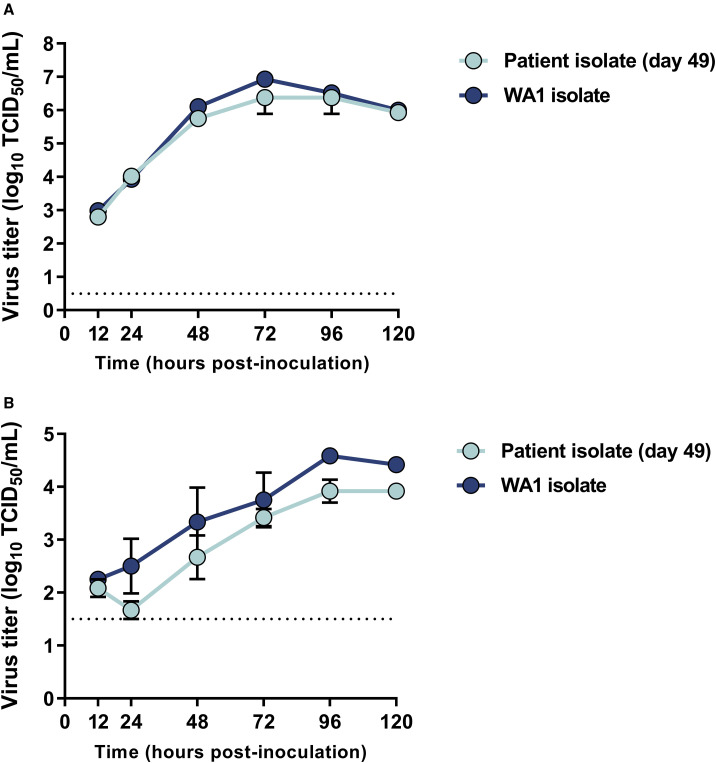
Long-term severe acute respiratory syndrome coronavirus 2 (SARS-CoV-2) shedding was observed from the upper respiratory tract of a female immunocompromised individual with chronic lymphocytic leukemia and acquired hypogammaglobulinemia. Shedding of infectious SARS-CoV-2 was observed up to 70 days, and of genomic and subgenomic RNA up to 105 days, after initial diagnosis. The infection was not cleared after the first treatment with convalescent plasma, suggesting a limited effect on SARS-CoV-2 in the upper respiratory tract of this individual. Several weeks after a second convalescent plasma transfusion, SARS-CoV-2 RNA was no longer detected. We observed marked within-host genomic evolution of SARS-CoV-2 with continuous turnover of dominant viral variants. However, replication kinetics in Vero E6 cells and primary human alveolar epithelial tissues were not affected. Our data indicate that certain immunocompromised individuals may shed infectious virus longer than previously recognized. Detection of subgenomic RNA is recommended in persistently SARS-CoV-2-positive individuals as a proxy for shedding of infectious virus.

Keywords: COVID-19; SARS-CoV-2; asymptometic; chronic lymphocytic leukemia; convalescent plasma; immunocompromised; infectious virus; long-term shedding; within host evolution.


Conflict of interest statement

Declaration of Interests The authors declare no competing interests.

Figures

None
Graphical abstract
Figure 1
Figure 1
Timeline of Clinical Presentation, Diagnostic Tests, and Treatments of an Immunocompromised Individual with Long-Term Shedding of SARS-CoV-2 Dates of relevant clinical events, such as surgeries, therapies, and outcome of diagnostic tests, are shown. Diagnostic qRT-PCR-positive nasopharyngeal and oropharyngeal swabs taken 49, 70, 77, 85, and 105 days after the initial positive sample were sent to Rocky Mountain Laboratories, NIH, for further analysis. Serum and plasma samples pre- and post-transfusion as well as a sample from the donor plasma were also provided. See also Tables S1–S3 for additional laboratory values and clinical information.
Figure 2
Figure 2
Assessment of Viral Load and Seroconversion in an Individual Persistently Infected with SARS-CoV-2 and Treated with Convalescent Plasma (A) Viral loads were in nasopharyngeal swabs collected at different time points after the initial SARS-CoV-2 diagnosis. Viral RNA extracted from a nasopharyngeal swab was analyzed for the presence of genomic RNA (gRNA; dark blue) and subgenomic RNA (sgRNA; light blue symbols) by qRT-PCR and reported as a cycle threshold (Ct) value (circles, left panel) and in ddPCR and reported as copy numbers (triangles, right panel). (B) IgG titers against the full-length recombinant SARS-CoV-2 spike ectodomain were determined by ELISA in convalescent plasma used for transfusion. The light gray bar represents the IgG titer of the first donor (convalescent plasma 1), and the dark gray bar represents the second donor (convalescent plasma 2). (C) IgG titers against the full-length recombinant SARS-CoV-2 spike ectodomain were determined by ELISA in patient serum collected at several time points, including immediately before and after transfusion with convalescent plasma on days 71 (light gray) and 82 (dark gray). Each serum/plasma sample was tested in duplicate. See also Figure S1 for IgG titers against the SARS-CoV-2 receptor binding domain (RBD).
Figure 3
Figure 3
Electron Microscopy Confirms Isolation of Coronavirus from the Individual’s Nasopharyngeal Swabs SARS-CoV-2 cultured from the individual’s nasopharyngeal swabs was used to inoculate Vero E6 cells for imaging by scanning and transmission electron microscopy (SEM and TEM, respectively). (A and B) SEM images of the day 49 (A) and day 70 (B) isolates. (C–E) TEM images of the day 49 (C) and day 70 (D and E) isolates. SEM scale bars, 1 μM; TEM scale bars, 0.5 μM.
Figure S1
Figure S1
ELISA Titers against the SARS-CoV-2 RBD, Related to Figure 2 (A) IgG titers against SARS-CoV-2 receptor binding domain (RBD) were determined in ELISA on convalescent plasma used for transfusion. The light gray bar is the IgG titer of the fist donor (convalescent plasma 1) and the dark gray is the second donor (convalescent plasma 2). (B) IgG titers against SARS-CoV-2 (RBD) were determined in ELISA on patient serum collected on several time points, including immediately before and after transfusion with convalescent plasma at day 71 (light gray) and day 82 (dark gray). Each serum/plasma sample was tested in duplicate.
Figure 4
Figure 4
Phylogenomic Analyses of Described SARS-CoV-2 Strains in a Persistently Infected Individual (A) Full-genome SARS-CoV-2 sequences representing previously described lineages (Rambaut et al., 2020) were downloaded from GISAID (Shu and McCauley, 2017). Lineages were then assigned using Pangolin v.2.0.3 (https://pangolin.cog-uk.io/). Using a representative genome from the assigned lineages and the four SARS-CoV-2 sequences from the individual, a maximum-likelihood tree was inferred using PhyML v.3.3.20180621 (Guindon et al., 2010) implemented in Geneious Prime v.2020.1.2 (https://www.geneious.com/) with a general time-reversible model of nucleotide substitution and rooted at the Wuhan-Hu-1/2019 SARS-CoV-2 strain. Sequences from the A and A.1 lineages are labeled, and the individual’s SARS-CoV-2 sequences are shown in cyan. hCoV-19/USA/WA-RML-1, -2, -3, and -4 are the genome sequences derived from the individual from day 49, 70, 85, and 105 nasopharyngeal swabs, respectively. (B) Full SARS-CoV-2 genomes were subsampled from Washington state, representing NextStrain clade 19B, including the four full-genome sequences recovered from the individual and the Wuhan-Hu-1/2019 sequence and aligned using MAFFT v.1.4 (Katoh and Standley, 2013; Katoh et al., 2002) implemented in Geneious Prime v.2020.1.2 (https://www.geneious.com/). A maximum-likelihood tree was then reconstructed with PhyML v.3.1 (Guindon et al., 2010), and a tree showing temporal divergence was inferred in TreeTime v.0.7.6 (Hadfield et al., 2018). The individual’s SARS-CoV-2 sequences are shown in cyan, and hCoV-19/USA/WA-RML-1, -2, -3, and -4 are the genome sequences derived from the individual from day 49, 70, 85, and 105 nasopharyngeal swabs, respectively. See also Figure S2.
Figure S2
Figure S2
Maximum-Likelihood Trees of the Individual with SARS-CoV-2 with Other SARS-CoV-2 Genomes Circulating in Washington State at the Times of Sampling (April 20, May 11, May 26, and June 15, 2020), Related to Figure 4 and Table 2 (A) Maximum likelihood tree using 1789 full genome SARS-CoV-2 sequences deposited to GISAID until 20 April 2020. Inset shows a close up of the monophyletic clade of the genomes directly obtained from the patient samples (cyan). (B) Maximum likelihood tree using 385 full genome SARS-CoV-2 sequences deposited to GISAID between 20 April and 11 May, 2020. The monophyletic clade of the genomes directly obtained from the patient samples is shown in cyan. (C) Maximum likelihood tree using 268 full genome SARS-CoV-2 sequences deposited to GISAID between 11 May and 26 May, 2020. The monophyletic clade of the genomes directly obtained from the patient samples is shown in cyan. (D) Maximum likelihood tree using 709 full genome SARS-CoV-2 sequences deposited to GISAID between 26 May and 15 June, 2020. The monophyletic clade of the genomes directly obtained from the patient samples is shown in cyan.
Figure 5
Figure 5
Deletions in the NTD of S1 of the Spike Protein (A) Nucleotide and amino acid sequence alignment of the region of the spike gene of the four sequences from the individual and the reference USA/WA1/2020 genome sequence containing the deletions observed in the day 49 and day 70 samples. Alignment was generated with MAFFT v.1.4 (Katoh and Standley, 2013; Katoh et al., 2002) implemented in Geneious Prime 2020.1.2 (https://www.geneious.com). (B) Amino acid residues removed by the day 49 (orange) and day 70 (red) spike deletions are highlighted on a SARS-CoV-2 spike trimer (PDB: 6zge; Wrobel et al., 2020). Each protomer of the trimer is shown in surface representation, colored in shades of gray. A single protomer is annotated, and its secondary structure is shown in cartoon representation. Glycans are shown as beige sticks. Previously reported spike deletions observed at the S1/S2 and S2′ cleavage sites (Andrés et al., 2020; Lau et al., 2020; Liu et al., 2020d) are colored blue and cyan, respectively. (C) Close-up view of the indicated region of (B) (dotted box) with the protein surface removed for clarity and accompanying amino acid sequence alignment, generated using Multalin (Corpet, 1988) and plotted with ESPript (Robert and Gouet, 2014).
Figure 6
Figure 6
Growth Kinetics of the Day 49 Isolate from the Individual in Vero E6 Cells and Primary Human Alveolar Epithelial Tissues (A) Vero E6 cells were inoculated with the day 49 patient isolate and the reference USA/WA1/2020 strain at a MOI of 0.01 in triplicate. (B) Primary 3D human alveolar epithelial tissues grown in 3D Transwell culture were inoculated with the same isolates at a MOI of 0.1. Supernatant was harvested at designated time points for assessment of viable virus using endpoint titration. Data shown are the mean and the standard error of the mean for three independent replicates. Statistical analysis using a 2-way ANOVA in GraphPad Prism shows no significant difference between the isolates at any of the time points.

References

    1. Amanat F., Stadlbauer D., Strohmeier S., Nguyen T.H.O., Chromikova V., McMahon M., Jiang K., Arunkumar G.A., Jurczyszak D., Polanco J. A serological assay to detect SARS-CoV-2 seroconversion in humans. Nat. Med. 2020;26:1033–1036. - PMC - PubMed
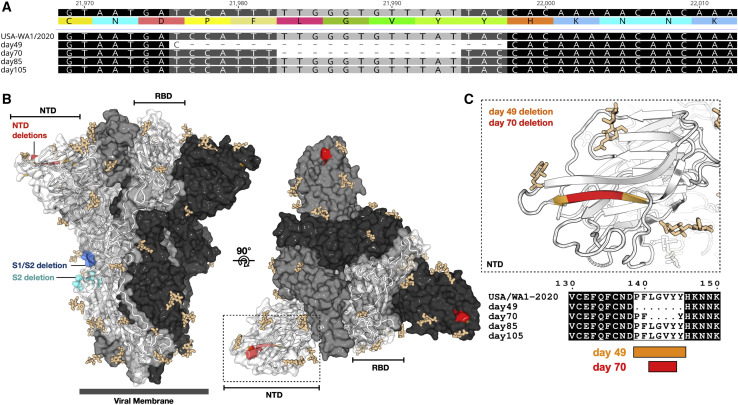
    1. Andrés C., Garcia-Cehic D., Gregori J., Piñana M., Rodriguez-Frias F., Guerrero-Murillo M., Esperalba J., Rando A., Goterris L., Codina M.G. Naturally occurring SARS-CoV-2 gene deletions close to the spike S1/S2 cleavage site in the viral quasispecies of COVID19 patients. Emerg. Microbes Infect. 2020;9:1900–1911. - PMC - PubMed
    1. Baumann T., Delgado J., Montserrat E. CLL and COVID-19 at the Hospital Clinic of Barcelona: an interim report. Leukemia. 2020;34:1954–1956. - PMC - PubMed
    1. Bhatraju P.K., Ghassemieh B.J., Nichols M., Kim R., Jerome K.R., Nalla A.K., Greninger A.L., Pipavath S., Wurfel M.M., Evans L. Covid-19 in Critically Ill Patients in the Seattle Region - Case Series. N. Engl. J. Med. 2020;382:2012–2022. - PMC - PubMed
    1. Brouwer P.J.M., Caniels T.G., van der Straten K., Snitselaar J.L., Aldon Y., Bangaru S., Torres J.L., Okba N.M.A., Claireaux M., Kerster G. Potent neutralizing antibodies from COVID-19 patients define multiple targets of vulnerability. Science. 2020;369:643–650. - PMC - PubMed

Publication types

MeSH terms

Substances