. 2021 Jan 5;33(1):65-77.e2.
doi: 10.1016/j.cmet.2020.11.014. Epub 2020 Nov 23.

Insulin Treatment Is Associated with Increased Mortality in Patients with COVID-19 and Type 2 Diabetes

Affiliations

Insulin Treatment Is Associated with Increased Mortality in Patients with COVID-19 and Type 2 Diabetes

Bo Yu et al. Cell Metab. .

Abstract

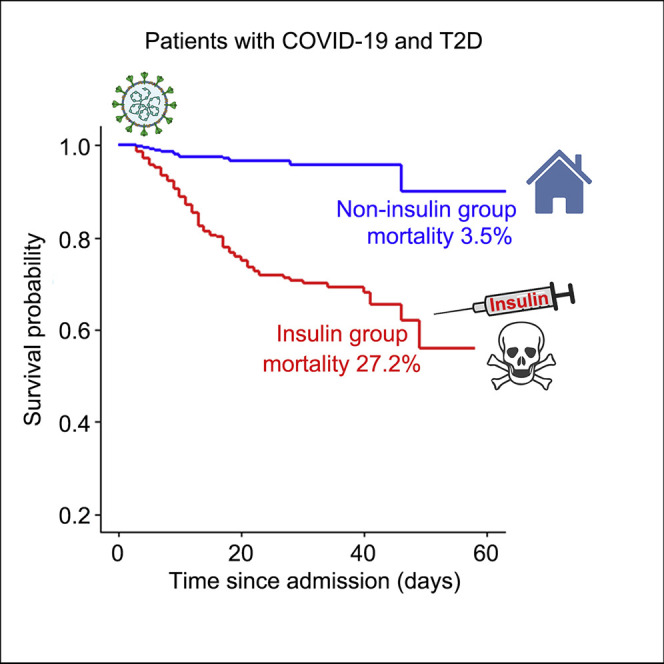
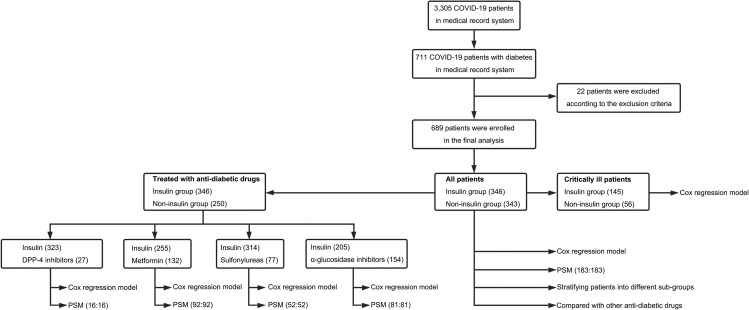
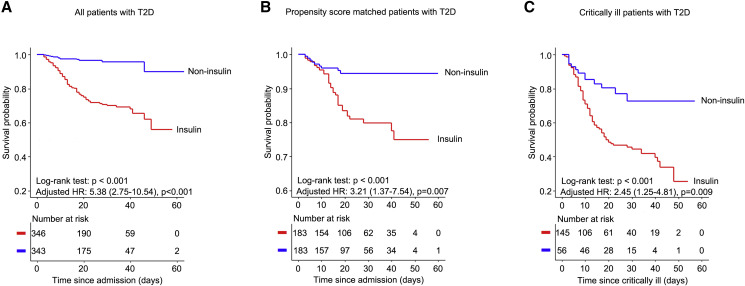
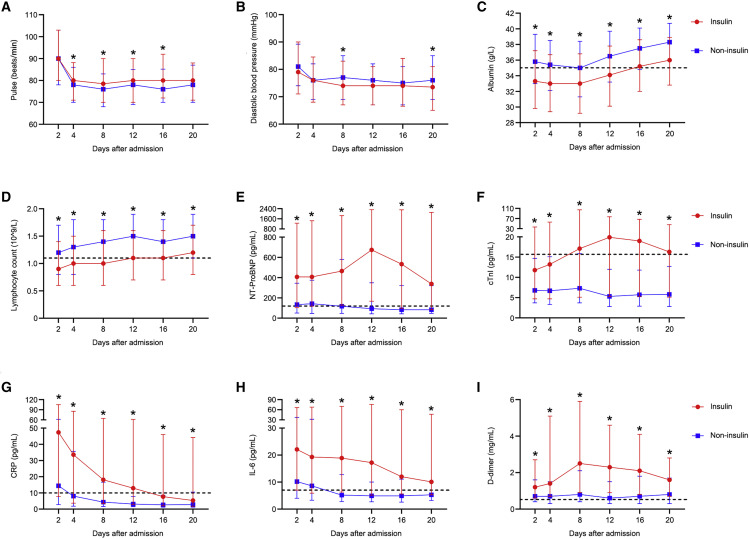
COVID-19 caused by SARS-COV-2 infection can lead to multi-organ injuries and significant mortality in severe and critical patients, especially among those individuals with type 2 diabetes (T2D) as a comorbidity. While attenuated mortality was observed with aggressive glucose control, it was unclear whether therapeutic regimens including insulin treatment were beneficial for patients with COVID-19 and T2D. This retrospective study investigated 689 patients with COVID-19 and T2D from a cohort of 3,305 cases from Wuhan, China. Unexpectedly, we found that insulin treatment for patients with COVID-19 and T2D was associated with a significant increase in mortality (27.2% versus 3.5%; adjusted HR, 5.38 [2.75-10.54]). Further analysis showed that insulin treatment was associated with enhanced systemic inflammation and aggravated injuries of vital organs. Therefore, insulin treatment for patients with COVID-19 and T2D should be used with caution.

Keywords: COVID-19; antidiabetic treatment; glycemic control; inflammation; insulin; mortality; type 2 diabetes.


Conflict of interest statement

Declaration of Interests The authors have declared that no competing interests exist.

Figures

None
Graphical abstract
Figure 1
Figure 1
The Flowchart of Study Design
Figure 2
Figure 2
Kaplan-Meier Survival Curve for Patients with COVID-19 and T2D with and without Insulin Treatment (A) Kaplan-Meier survival curve for all 689 patients with COVID-19 and T2D. (B) Kaplan-Meier survival curve for patients with COVID-19 and T2D in the propensity score-matched subpopulation. (C) Kaplan-Meier survival curve for critically ill patients with COVID-19 with T2D. Log-rank; p < 0.05 indicated statistical significance.
Figure 3
Figure 3
Kaplan-Meier Survival Curve for Patients with COVID-19 and T2D with and without Insulin Treatment in Different Subgroups (A) Kaplan-Meier survival curve for patients with COVID-19 and T2D with well-controlled glucose (≤10 mmol/L). (B) Kaplan-Meier survival curve for patients with COVID-19 and T2D with poorly controlled glucose (>10 mmol/L). (C) Kaplan-Meier survival curve for patients with COVID-19 and T2D with well-controlled HbA1c (<6.5%). (D) Kaplan-Meier survival curve for patients with COVID-19 and T2D with poorly controlled HbA1c (≥6.5%). (E) Kaplan-Meier survival curve for patients with COVID-19 and T2D with normal lymphocyte count on admission (≥1.1 × 109/L). (F) Kaplan-Meier survival curve for patients with COVID-19 and T2D with low lymphocyte count on admission (<1.1 × 109/L). (G) Kaplan-Meier survival curve for patients with COVID-19 and T2D with normal albumin on admission (≥35 g/L). (H) Kaplan-Meier survival curve for patients with COVID-19 and T2D with low albumin on admission (<35 g/L). (I) Kaplan-Meier survival curve for patients with COVID-19 and T2D with high NT-proBNP on admission (>285 pg/mL). (J) Kaplan-Meier survival curve for patients with COVID-19 and T2D with low NT-proBNP on admission (≤285 pg/mL). (K) Kaplan-Meier survival curve for patients with COVID-19 and T2D with high C-reactive protein on admission (>10 mg/L). (L) Kaplan-Meier survival curve for patients with COVID-19 and T2D with high IL-6 (>7 pg/mL) on admission. (M) Kaplan-Meier survival curve for patients with COVID-19 and newly diagnosed T2D. (N) Kaplan-Meier survival curve for patients with COVID-19 and T2D less than 5 years. (O) Kaplan-Meier survival curve for patients with COVID-19 and T2D more than 5 years. Log-rank; p < 0.05 indicated statistical significance.
Figure 4
Figure 4
Kaplan-Meier Survival Curve for Patients with COVID-19 and T2D with Insulin and Other Anti-diabetic Drugs after PSM (A) Kaplan-Meier survival analysis of patients treated with insulin or metformin. (B) Kaplan-Meier survival analysis of patients treated with insulin or α-glucosidase inhibitors. (C) Kaplan-Meier survival analysis of patients treated with insulin or sulfonylureas. (D) Kaplan-Meier survival analysis of patients treated with insulin or DPP-4 inhibitors. PSM, propensity score matching. Log-rank; p < 0.05 indicated statistical significance.
Figure 5
Figure 5
Dynamic Profile of Vital Signs and Laboratory Parameters in All 689 Patients with COVID-19 and T2D with and without Insulin Treatment (A) Dynamic change of pulse rates. (B) Dynamic change of diastolic blood pressure. (C) Dynamic change of albumin; the dashed line in black shows the upper normal limit of albumin (35 g/L). (D) Dynamic change of lymphocyte count; the dashed line in black shows the lower normal limit of lymphocyte count (1.1 × 109/L). (E) Dynamic change of NT-proBNP; the dashed line in black shows the lower limit of the adjudication of heart failure (125 pg/mL). (F) Dynamic change of hs-cTnI; the dashed line in black shows the lower limit of the adjudication of myocardial injury for female (15.6 pg/mL). (G) Dynamic change of hs-CRP; the dashed line in black shows the lower limit of the adjudication of inflammation (10 pg/mL). (H) Dynamic change of IL-6; the dashed line in black shows the upper normal limit (7 pg/mL). (I) Dynamic change of D-dimer; the dashed line in black shows the upper normal limit (0.5 mg/mL). p < 0.05.

References

    1. Badawi A., Ryoo S.G. Prevalence of diabetes in the 2009 influenza A (H1N1) and the Middle East respiratory syndrome coronavirus: a systematic review and meta-analysis. J. Public Health Res. 2016;5:733. - PMC - PubMed
    1. Bode B., Garrett V., Messler J., McFarland R., Crowe J., Booth R., Klonoff D.C. Glycemic characteristics and clinical outcomes of COVID-19 patients hospitalized in the United States. J. Diabetes Sci. Technol. 2020;14:813–821. - PMC - PubMed
    1. Bornstein S.R., Rubino F., Khunti K., Mingrone G., Hopkins D., Birkenfeld A.L., Boehm B., Amiel S., Holt R.I., Skyler J.S. Practical recommendations for the management of diabetes in patients with COVID-19. Lancet Diabetes Endocrinol. 2020;8:546–550. - PMC - PubMed
    1. Bramante C., Ingraham N., Murray T., Marmor S., Hoversten S., Gronski J., McNeil C., Feng R., Guzman G., Abdelwahab N. Observational study of metformin and risk of mortality in patients hospitalized with Covid-19. medRxiv. 2020 doi: 10.1101/2020.06.19.20135095. - DOI - PMC - PubMed
    1. Brundage S.I., Kirilcuk N.N., Lam J.C., Spain D.A., Zautke N.A. Insulin increases the release of proinflammatory mediators. J. Trauma. 2008;65:367–372. - PubMed

Publication types