

Comparison of Incidence and Outcomes of Neuroblastoma in Children, Adolescents, and Adults in the United States: A Surveillance, Epidemiology, and End Results (SEER) Program Population Study
- PMID: 33249420
- PMCID: PMC7711874
- DOI: 10.12659/MSM.927218
Comparison of Incidence and Outcomes of Neuroblastoma in Children, Adolescents, and Adults in the United States: A Surveillance, Epidemiology, and End Results (SEER) Program Population Study
Abstract
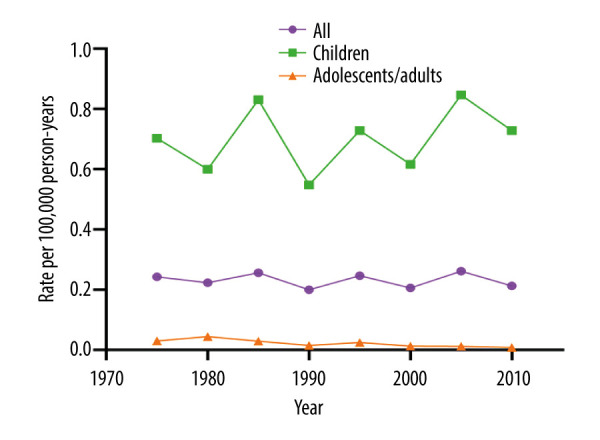
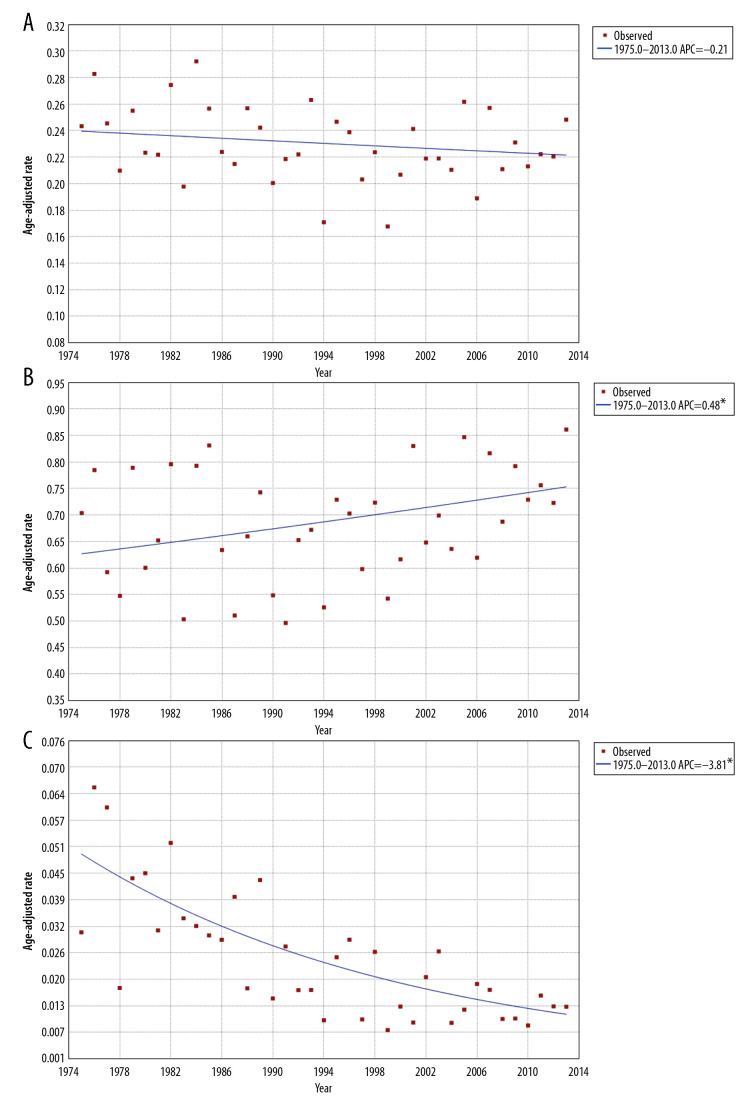
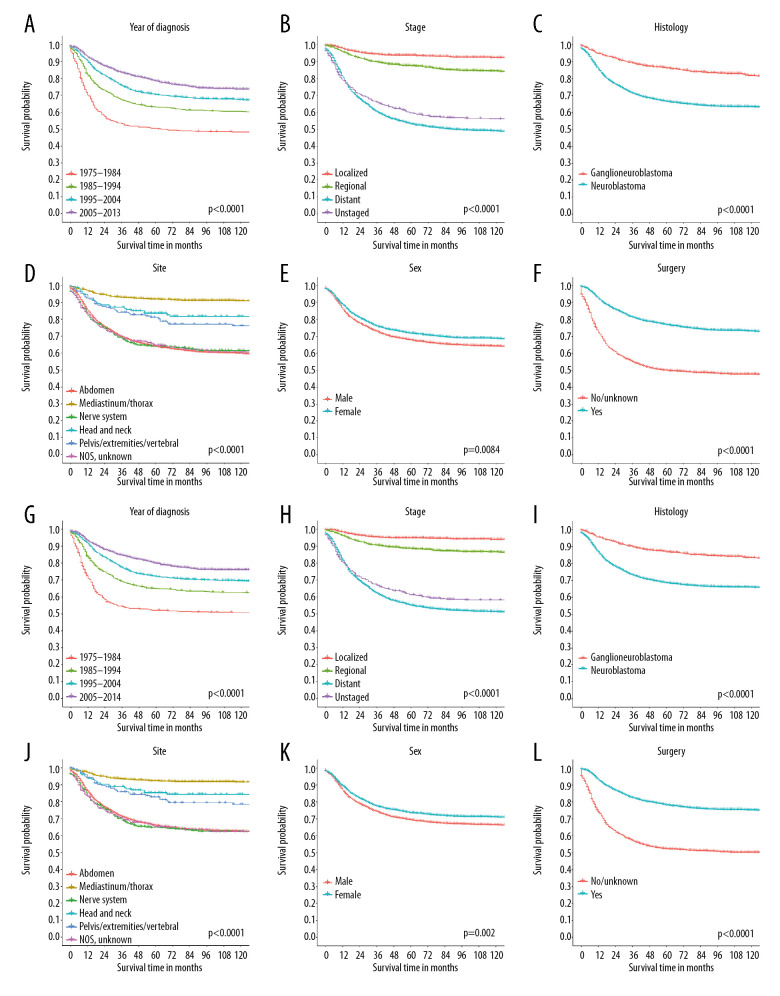
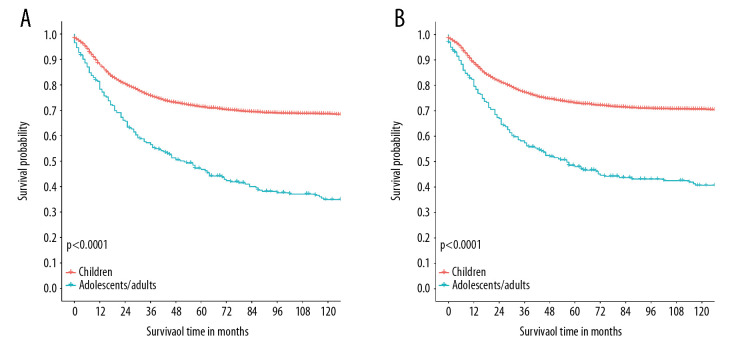
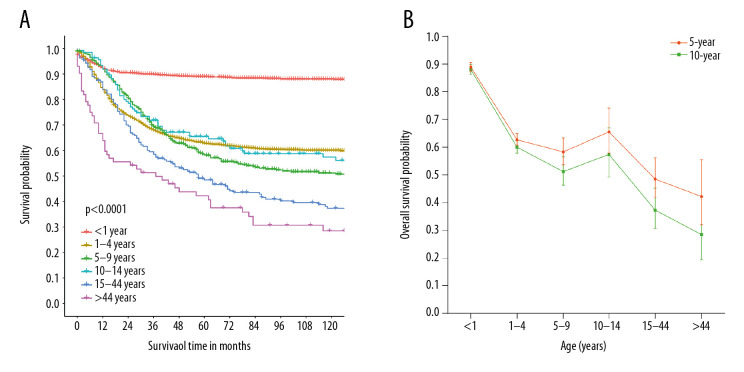
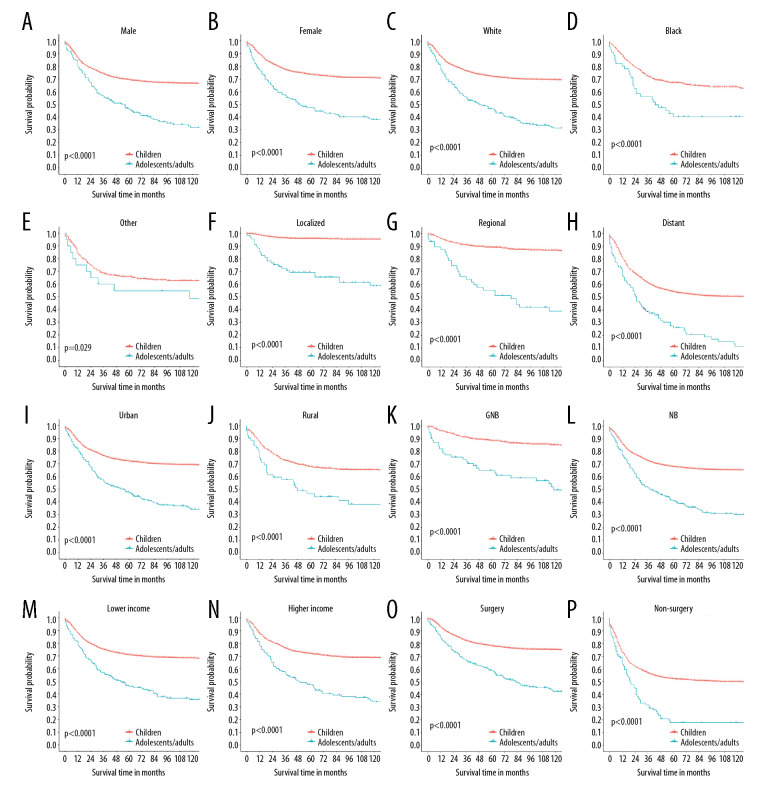
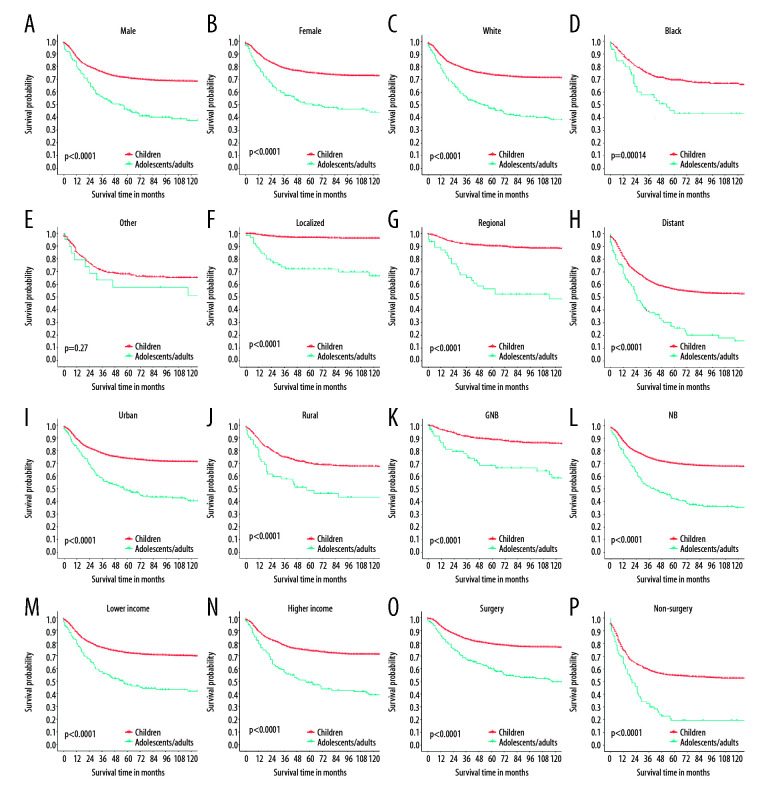
BACKGROUND This United States (U.S.) population study aimed to compare the incidence of neuroblastoma and outcomes in children, adolescents, and adults using the Surveillance, Epidemiology, and End Results (SEER) program database. MATERIAL AND METHODS Patients with neuroblastoma were identified in the SEER database from 1975 to 2013. According to the age at diagnosis, patients were divided into "Children" (≤14 years old) and "Adolescents/Adults" group (>14 years old). Then, comparisons in basic characteristics, incidence rates (IRs) and long-term survival outcomes between patients in 2 groups were made. RESULTS A total of 4280 patients were identified, including 3998 children and 282 adolescent/adult patients. Adolescent/adult patients were more likely to have localized diseases than children and to be diagnosed with ganglioneuroblastoma (all P<0.05). The IR of neuroblastoma presented with upward and downward trends in children and adolescent/adult populations, respectively. Adolescents/adults had worse overall survival (OS) than children despite the earlier tumor stage. Lastly, multivariate Cox proportional hazards analyses showed that tumor stage, histology, sequence of primary malignancy, primary site, the administration of surgery, and treatment era were prognostic factors for children, and sequence of primary malignancy, primary site, undergoing surgery, and treatment era were tightly related to OS in adolescent/adult patients. CONCLUSIONS Analysis of the SEER program database between 1975 to 2013 showed that in the U.S., the incidence of neuroblastoma in children increased, but the incidence decreased in adolescents and adults. There was a trend for improved overall survival in all age groups despite the increased stage at presentation in children.
Figures
References
-
- Ahmed AA, Zhang L, Reddivalla N, et al. Neuroblastoma in children: Update on clinicopathologic and genetic prognostic factors. Pediatr Hematol Oncol. 2017;34:165–85. - PubMed
-
- Kaatsch P, Steliarova-Foucher E, Crocetti E, et al. Time trends of cancer incidence in European children (1978–1997): Report from the Automated Childhood Cancer Information System project. Eur J Cancer. 2006;42:1961–71. - PubMed
Publication types
MeSH terms
LinkOut - more resources
Full Text Sources
Medical
