. 2021 Feb 1;162(2):bqaa217.
doi: 10.1210/endocr/bqaa217.

Activation of Preoptic Arginine Vasopressin Neurons Induces Hyperthermia in Male Mice

Affiliations

Activation of Preoptic Arginine Vasopressin Neurons Induces Hyperthermia in Male Mice

Iustin V Tabarean. Endocrinology. .

Abstract

Arginine vasopressin (AVP) is a neuropeptide acting as a neuromodulator in the brain and plays multiple roles, including a thermoregulatory one. However, the cellular mechanisms of action are not fully understood. Carried out are patch clamp recordings and calcium imaging combined with pharmacological tools and single-cell RT-PCR to dissect the signaling mechanisms activated by AVP. Optogenetics combined with patch-clamp recordings were used to determine the neurochemical nature of these neurons. Also used is telemetry combined with chemogenetics to study the effect of activation of AVP neurons in thermoregulatory mechanisms. This article reports that AVP neurons in the medial preoptic (MPO) area release GABA and display thermosensitive firing activity. Their optogenetic stimulation results in a decrease of the firing rates of MPO pituitary adenylate cyclase-activating polypeptide (PACAP) neurons. Local application of AVP potently modulates the synaptic inputs of PACAP neurons, by activating neuronal AVPr1a receptors and astrocytic AVPr1b receptors. Chemogenetic activation of MPO AVP neurons induces hyperthermia. Chemogenetic activation of all AVP neurons in the brain similarly induces hyperthermia and, in addition, decreases the endotoxin activated fever as well as the stress-induced hyperthermia.

Keywords: AVPr1a receptor; AVPr1b receptor; arginine vasopressin; hyperthermia; medial preoptic area.


Figures

Figure 1.
Figure 1.
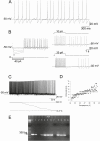
Electrophysiological characteristics of MPOAVP;hChR2 neurons. (A) Representative example of spontaneous firing activity of an MPOAVP;hChR2 neuron. (B) Membrane potential responses to hyperpolarizing current steps of -40, -30, -20, and -10 pA (left) reveal the presence of a “sag” (*) and the absence of o a low threshold spike after the steps. Depolarizing current injections of 10 and 30 pA (right) elicit increased firing activity with no adaptation and the activation of a slow afterhyperpolarization (arrow). MPOAVP;hChR2 neurons display thermosensitive firing activity. (C) The spontaneous firing rate of an AVP neuron gradually decreases from 12.8 Hz at 39.6°C to 2.9 Hz at 34.3°C. (D) The slope of the firing rate vs temperature plot yields a thermal coefficient of 1.29Hz/°C. (E) AVP transcripts are present in MPOAVP;hChR2 neurons. Representative gel from 10 MPOAVP;hChR2 neurons. The expected size of the PCR product is 257 bp. Negative (−) control was amplified from a harvested cell without reverse transcription, and positive control (+) was amplified using 1 ng of hypothalamic mRNA. AVP transcripts were detected in 8 of 10 neurons studied. AVP, arginine vasopressin; MPO, medial preoptic.
Figure 2.
Figure 2.
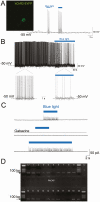
Effects of optogenetic stimulation of MPOAVP;hChR2 neurons on the activity of nearby MPO neurons. (A) Blue light activates action potential firing in an MPOAVP;hChR2 neuron expressing hChR2(H134R)-eYFP (inset). Increasing the light intensity of the illumination spot activates increased firing activity. The neuron was held at -56 mV by hyperpolarizing current injection of -10 pA). (B) Optogenetic stimulation of an MPOAVP;hChR2 neuron decreases the spontaneous firing rate of a nearby MPO neuron from 7.5 Hz to 1.2 Hz and increases the frequency of IPSC from 0.3 Hz to 3.7 Hz (see expanded traces). (C) Optogenetic stimulation of an MPOAVP;hChR2 neurons activates sIPSCs in a nearby MPO neuron. The sIPSCs were abolished by gabazine (5 µM) (middle trace). After washout of gabazine prolonged optogenetic stimulation (90 seconds) of the same neuron induced a similar activation of sIPSCs (lower trace). Recordings were performed in the presence of CNQX (20 µM) and AP-5 (50 µM) to block excitatory synaptic transmission. The neuron was held at -50 mV. (D) PACAP transcripts are present in MPO neurons inhibited by optogenetic stimulation of nearby MPOAVP;hChR2 neurons. Representative gel from 20 recorded MPO neurons. The expected size of the PCR product is 103 bp. Negative (−) control was amplified from a harvested cell without reverse transcription, and positive control (+) was amplified using 1 ng of hypothalamic mRNA. PACAP transcripts were detected in 18 of 20 neurons studied. IPSC, inhibitory postsynaptic current; MPO, medial preoptic; PACAP, pituitary adenylate cyclase-activating polypeptide.
Figure 3.
Figure 3.
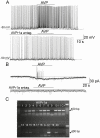
AVP excites and depolarizes a group of MPO neuron by activating AVPr1a receptors. (A) Example of a response to local AVP application in an MPO neuron. AVP (1 µM) increased the spontaneous firing rate of the neuron from 1.1 Hz to 8.2 Hz (upper trace). The AVPr1a antagonist SR 49059 (30 nM) blocks the effect of AVP (lower trace). (B) AVP (1 µM) activates and inward current of 18 pA and increases the frequency of sIPSCs in an MPO neuron (upper trace). Both effects were abolished by preincubation with AVPr1a antagonist SR 49059 (30 nM) (lower trace). The neuron was held at -50 mV. (C) AVPr1a transcripts are present in MPO neurons excited by AVP. Representative gel from 20 recorded MPO neurons. The expected size of the PCR product is 402 bp. Negative (–) control was from a harvested cell without reverse transcription and positive control (+) was amplified using 1 ng of hypothalamic mRNA. AVPr1a transcripts were detected in 16 of the 20 neurons studied. AVP, arginine vasopressin; MPO, medial preoptic.
Figure 4.
Figure 4.
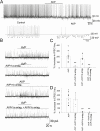
AVP inhibits the firing activity of MPO neurons by increasing their inhibitory input. (A) Example of an inhibitory effect of local AVP application on the spontaneous firing rate of a MPO neuron. AVP (1 µM) decreased the spontaneous firing rate of the neuron from 6.1 Hz to 0.4 Hz (upper trace). Expanded fragments of the recording emphasizing the change in spontaneous IPSP frequency (asterisks, lower row). (B) AVP (1 µM) increases the frequency of both sEPSCs and sIPSCs in an MPO neuron (upper trace). In the presence of AVP, the frequency of sIPSCs increased from 0.5 Hz to 4.1 Hz and the frequency of sEPSCs from 1.1 Hz to 2.6 Hz. The AVPr1a antagonist SR 49059 (30 nM) blocked the AVP effect on sIPSCs but did not affect the effect on sEPSCs (second trace from top). In contrast, in the presence of AVPr1b antagonist TASP 0390325 (20 nM) AVP did not change the frequency of sEPSCs but increased the frequency of sIPSCs from 1.0 Hz to 2.5 Hz (third trace from top). Coapplication of the 2 antagonists abolished the effect of AVP on both sIPSCs and sEPSCs (bottom trace). The neuron was held at -50 mV. Bar charts summarizing the effects of AVP, AVPr1a, and AVPr1b antagonists on the frequency of (C) sIPSCs and (D) sEPSC in MPO neurons inhibited by AVP. Bars represent means ± SD of the normalized firing rate relative to the control. Data pooled from n = 25 neurons in each condition. (C) There was a statistically significant difference between groups as determined by 1-way ANOVA (F(3,31) = 21.8, P = 1.7 × 10-7) followed by Tukey’s test relative to control; **statistical significance of P < 0.01. (D) There was a statistically significant difference between groups as determined by 1-way ANOVA (F(3,31) = 28.5, P = 1.2 × 10-8) followed by Tukey’s test relative to control; **statistical significance of P < 0.01. AVP, arginine vasopressin; MPO, medial preoptic.
Figure 5.
Figure 5.
Subpopulations of MPO neurons and astrocytes express AVPr1a and AVpr1b transcripts, respectively. AVPr1a, AVPr1b, NeuN, and Slc1a3 transcripts visualized using RNAscope technology. (A) Differential interference contrast image (first from left) of MPO neurons and astrocytes in culture and the respective DAPI staining (gray) and the neuronal marker NeuN (blue) (second from left). AVpr1a transcripts (green) and AVPr1b transcripts (red) are present in distinct populations of cells as indicated by their superimposed image (third, right). AVPr1a transcripts are present in 1 neuron as indicated by the presence of NeuN transcripts (blue) in the same cell (right, arrow). (B) Differential interference contrast image (first from left) of MPO neurons and astrocytes culture and the respective DAPI staining (gray) and the astrocytic marker Slc1a3 (blue) (second from left). AVPr1a transcripts (green) and AVPr1b transcripts (red) are present in distinct populations of cells as indicated by their superimposed images (third from left). AVPr1b transcripts are present in one astrocyte (right, arrow). Bar chart summarizing the percentages of (C) neurons (NeuN positive cells) and (D) astrocytes (Slc1a3 positive cells) that also express AVPr1a, AVPr1b, NeuN, and Slc1a3 transcripts. Data were averaged from 40 fields of view for both staining conditions containing 2 to 7 neurons and 6 to 13 astrocytes each. Overall, 39 of 195 cells expressing NeuN also expressed AVPr1a and 72 of 267 Slc1a3-expressing cells were positive for AVPr1b. There was a statistically significant difference between groups as determined by 1-way ANOVA (C) (F(2,149) = 169.9, P = 2.4 × 10–13 and (D) F(2,149) = 453.8, P = 1.1 × 10–16) followed by Tukey’s test relative to the other 2 groups; **statistical significance of P < 0.01. MPO, medial preoptic.
Figure 6.
Figure 6.
AVP activates [Ca2+]i responses in neurons and astrocytes by activating AVPr1a and AVPr1b, respectively. (A) [Ca2+]i responses to AVP (1 µM) from 3 acutely dissociated MPO neurons (black, blue, and green traces) and an average from 12 MPO neurons (red trace). The AVPr1a antagonist SR 49059 (20 nM) completely blocked the responses to AVP. The AVPr1b antagonist TASP 0390325 (10 nM) did not affect the AVP responses in neurons. (B) [Ca2+]i responses to AVP (1 µM) from 3 MPO astrocytes (black, blue, and green traces) and an average from 10 MPO astrocytes (red trace). The AVPr1b antagonist TASP 0390325 (10 nM) completely blocked the responses. The AVPr1a antagonist SR 49059 (20 nM) did not affect the AVP response in astrocytes. (A, B) TTX (1 µM) was added to all extracellular solutions. AVP, arginine vasopressin; MPO, medial preoptic.
Figure 7.
Figure 7.
AVP induces hyperthermia when injected centrally and hypothermia when injected subcutaneously. (A) Responses to bilateral intra-MPO injection (arrow) of AVP (1 µM, 100 nL, red trace), ICV injection of AVP (10 µM, 500 nL, blue trace), and bilateral intra-MPO aCSF (100 nL, black trace). AVP induced a hyperthermia of 2.1 ± 1.2 and 1.9 ± 1.4°C, respectively (1-way repeated measures ANOVA, F(2,357) = 113.5, P = 2.8 × 10-6, followed by t tests for each time point, **P < 0.01, *P < 0.05). (B) Subcutaneous injection (arrow) of AVP (1 mM, 5 µL, blue trace) and aCSF (black trace, control). AVP induced a hypothermia of 2.8 ± 0.8°C (1-way repeated measures ANOVA F(1,238) = 47.3, P = 1.9 × 10-8, followed by t tests for each time point relative to the aCSF injection, **P < 0.01). (A, B) The points represent averages ± SD (n = 6 mice) through the 10-hour recording period. Experiments were carried out in parallel in groups of 6 mice for each treatment. aCSF, artificial cerebrospinal fluid; AVP, arginine vasopressin; ICV, intracerebroventricular; MPO, medial preoptic.
Figure 8.
Figure 8.
Chemogenetic activation of AVP neurons induces hyperthermia. (A) Differential interference contrast (left) and fluorescence (right) images of an acute slice from MPOAVP;hM3D(Gq) mouse indicating hM3D(Gq)-mCherry expression in the MPO. (B) Intraperitoneal injection (arrow) of CNO (20 mM, 3 µL, red trace) or vehicle (3 µL DMSO, black trace) in MPOAVP;hM3D(Gq) mice. CNO induced a hyperthermia of 2.0 ± 0.5 (1-way repeated measures ANOVA, F(1,238) = 183.1, P = 7.2 × 10-8, followed by t tests for each time point, **P < 0.01). (C) Intraperitoneal injection (arrow) of CNO (20 mM, 3 µL, red trace) or vehicle (3 µL DMSO, black trace) in mice AVPhM3D(Gq) mice. CNO induced a hyperthermia of 1.8 ± 0.4 (1-way repeated measures ANOVA, F(1,238) = 60.5, P = 3.1 × 10-7, followed by t tests for each time point, **P < 0.01). (D) Intraperitoneal injection (arrow) of CNO (20 mM, 3 µL, red trace) or vehicle (3 µL DMSO, black trace) in mice MPOAVP;VGAT-/-;hM3D(Gq) mice. CNO induced a hyperthermia of 0.8 ± 0.3 (1-way repeated measures ANOVA, F(1,238) = 175.1, P = 5.2 × 10-5, followed by t tests for each time point, *P < 0.05). The response to CNO was significantly smaller than that of MPOAVP;hM3D(Gq) mice (1-way repeated measures ANOVA, F(1,238) = 220.5, P = 2.4 × 10-8). (B-D) The points represent averages ± SD through the 10-hour recording period. Experiments were carried out in parallel in groups of 6 mice for each treatment. AVP, arginine vasopressin; CNO, clozapine N-oxide; DMSO, dimethyl sulfoxide; MPO, medial preoptic.
Figure 9.
Figure 9.
Activation of MPO AVP neurons does not influence the fever response to LPS. (A) CBT responses to intraperitoneal injection (arrow) of LPS (0.03 mg/kg) + vehicle (3 µL DMSO) (black trace, control) and to LPS (0.03 mg/kg) + CNO (20 mM, 3 µL) (red trace) in MPOAVP;hM3D(Gq). LPS induced a fever of 1.5 ± 0.3 and 1.5 ± 0.4°C, in control and in the presence of CNO, respectively (1-way repeated measures ANOVA, F(1,238) = 4.8, P = 0.24, followed by t tests for each time point, **P < 0.01, *P < 0.05). (B) CBT responses to intraperitoneal injection (arrow) of LPS (0.03 mg/kg) + vehicle (3 µL DMSO) (black trace, control) and to LPS (0.03 mg/kg) + CNO (20 mM, 3 µL, red trace) in AVPhM3D(Gq) mice. Activation of AVP neurons decreases the initial hyperthermic response from 1.4 ± 0.2°C (control) to 0.7 ± 0.3°C as well as the late phase of fever from 1.8 ± 0.4°C (control) to 0.6 ± 0.3°C (1-way repeated measures ANOVA, F(1,238) = 35.1, P = 7.2 × 10-6, followed by t tests for each time point, **P < 0.01). (C) LPS (intraperitoneal, 0.03 mg/kg) induces fever responses in AVPGAT+/+ mice (black trace, control) and AVPGAT-/- mice (red trace). The intermediate and late phases of the fever response are diminished in AVPGAT-/- mice (1-way repeated measures ANOVA, F(1,238) = 52.1, P = 1.5 × 10-6, followed by t tests for each time point, **P < 0.01). (A-C) The points represent averages ± SD (n = 6 mice) through the 10-hour recording period. AVP, arginine vasopressin; CBT, core body temperature; DMSO, dimethyl sulfoxide; LPS, lipopolysaccharide; MPO, medial preoptic.
Figure 10.
Figure 10.
Hyperthermic responses induced by restraint stress. (A) CBT responses to 90-minute restrain stress (black bar) in AVPhM3D(Gq) mice after intraperitoneal injection (arrow) of vehicle (3 µl DMSO, black trace, control) or CNO (20 mM, 3 µL, red trace). Activation of AVP neurons decreased the hyperthermia induced by restraint stress by 0.7 ± 0.4°C, in control and in the presence of CNO, respectively (1-way repeated measures ANOVA, F(1,238) = 39.1, P = 3.1 × 10-7, followed by t tests for each time point, **P < 0.01). (B) CBT responses to 90-minute restrain stress (black bar) in AVPGAT+/+ mice (black trace, control) and AVPGAT-/- (red trace). AVPGAT-/- mice displayed a hyperthermic rebound of 1.5 ± 0.6°C upon release from the restraint tube, which was not present in the control (1-way repeated measures ANOVA, F(1,238) = 131.9, P = 6 × 10-8, followed by t tests for each time point, **P < 0.01). (A, B) The points represent averages ± SD (n = 6 mice) through the 10-hour recording period. AVP, arginine vasopressin; CBT, core body temperature; CNO, clozapine N-oxide; DMSO, dimethyl sulfoxide.
Figure 11.
Figure 11.
Schematic representation of a preoptic pathway controlling thermogenesis Preoptic thermoregulatory PACAP neurons are glutamatergic and project to inhibitory interneurons in other brain regions that project to thermogenic neurons. PACAP neurons’s inhibition results in increased thermogenesis (diagram adapted from (15)). Preoptic AVP neurons are proposed to project locally and modulate the activity of thermoregulatory PACAP neurons. PACAP, pituitary adenylate cyclase-activating polypeptide.

Similar articles

Cited by

References

    1. Hoffman GE, McDonald T, Figueroa JP, Nathanielsz PW. Neuropeptide cells and fibers in the hypothalamus and pituitary of the fetal sheep: comparison of oxytocin and arginine vasopressin. Neuroendocrinology. 1989;50(6):633-643. - PubMed
    1. Ueta Y, Dayanithi G, Fujihara H. Hypothalamic vasopressin response to stress and various physiological stimuli: visualization in transgenic animal models. Horm Behav. 2011;59(2):221-226. - PubMed
    1. Dayanithi G, Forostyak O, Forostyak S, Kayano T, Ueta Y, Verkhratsky A. Vasopressin and oxytocin in sensory neurones: expression, exocytotic release and regulation by lactation. Sci Rep. 2018;8(1):13084. - PMC - PubMed
    1. Richard P, Moos F, Dayanithi G, Gouzènes L, Sabatier N. Rhythmic activities of hypothalamic magnocellular neurons: autocontrol mechanisms. Biol Cell. 1997;89(9):555-560. - PubMed
    1. Tasker JG, Prager-Khoutorsky M, Teruyama R, Lemos JR, Amstrong WE. Advances in the neurophysiology of magnocellular neuroendocrine cells. J Neuroendocrinol. 2020;32(4):e12826. - PMC - PubMed

Publication types