. 2021 Jan 18;376(1816):20190723.
doi: 10.1098/rstb.2019.0723. Epub 2020 Nov 30.

Directly modelling population dynamics in the South American Arid Diagonal using 14C dates

Affiliations

Directly modelling population dynamics in the South American Arid Diagonal using 14C dates

Adrian Timpson et al. Philos Trans R Soc Lond B Biol Sci. .

Abstract

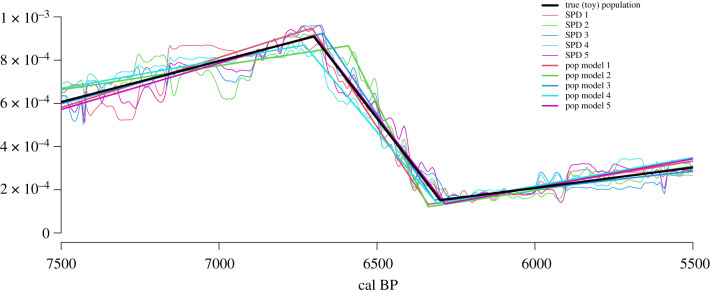
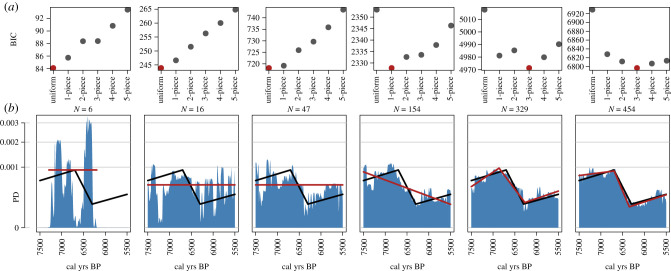
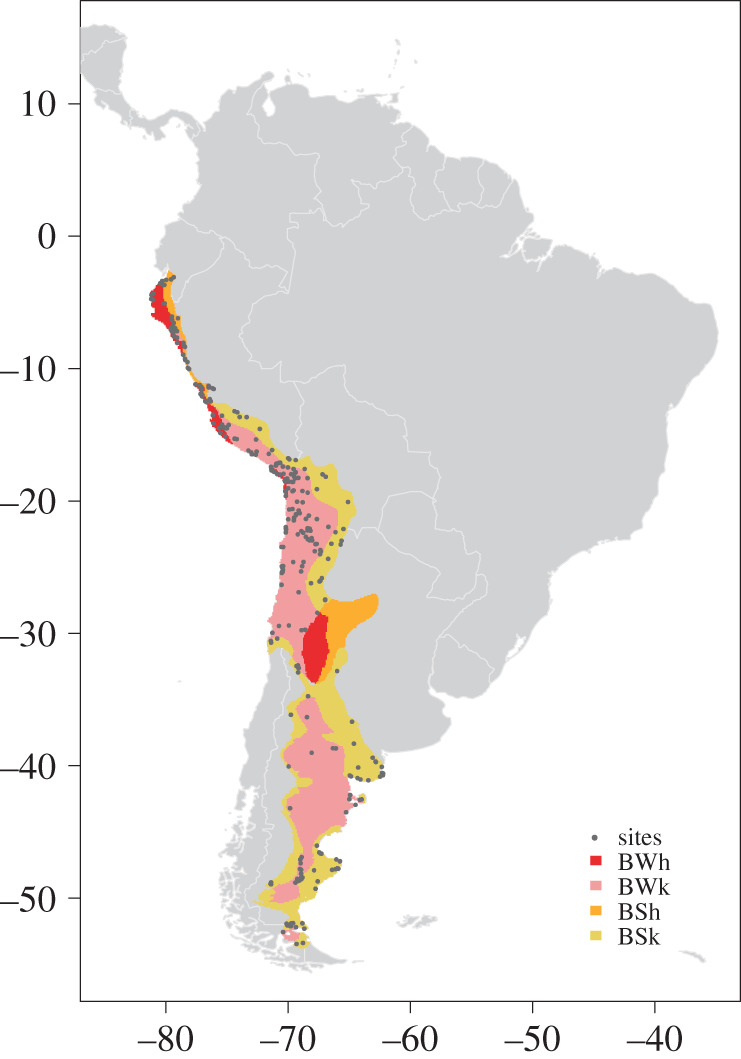
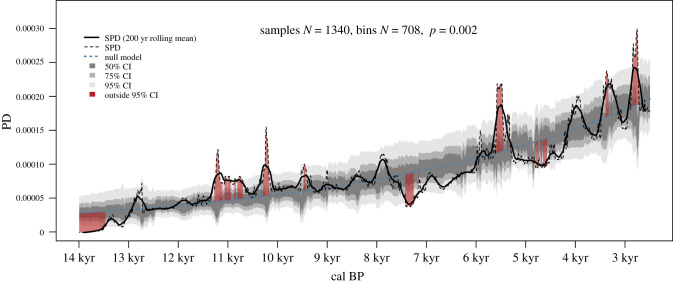
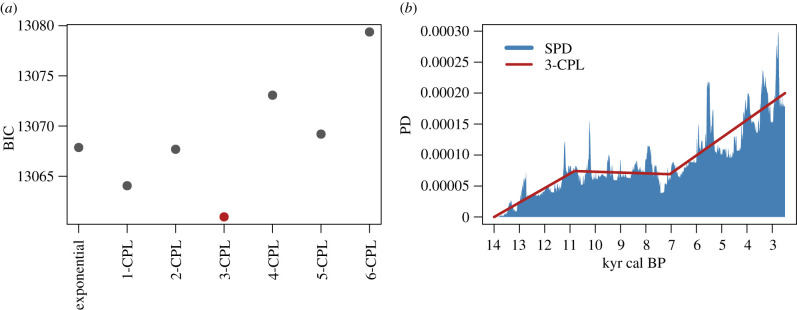
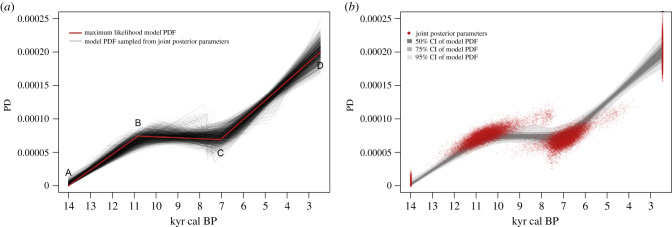
Large anthropogenic 14C datasets are widely used to generate summed probability distributions (SPDs) as a proxy for past human population levels. However, SPDs are a poor proxy when datasets are small, bearing little relationship to true population dynamics. Instead, more robust inferences can be achieved by directly modelling the population and assessing the model likelihood given the data. We introduce the R package ADMUR which uses a continuous piecewise linear (CPL) model of population change, calculates the model likelihood given a 14C dataset, estimates credible intervals using Markov chain Monte Carlo, applies a goodness-of-fit test, and uses the Schwarz Criterion to compare CPL models. We demonstrate the efficacy of this method using toy data, showing that spurious dynamics are avoided when sample sizes are small, and true population dynamics are recovered as sample sizes increase. Finally, we use an improved 14C dataset for the South American Arid Diagonal to compare CPL modelling to current simulation methods, and identify three Holocene phases when population trajectory estimates changed from rapid initial growth of 4.15% per generation to a decline of 0.05% per generation between 10 821 and 7055 yr BP, then gently grew at 0.58% per generation until 2500 yr BP. This article is part of the theme issue 'Cross-disciplinary approaches to prehistoric demography'.

Keywords: ADMUR; Holocene population dynamics; South American Arid Diagonal; continuous piecewise linear model; radiocarbon; summed probability distribution.


Conflict of interest statement

We declare we have no competing interests.

Figures

Figure 1.
Figure 1.
3-CPL models best fitted to five randomly sampled datasets of N = 1500 14C dates. SPDs of each calibrated dataset illustrate the variation from generating random samples. This variation between random datasets is the underlying cause of the small differences between the hinge-point dates in each ML model. (Online version in colour.)
Figure 2.
Figure 2.
Model selection naturally guards against overfitting with small sample sizes since the lack of information content favours simple models. By contrast, the SPDs suggest interesting population dynamics that in fact are merely the artefacts of small sample sizes and calibration wiggles. (a) The best model (red) selected using BIC between a uniform distribution and five increasingly complex n-CPL models. (b) SPD (blue) generated from calibrated 14C dates randomly sampled from the same true (toy) population curve (black), and best CPL model PDF (red) constructed from ML parameters. Note, the slight bend in black and red lines are merely a consequence of the nonlinear y-axis used. (Online version in colour.)
Figure 3.
Figure 3.
Site location of radiocarbon dates in SAAD. All sites are within the contiguous SAAD, the boundary of which is defined using four of the Koppen–Geiger climate classification zones using table 1 from Peel et al. [43]: BWh, arid hot desert, mean annual precipitation (MAP) < 5× Pthreshold, mean annual temperature (MAT) ≥ 18°C; BWk, arid cold desert, MAP < 5× Pthreshold, MAT < 18°C; BSh, arid steppe hot, MAP ≥ 5× Pthreshold, MAT ≥ 18°C; BSk, arid steppe cold MAP ≥ 5× Pthreshold, MAT < 18°C. (Online version in colour.)
Figure 4.
Figure 4.
SPD simulation approach illustrating the null hypothesis of steady exponential growth can be rejected. (Online version in colour.)
Figure 5.
Figure 5.
(a) Model comparison between an exponential model and n-CPL models of varying complexity using the BIC establishes the 3-CPL model as best; (b) red line shows the shape of the best 3-CPL model estimated using the ML parameters; blue polygon shows the calibrated dataset as an SPD. (Online version in colour.)
Figure 6.
Figure 6.
Grey: marginal posterior distributions of the parameters defining the four hinge points, estimated using MCMC. The dates of hinges A and D are not free parameters since they are fixed at 14 kyr BP and 2.5 kyr BP, respectively. Red: ML parameters estimated separately using the search algorithm. (Online version in colour.)
Figure 7.
Figure 7.
Credible intervals of the 3-CPL model. (a) Model PDFs using the joint parameters of 1000 samples from the joint posterior parameter distribution (black) and ML parameters (red), hinge points marked A–D. (b) The 50%, 75% and 95% credible intervals (grey) of all model PDFs (grey), and parameter values (red), sampled from the joint posterior parameter distribution. (Online version in colour.)

References

    1. Collard M, Buchanan B, Hamilton MJ, O'Brien MJ. 2010. Spatiotemporal dynamics of the Clovis–Folsom transition. J. Archaeol. Sci. 37, 2513–2519. (10.1016/j.jas.2010.05.011) - DOI
    1. Barberena R, Mendez C, de Porras ME. 2017. Zooming out from archaeological discontinuities: the meaning of mid-Holocene temporal troughs in South American deserts. J. Anthropol. Archaeol. 46, 68–81. (10.1016/j.jaa.2016.07.003) - DOI
    1. Williams AN. 2012. The use of summed radiocarbon probability distributions in archaeology: a review of methods. J. Archaeol. Sci. 39, 578–589. (10.1016/j.jas.2011.07.014) - DOI
    1. Hinz M, Feeser I, Sjögren K-G, Müller J. 2012. Demography and the intensity of cultural activities: an evaluation of Funnel Beaker Societies (4200–2800 cal BC). J. Archaeol. Sci. 39, 3331–3340. (10.1016/j.jas.2012.05.028) - DOI
    1. Kuper R, Kropelin S. 2006. Climate-controlled Holocene occupation in the Sahara: motor of Africa's evolution. Science 313, 803–807. (10.1126/science.1130989) - DOI - PubMed

Publication types

LinkOut - more resources