Comparative Study
. 2020 Nov 30;22(1):77.
doi: 10.1186/s12968-020-00689-x.

Is a timely assessment of the hematocrit necessary for cardiovascular magnetic resonance-derived extracellular volume measurements?

Affiliations
Comparative Study

Is a timely assessment of the hematocrit necessary for cardiovascular magnetic resonance-derived extracellular volume measurements?

Mao-Yuan Su et al. J Cardiovasc Magn Reson. .

Abstract

Background: Cardiovascular magnetic resonance (CMR)-derived extracellular volume (ECV) requires a hematocrit (Hct) to correct contrast volume distributions in blood. However, the timely assessment of Hct can be challenging and has limited the routine clinical application of ECV. The goal of the present study was to evaluate whether ECV measurements lead to significant error if a venous Hct was unavailable on the day of CMR.

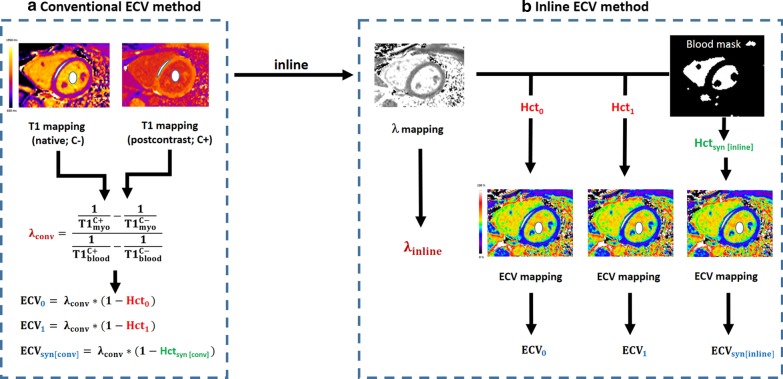
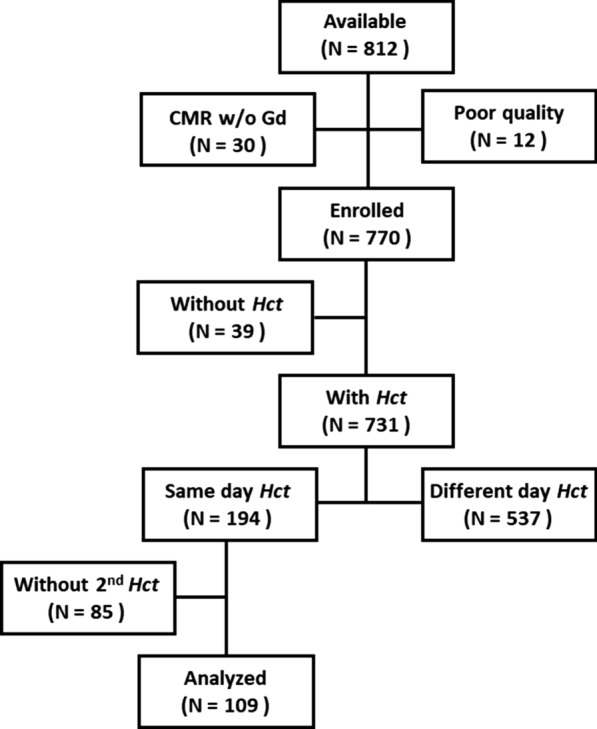
Methods: 109 patients with CMR T1 mapping and two venous Hcts (Hct0: a Hct from the day of CMR, and Hct1: a Hct from a different day) were retrospectively identified. A synthetic Hct (Hctsyn) derived from native blood T1 was also assessed. The study used two different ECV methods, (1) a conventional method in which ECV was estimated from native and postcontrast T1 maps using a region-based method, and (2) an inline method in which ECV was directly measured from inline ECV mapping. ECVs measured with Hct0, Hct1, and Hctsyn were compared for each method, and the reference ECV (ECV0) was defined using the Hct0. The error between synthetic (ECVsyn) and ECV0was analyzed for the two ECV methods.

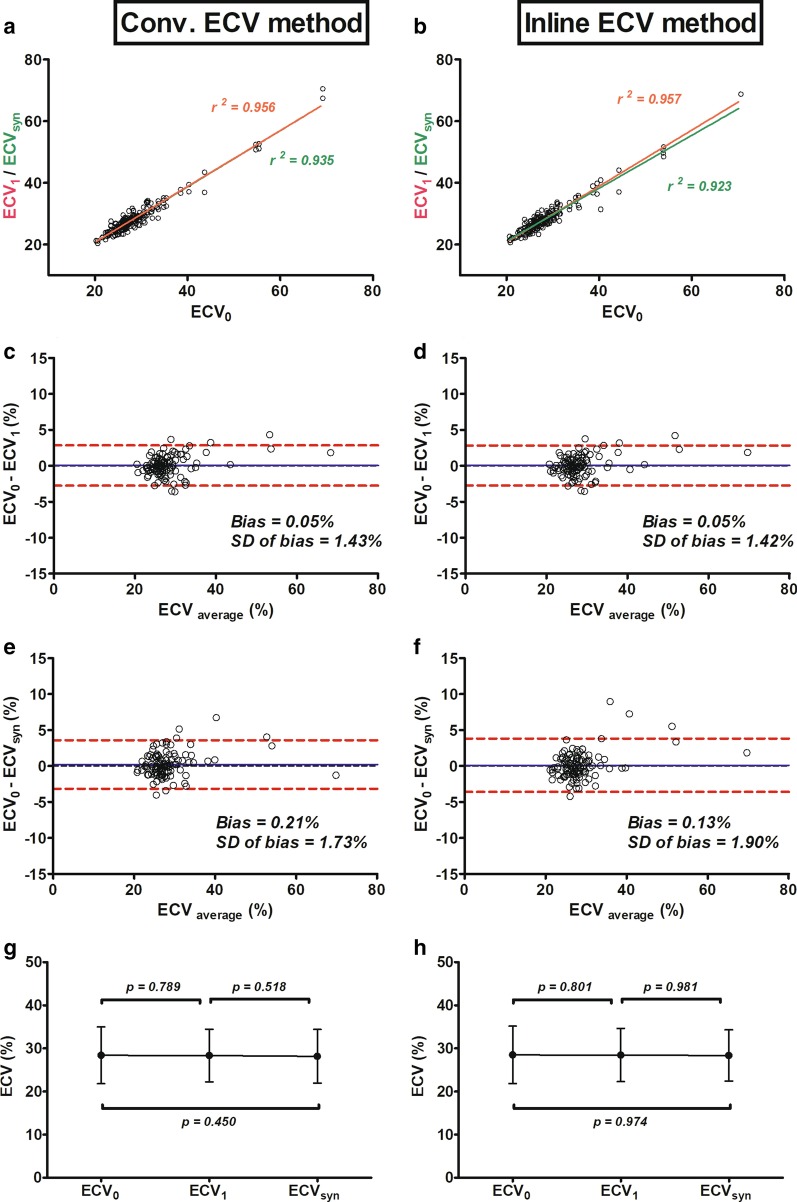
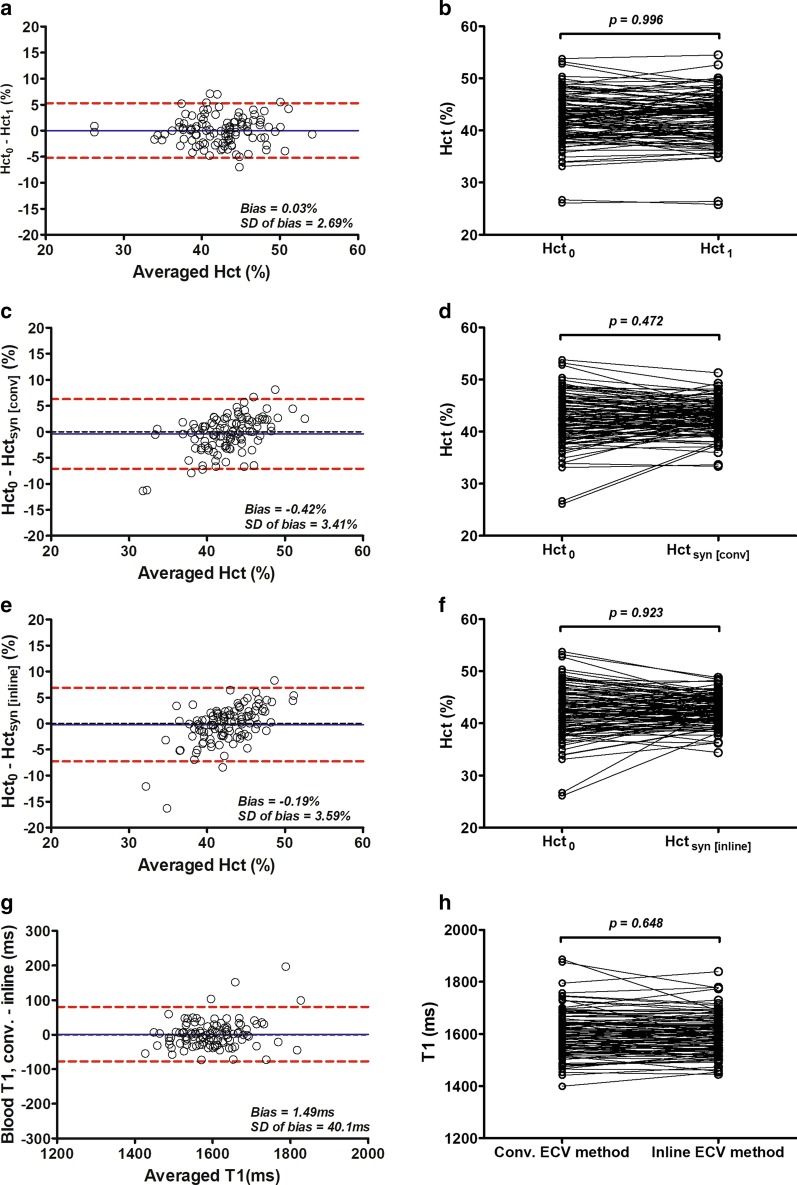
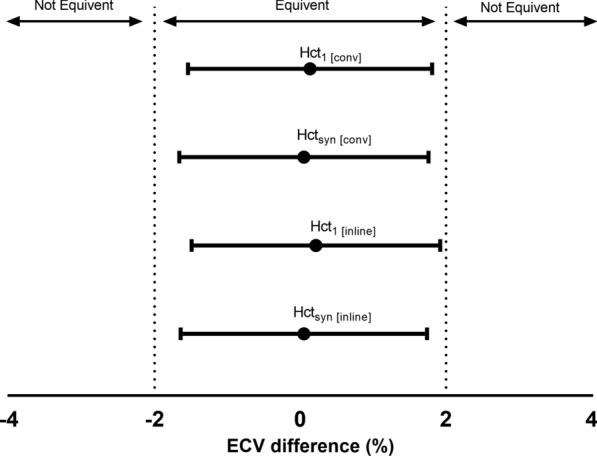
Results: ECV measured using Hct1 and Hctsyn were significantly correlated with ECV0 for each method. No significant differences were observed between ECV0 and ECV measured with Hct1 (ECV1; 28.4 ± 6.6% vs. 28.3 ± 6.1%, p = 0.789) and between ECV0 and ECV calculated with Hctsyn (ECVsyn; 28.4 ± 6.6% vs. 28.2 ± 6.2%, p = 0.45) using the conventional method. Similarly, ECV0 was not significantly different from ECV1 (28.5 ± 6.7% vs. 28.5 ± 6.2, p = 0.801) and ECVsyn (28.5 ± 6.7% vs. 28.4 ± 6.0, p = 0.974) using inline method. ECVsyn values revealed relatively large discrepancies in patients with lower Hcts compared with those with higher Hcts.

Conclusions: Venous Hcts measured on a different day from that of the CMR examination can still be used to measure ECV. ECVsyn can provide an alternative method to quantify ECV without needing a blood sample, but significant ECV errors occur in patients with severe anemia.

Keywords: Cardiovascular magnetic resonance; Extracellular volume fraction; Hematocrit; T1 mapping.


Conflict of interest statement

The authors declare that they have no competing interests.

Figures

Fig. 1
Fig. 1
Schematic illustration of the conventional (a) and inline extracellular volume (ECV) methods (b). a The conventional ECV method derives a partition coefficient (λconv) using averaged T1 values from regions-of-interests (ROIs) drawn in the myocardium and blood in native and postcontrast T1 maps. The ECV values are calculated from three different hematocrits (Hct). ECV0 is derived from an Hct0 measured on the same day as cardiovascular magnetic resonance (CMR) exam; ECV1 is derived using Hct1, which is measured on a different day; ECVsyn is derived using Hctsyn[conv] which is calculated from the native blood T1. b Inline partition coefficient (λ) mapping is automatically generated on a pixelwise basis after image registration of the native and postcontrast T1 maps. The blood mask is automatically generated from native T1 mapping and used to estimate Hctsyn[inline]. Three inline ECV maps were reconstructed with Hct0, Hct1, and Hctsyn[inline]. Three ECV values, ECV0, ECV1, and ECVsyn, are directly measured from three different inline ECV maps using the same myocardial ROI for T1 mapping
Fig. 2
Fig. 2
A flow chart showing the selection process in this study. 812 consecutive patients were available for inclusion in this cohort. A total of 770 subjects were included in this study; 37 patients that did not have hematocrit (Hct) data were excluded. 149 patients had both Hct data and CMR performed on the same day. Among these patients, 109 patients had a second Hct (HCT1) measure and were included for further analysis
Fig. 3
Fig. 3
a Linear regression between native blood 1/T1 (R1) and Hct measured on the same day as that of CMR (Hct0). b Correlation graph comparing synthetic ECV error (synECVerror) obtained from the conventional ECV method (red line) and the inline ECV method (black line). Both errors are positively associated with the Hct levels
Fig. 4
Fig. 4
Correlation and comparisons among three extracellular volumes (ECVs) derived from three different hematocrits (Hcts) using the conventional ECV and the inline ECV methods. ECV1 and ECVsyn are both strongly correlated with ECV0 in the conventional method (a) and the inline ECV method (b). In the conventional method, Bland–Altman plots indicate minimal bias between ECV1 and ECV0 (c) and between ECVsyn and ECV0 (e). Similarly, Bland–Altman plots also indicate minimal bias between ECV1 and ECV0 (d) and between ECVsyn and ECV0 (f) in inline ECV method. No significant differences among 3 ECVs in the conventional method (g) and the inline ECV method (h) were observed. ECV0 is derived using an Hct obtained on the day of CMR (CMR; Hct0), ECV1 is derived with Hct1 is measured from a different day than CMR, and ECVsyn is derived with Hctsyn, which is calculated from native blood T1 mapping
Fig. 5
Fig. 5
Comparisons among three different hematocrits (Hcts) and between two native blood T1. Bland–Altman plots indicate the minimal bias between Hct1 and Hct0 (a), between Hctsyn [conv] and Hct0 (c), and between Hctsyn [inline] and Hct0 (e). There is no statistical difference between Hct1 and Hct0 (b), between Hctsyn [conv] and Hct0 (d), and between Hctsyn [inline] and Hct0 (f). Bland–Altman plot indicates a 1.5 ms bias and confidence limit (7.2–6.9 ms) using the inline method compared with using the conventional method (g), which resulted in no statistical difference between the conventional and inline ECV methods for native blood T1 measurements (h). Hct0 is Hct obtained on the same day as theCMR. Hct1 is Hct obtained on a different day from the CMR. Hctsyn [conv] and Hctsyn [inline] are Hcts obtained synthetically from native blood T1mapping using the conventional and inline ECV methods, respectively
Fig. 6
Fig. 6
Interpretation of equivalence of tested hematocrits (Hct1, Hctsyn) to the standard hematocrit (Hct0) for ECV measurements. The dashed vertical lines indicate the predefined equivalence margins (− 2 to 2%) and the horizontal lines represent the 95% confidence interval (CI) of the difference in ECV between compared Hcts. Equivalence is concluded if the entire CI is within the equivalence margins. Hct1 [conv] and Hct1 [inline] are hematocrits obtained on a different day from that of CMR f using the conventional and inline ECV methods, respectively. Hctsyn [conv] and Hctsyn [inline] are Hcts obtained synthetically from native blood T1 mapping using the conventional and inline ECV methods, respectively

References

    1. Wong TC, Piehler K, Meier CG, et al. Association between extracellular matrix expansion quantified by cardiovascular magnetic resonance and short-term mortality. Circulation. 2012;126:1206–1216. doi: 10.1161/CIRCULATIONAHA.111.089409. - DOI - PMC - PubMed
    1. Su MY, Lin LY, Tseng YH, et al. CMR-verified diffuse myocardial fibrosis is associated with diastolic dysfunction in HFpEF. JACC Cardiovasc Imaging. 2014;7:991–997. doi: 10.1016/j.jcmg.2014.04.022. - DOI - PubMed
    1. Haaf P, Garg P, Messroghli DR, Broadbent DA, Greenwood JP, Plein S. Cardiac T1 Mapping and Extracellular Volume (ECV) in clinical practice: a comprehensive review. J Cardiovasc Magn Reson. 2016;18:89. doi: 10.1186/s12968-016-0308-4. - DOI - PMC - PubMed
    1. Rommel KP, von Roeder M, Latuscynski K, et al. Extracellular volume fraction for characterization of patients with heart failure and preserved ejection fraction. J Am Coll Cardiol. 2016;67:1815–1825. doi: 10.1016/j.jacc.2016.02.018. - DOI - PubMed
    1. Messroghli DR, Moon JC, Ferreira VM, et al. Clinical recommendations for cardiovascular magnetic resonance mapping of T1, T2, T2* and extracellular volume: a consensus statement by the Society for Cardiovascular Magnetic Resonance (SCMR) endorsed by the European Association for Cardiovascular Imaging (EACVI) J Cardiovasc Magn Reson. 2017;19:75. doi: 10.1186/s12968-017-0389-8. - DOI - PMC - PubMed

Publication types

MeSH terms