. 2020 Oct;37(3):696-708.
doi: 10.1007/s00357-019-09345-1. Epub 2019 Dec 23.

ROC and AUC with a Binary Predictor: a Potentially Misleading Metric

Affiliations

ROC and AUC with a Binary Predictor: a Potentially Misleading Metric

John Muschelli. J Classif. 2020 Oct.

Abstract

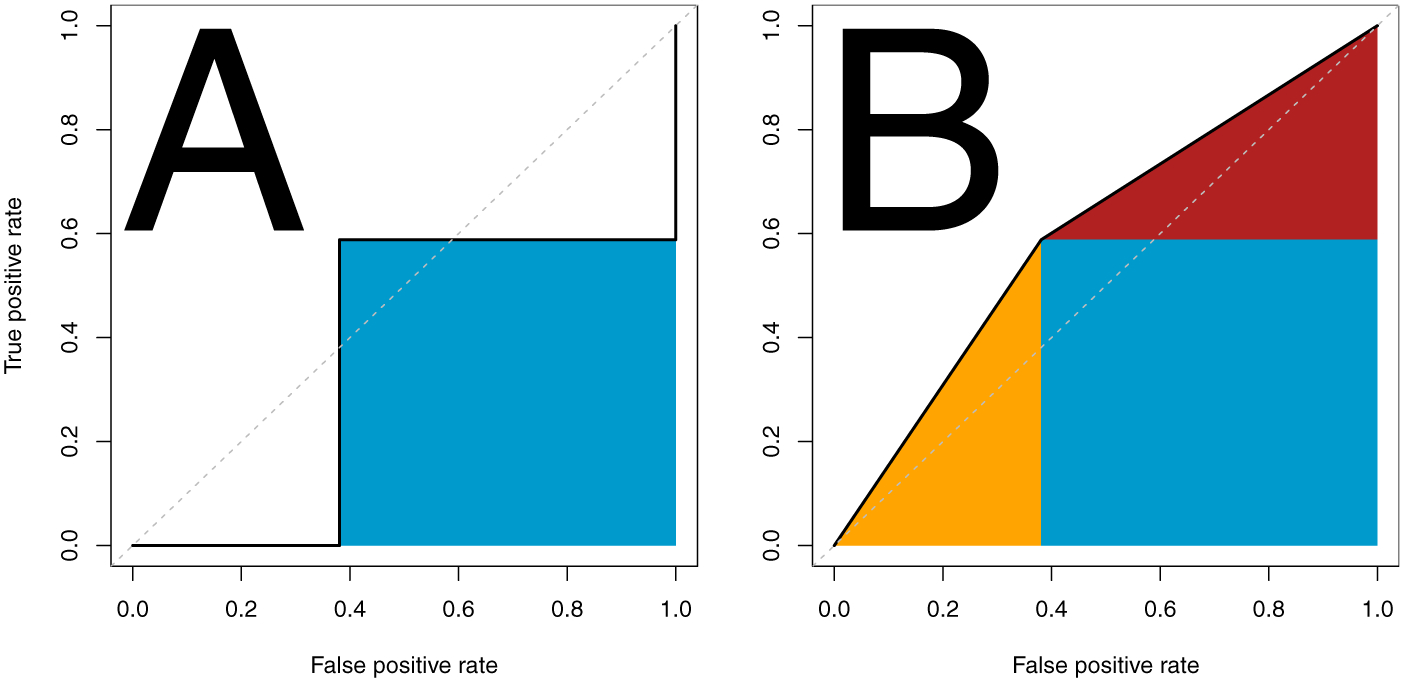
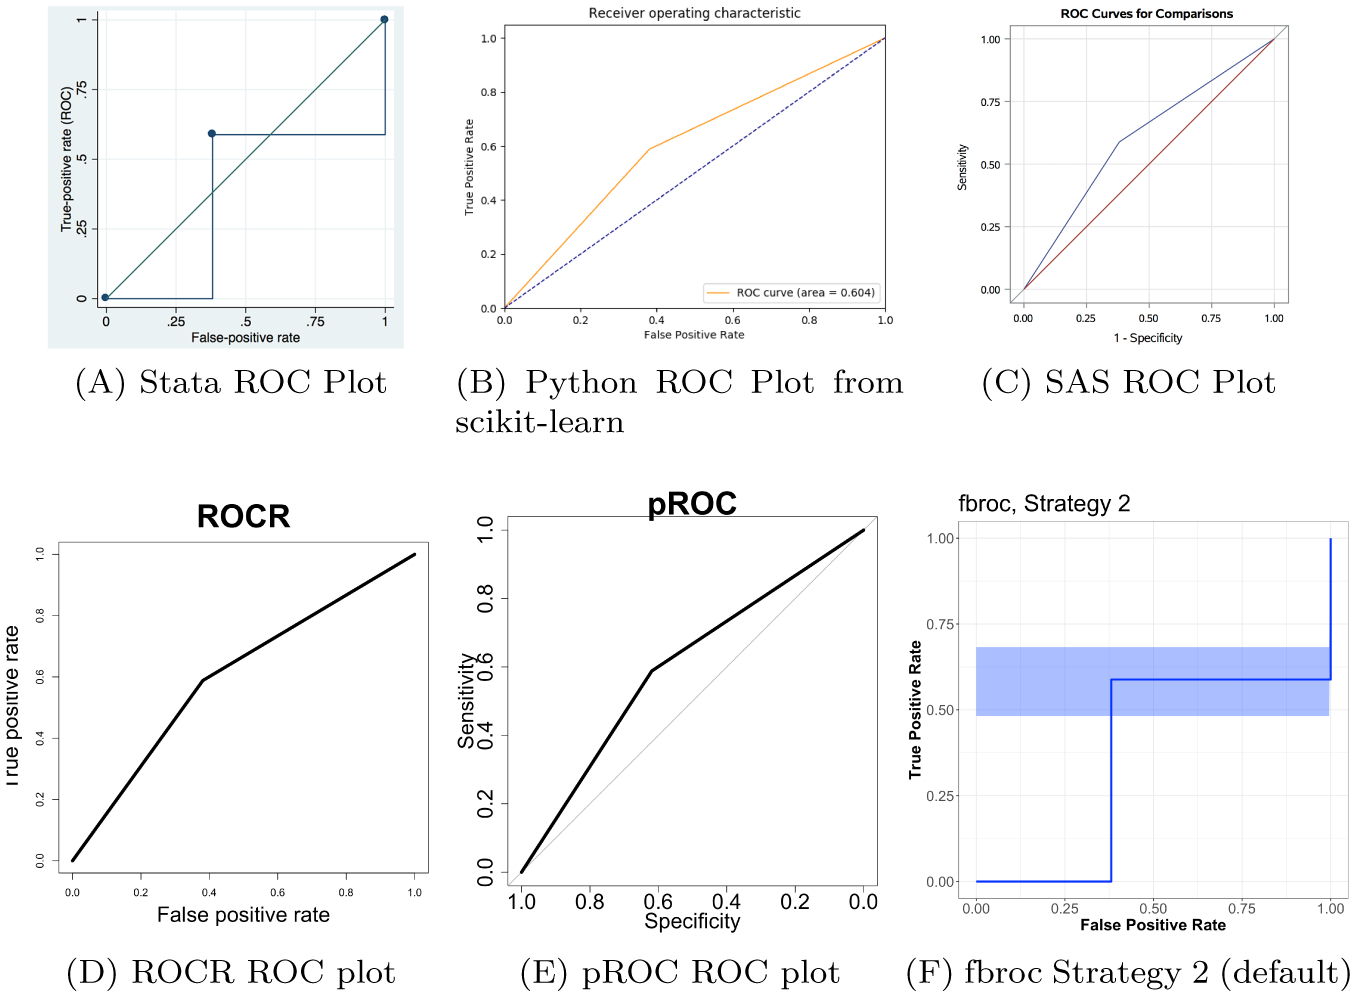
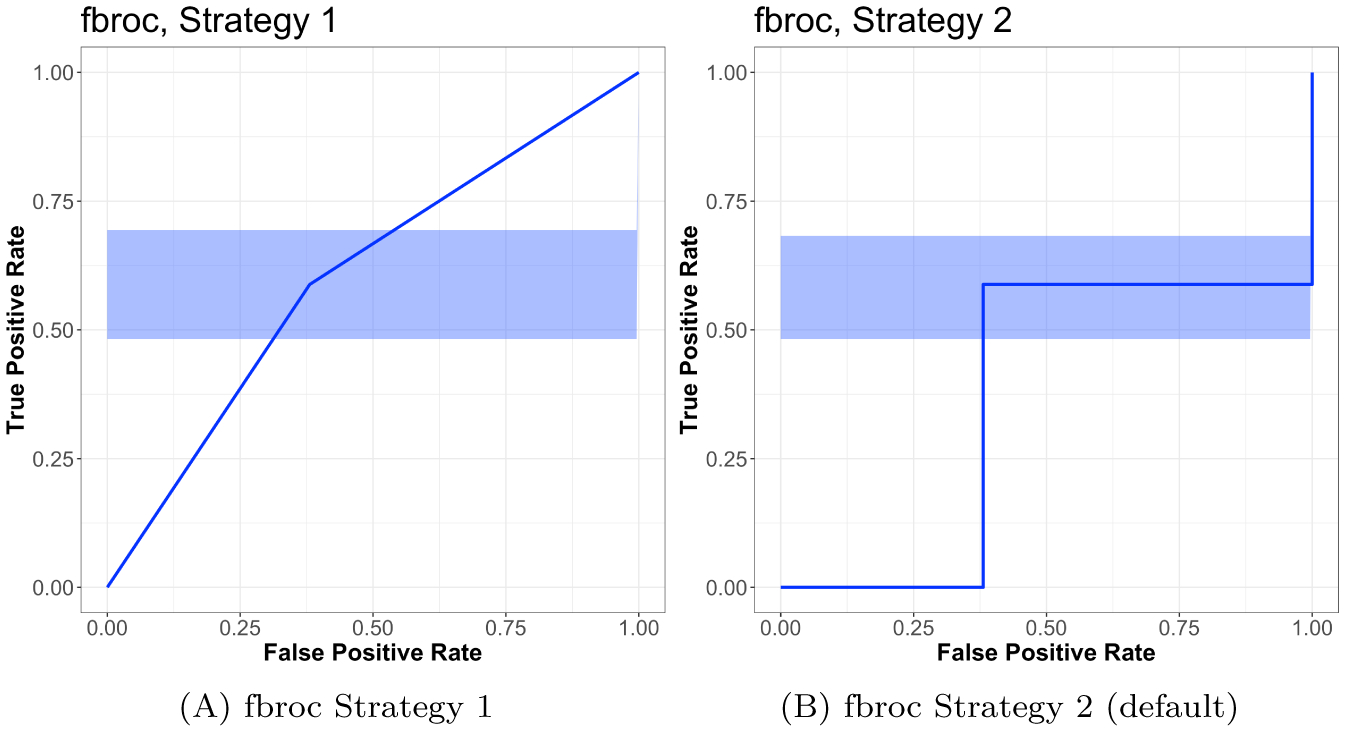
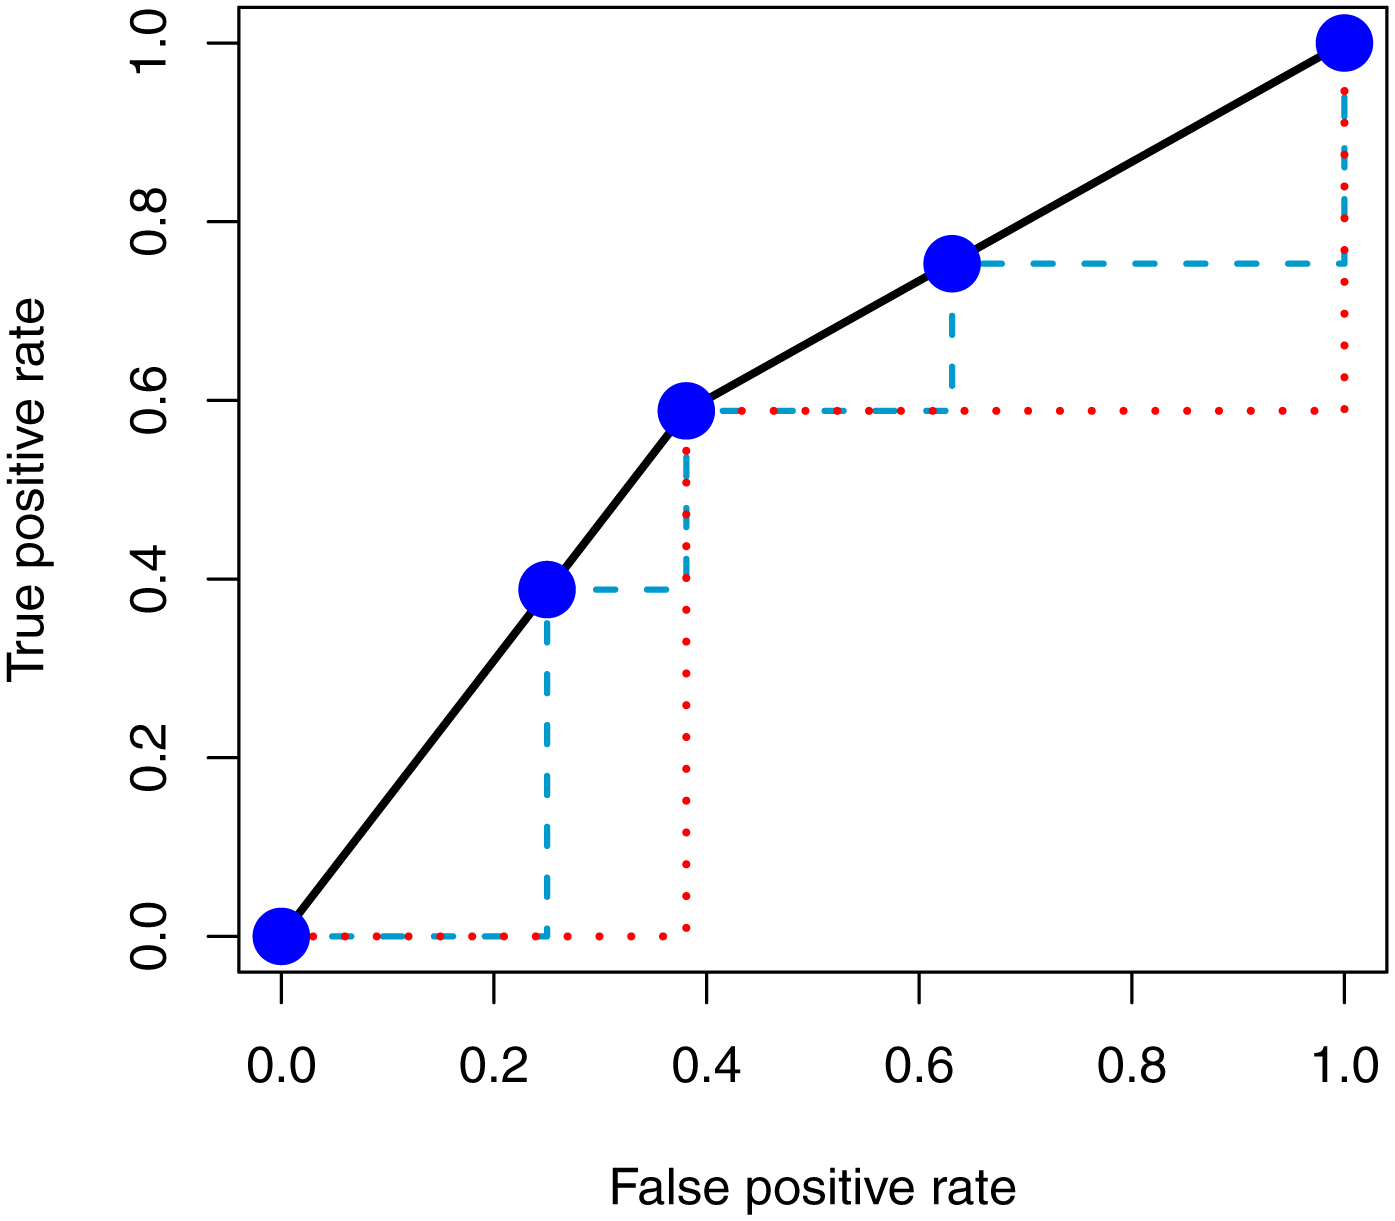
In analysis of binary outcomes, the receiver operator characteristic (ROC) curve is heavily used to show the performance of a model or algorithm. The ROC curve is informative about the performance over a series of thresholds and can be summarized by the area under the curve (AUC), a single number. When a predictor is categorical, the ROC curve has one less than number of categories as potential thresholds; when the predictor is binary there is only one threshold. As the AUC may be used in decision-making processes on determining the best model, it important to discuss how it agrees with the intuition from the ROC curve. We discuss how the interpolation of the curve between thresholds with binary predictors can largely change the AUC. Overall, we show using a linear interpolation from the ROC curve with binary predictors corresponds to the estimated AUC, which is most commonly done in software, which we believe can lead to misleading results. We compare R, Python, Stata, and SAS software implementations. We recommend using reporting the interpolation used and discuss the merit of using the step function interpolator, also referred to as the "pessimistic" approach by Fawcett (2006).

Keywords: R; area under the curve; auc; roc.


Figures

Fig. 1:
Fig. 1:
ROC curve of the data in the simple concrete example. Here we present a standard ROC curve, with the false positive rate or 1 – specificity on the x-axis and true positive rate or sensitivity on the y-axis. The dotted line represents the identity. The shaded area in panel represents the AUC for the strict definition. The additional shaded areas on panel B represent the AUC when accounting for ties.
Fig. 2:
Fig. 2:
Comparison of different ROC curves for different R packages, scikit-learn from Python, SAS, and Stata. Each line represents the ROC curve, which corresponds to an according area under the curve (AUC). The blue shading represents the confidence interval for the ROC curve in the fbroc package. Also, each software represents the curve as the false positive rate versus the true positive rate, though the pROC package calls it sensitivity and specificity (with flipped axes). Some put the identity line where others do not. Overall the difference of note as to whether the ROC curve is represented by a step or a linear function. Using the first tie strategy for ties (non-default, not shown) in fbroc gives the same confidence interval but an ROC curve using linear interpolation.
Fig. 3:
Fig. 3:
Comparison of different strategies for ties in the fbroc package. The blue shading represents the confidence interval for the ROC curve. Overall the difference of note as to whether the ROC curve is represented by a step or a linear function. Using the first tie strategy for ties (non-default) in fbroc gives the same confidence interval as the second strategy but an ROC curve using linear interpolation, which may give an inconsistent combination of estimate and confidence interval as fbroc reports the AUC corresponding to the linear interpolation.
Fig. 4:
Fig. 4:
ROC curve of a 4-level categorical variable compared to the binary predictor. Here we present the ROC curve of a categorical predictor (blue points) compared to that of the binary predictor (black line). We see that the ROC curve is identical if the linear inerpolation is used (accounting for ties). The red (dotted) and blue (dashed) lines show the ROC of the binary and categorical predictor, respectively, using the pessimistic approach. We believe this demonstrates that although there is more gradation in the categorical variable, using the standard approach provides the same AUC, though we believe these variables have different levels of information as the binary predictor cannot obtain values other than the 2 categories.

References

    1. Allaire JJ, Ushey Kevin, and Tang Yuan. 2018. reticulate: Interface to ‘Python’. https://github.com/rstudio/reticulate.
    1. Bamber Donald. 1975. “The Area Above the Ordinal Dominance Graph and the Area Below the Receiver Operating Characteristic Graph.” Journal of Mathematical Psychology 12 (4): 387–415.
    1. Blumberg Dana M, De Moraes Carlos Gustavo, Liebmann Jeffrey M, Garg Reena, Chen Cynthia, Theventhiran Alex, and Hood Donald C. 2016. “Technology and the Glaucoma Suspect.” Investigative Ophthalmology & Visual Science 57 (9): OCT80–OCT85. - PMC - PubMed
    1. Budwega Joris, Sprengerb Till, De Vere-Tyndalld Anthony, Hagenkordd Anne, Stippichd Christoph, and Bergera Christoph T. 2016. “Factors Associated with Significant MRI Findings in Medical Walk-in Patients with Acute Headache.” Swiss Med Wkly 146: w14349. - PubMed
    1. DeLong Elizabeth R, DeLong David M, and Clarke-Pearson Daniel L. 1988. “Comparing the Areas Under Two or More Correlated Receiver Operating Characteristic Curves: A Nonparametric Approach.” Biometrics, 837–45. - PubMed

LinkOut - more resources