. 2020 Nov 5:11:589386.
doi: 10.3389/fphys.2020.589386. eCollection 2020.

Modeling the Interactions Between Sodium Channels Provides Insight Into the Negative Dominance of Certain Channel Mutations

Affiliations

Modeling the Interactions Between Sodium Channels Provides Insight Into the Negative Dominance of Certain Channel Mutations

Echrak Hichri et al. Front Physiol. .

Abstract

Background: Nav1.5 cardiac Na+ channel mutations can cause arrhythmogenic syndromes. Some of these mutations exert a dominant negative effect on wild-type channels. Recent studies showed that Na+ channels can dimerize, allowing coupled gating. This leads to the hypothesis that allosteric interactions between Na+ channels modulate their function and that these interactions may contribute to the negative dominance of certain mutations.

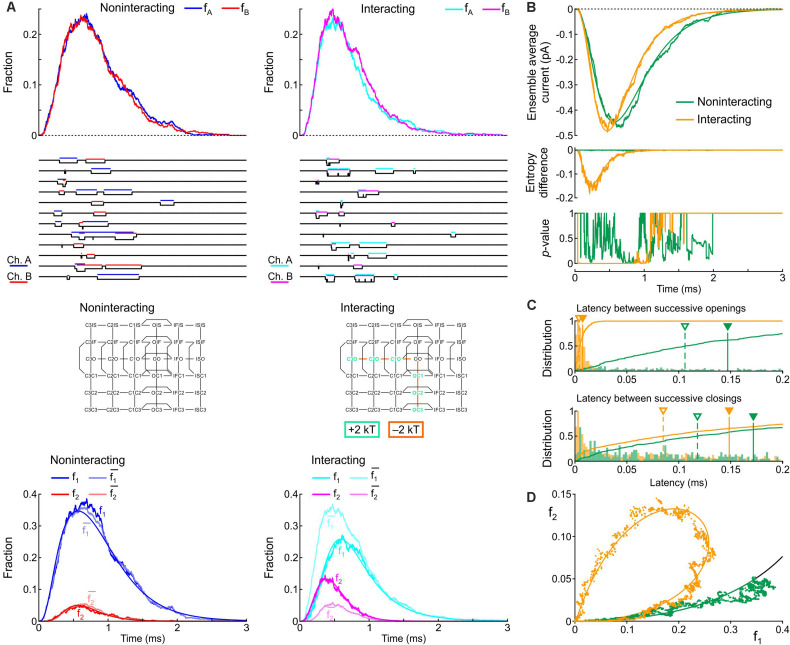
Methods: To investigate how allosteric interactions affect microscopic and macroscopic channel function, we developed a modeling paradigm in which Markovian models of two channels are combined. Allosteric interactions are incorporated by modifying the free energies of the composite states and/or barriers between states.

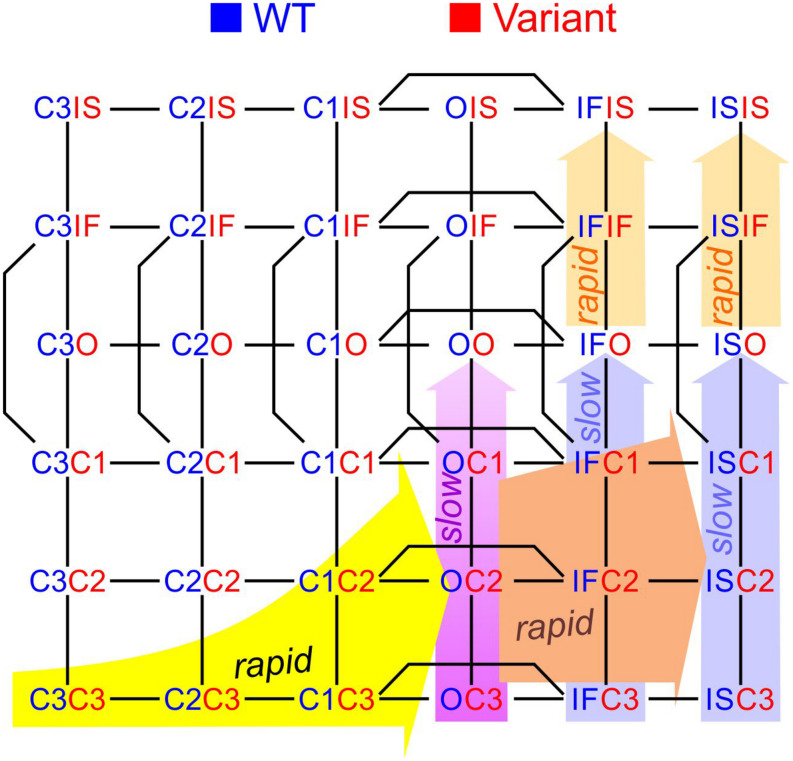
Results: Simulations using two generic 2-state models (C-O, closed-open) revealed that increasing the free energy of the composite states CO/OC leads to coupled gating. Simulations using two 3-state models (closed-open-inactivated) revealed that coupled closings must also involve interactions between further composite states. Using two 6-state cardiac Na+ channel models, we replicated previous experimental results mainly by increasing the energies of the CO/OC states and lowering the energy barriers between the CO/OC and the CO/OO states. The channel model was then modified to simulate a negative dominant mutation (Nav1.5 p.L325R). Simulations of homodimers and heterodimers in the presence and absence of interactions showed that the interactions with the variant channel impair the opening of the wild-type channel and thus contribute to negative dominance.

Conclusion: Our new modeling framework recapitulates qualitatively previous experimental observations and helps identifying possible interaction mechanisms between ion channels.

Keywords: Markov models; allosteric interactions; cardiac electrophysiology; computer modeling; sodium channels; sodium current; statistical mechanics.


Figures

FIGURE 1
FIGURE 1
Modeling a pair of channels. (A) Composition of two Markovian channel models. Top left: Two generic 2-state models. Top right: Two generic 3-state models. Bottom: Two instances of the Na+ channel model of Clancy and Rudy (1999). The symbol “□” denotes the Cartesian graph product. Note the symmetries about the diagonals (dashed lines). (B) Cartoon of a channel dimer (viewed from an axis perpendicular to the membrane). a: direct contact; b: linked by two 14-3-3 proteins; c: linked by a 14-3-3 dimer. Because proteins are chiral, a symmetry is expected for the binding pattern and a rotation by 180° is expected to leave the entire structure unchanged. In this situation, identical channels are indistinguishable. (C) Cartoon illustrating how interaction between channels may change the free energy of certain combinations of states. In this example, opening of one channel stretches the 14-3-3 linker (represented as a green spring) and the potential energy accumulated in the stretched linker is added to the free energy of the composite CO and OC states.
FIGURE 2
FIGURE 2
Analysis of single-channel data published by Clatot et al., 2017, (Supplementary Figure S8), licensed under a Creative Commons Attribution 4.0 International License (https://creativecommons.org/licenses/by/4.0/). In patch clamp recordings from wild-type cardiac Na+ channel pairs submitted to an activation step to −20 mV, Clatot et al. (2017) counted at every sampling time the number of sweeps with one open channel (L1) and two open channels (L2). L1 and L2 were extracted from the vectorized figure. Dividing L1 and L2 by the number of sweeps yields f1 and f2, the fractions of sweeps with one or two open channels at a given time. (A) Analysis of experimental data in the absence (left) vs. presence (right) of difopein. Top row: Raw fractions f1 and f2 (solid cyan and magenta lines) and fractions f1¯ and f2¯ that would be expected in the absence of interaction (Eqs. 7 and 8, dotted cyan and magenta lines). Second row: Ensemble average currents computed using Eqs. 12 and 13 (assuming a single-channel current ich of −1 pA). Third row: p-value (as a function of time) of the χ2 test (green) and Fisher’s exact test (orange) for independence. Intervals during which p < 0.01 are highlighted in gray. Fourth row: Entropy difference ΔS computed using Eqs. 9–11. (B) Plots of f2 vs. f1 (dots) for experiments without (left) and with (right) difopein. The curved arrows indicate the direction of the trajectories. The black curves represent the expected relationship in the absence of interactions (f2¯ vs. f1¯).
FIGURE 3
FIGURE 3
Simulated gating behavior of a pair of 2-state channels (C: closed ↔ O: open; opening rate: 1 ms–1; closing rate: 2 ms–1) in the absence of interaction and upon raising the energy of the composite CO and OC states by 2 kT. As initial condition (t = 0), the channels were all put into the C state. (A) Top row: Fractions fA and fB of the individual channels A and B being open in the absence (blue/red, left) and presence (cyan/magenta, right) of the interaction, reconstructed from n = 1000 simulated sweeps. Second row: Simulated sweeps. The simulated current is represented in black; the intervals during which the channels were open are marked by colored overbars. Third row: Corresponding graphs of the composite Markovian models of non-interacting and interacting channels (numbers correspond to rates in ms–1; colored arrows indicate the rates accelerated by the interaction). Bottom row: Fractions f1 and f2 of finding one or two channels open for non-interacting and interacting channels (color legend in the inset), and expected fractions without interaction (lighter hues) computed from Eqs. 7 and 8. Continuous lines were computed using deterministic simulations. (B) Ensemble average current (top), entropy difference (middle) and p-value of Fisher’s exact test (bottom) for the non-interacting (green) and interacting (orange) channel pair. The continuous lines were generated by deterministic simulations. (C) Histograms of the latency between successive openings (top) and closings (bottom), and cumulative histograms of this latency (solid curves) for the non-interacting (green) and interacting (orange) channel pair. Filled triangles and solid vertical lines indicate means; open triangles and dashed vertical lines indicate median values. (D) f2 vs. f1 plots without (green) and with channel interaction (orange). The continuous curves were obtained from deterministic simulations. The black curve is the theoretical expectation for independent channels.
FIGURE 4
FIGURE 4
Sensitivity analysis for the pair of 2-state channels (C: closed ↔ O: open; opening rate: 2 ms–1; closing rate: 1 ms–1). The free energy of every composite state and barrier (labels on the left) was individually varied by an amount going from –2 kT to +2 kT. Then, the influence of this variation was quantified by the regression slope of the natural logarithm of observable parameters (labels on the top) and the r2 value of this regression (scale rectangle in the top left corner). Positive correlations are shown as green bars above the horizontal lines. Negative correlations are shown as red bars below the horizontal lines. Color intensity corresponds to the slope and color saturation to r2. The observable parameters were obtained from deterministic simulations, except the latencies, which were obtained from 1000 stochastic simulations (sweeps). As initial condition, all the channel pairs were placed in the CC state. For this analysis, p1 and p2 from the deterministic simulations were used instead of f1 and f2 obtained from the n = 1000 sweeps. While this figure summarizes the results using the regression slope and r2, explicit plots of the natural logarithms of each marker vs. the energy change for every compound state and barrier can be generated by the MATLAB code deposited on Zenodo.
FIGURE 5
FIGURE 5
Simulated gating behavior of a pair of 3-state channels (C: closed ↔ O: open ↔ I: inactivated) in the absence of interaction and upon raising the energy of the composite CO and OC states by 2 kT. Same protocol, analysis and panel layout as in Figure 3.
FIGURE 6
FIGURE 6
Sensitivity analysis for the pair of 2-state channels used in Figure 5 (linear COI model, C: closed ↔ O: open ↔ I: inactivated). Same protocol, analysis and layout as in Figure 4. The rate constants for the non-interacting single channels are shown in Figure 5A. Additional observable parameters (labels on top) are: peak current, maximal inactivation slope, time constant of inactivation, and time of peak p2 (from deterministic simulations).
FIGURE 7
FIGURE 7
Sensitivity analysis for a pair of 6-state Clancy–Rudy model channels (Clancy and Rudy, 1999) for a voltage step to -20 mV. Same analysis and layout as in Figure 6. As initial condition, all channels were placed in the C3 state. For the simulations, the rate constants at -20 mV were used. Simulations were run for 5 ms for this analysis.
FIGURE 8
FIGURE 8
Simulated gating behavior of a pair of 6-state Clancy–Rudy model channels (Clancy and Rudy, 1999) in the absence of interaction and upon raising the energies of the composite C3O, C2O and C1O states by 2 kT, and lowering the energies of the C3O-C2O, C2O-C1O, and C1O-OO barriers by 2 kT (Interaction I; color-coded diagram). Same analysis and panel layout as in Figure 5. As initial condition, all channels were placed in the C3 state. For the simulations, the rate constants at -20 mV were used.
FIGURE 9
FIGURE 9
Simulated gating behavior of a pair of 6-state Clancy–Rudy model channels (Clancy and Rudy, 1999) in the absence of interaction and upon raising the energies of the composite C3O, C2O and C1O states by 2 kT, lowering the energy of the C1O-OO barrier by 2 kT, and lowering the energy of the C1O-C1IF barrier by 1 kT (Interaction II; color-coded diagram). Same protocol, analysis and panel layout as in Figure 8.
FIGURE 10
FIGURE 10
Reconstructed peak ensemble average current vs. voltage relationships (I-V curves, top row), normalized conductance (second row), time to peak (third row), and inactivation time constant (bottom row). (A) In the presence of Interaction I (orange) vs. no interaction (green). (B) In the presence of Interaction II (orange) vs. no interaction (green). The data were obtained using deterministic simulations.
FIGURE 11
FIGURE 11
Model of the variant p.L325R channel. (A) Diagram showing the modifications of the rate constants of the Clancy–Rudy model (color legend). (B) Peak ensemble average current (I–V curve), time to peak, normalized conductance (activation curve), and inactivation time constant vs. potential for the p.L325R channel (red) vs. the WT channel (blue).
FIGURE 12
FIGURE 12
Simulated gating behavior of a channel pair consisting of a WT Na+ channel (nominal Clancy–Rudy model) and a p.L325R variant Na+ channel without interaction (A) and in the presence of Interaction I (B) and Interaction II (C). Stochastic simulations (n = 1000 sweeps) were conducted for a voltage step to -20 mV. As initial condition, all channels were placed in the C3 state. First row: Fractions fWT and fVariant of the individual channels being open in the n sweeps. Second row: Simulated sweeps. The simulated current is represented in black; the intervals during which the channels were open are marked by colored overbars. Third row: Ensemble average current (the same single-channel conductance was assumed for both channels). Fourth row: Fractions of sweeps f1 and f2 with one channel (irrespective of which one) or two channels open. Smooth curves were obtained from deterministic simulations.
FIGURE 13
FIGURE 13
Simulated sets of Na+ currents, current-voltage relationships and activation curves that would be obtained by an activation protocol for a WT/WT homodimer (blue), a WT/p.L325R variant heterodimer (magenta) and a p.L325R/p.L325R homodimer (red). (A) Without interaction. (B) With Interaction I. (C) With Interaction II. Deterministic simulations were conducted for voltage steps to values from −70 mV to 50 mV in 5 mV increments. As initial condition, all channels were placed in the C3 state. Top: Current traces. Middle: Peak current-voltage relationships. Bottom: Activation curves.
FIGURE 14
FIGURE 14
Working model to explain how interactions between a wild-type (blue state labels) and a variant p.L325R Na+ channel (red state labels) decrease the Na+ current and contribute to the negative dominance of the variant. See text for description.

Similar articles

Cited by

References

    1. Asfaw T. N., Bondarenko V. E. (2019). A mathematical model of the human cardiac Na+ channel. J. Membr. Biol. 252 77–103. 10.1007/s00232-018-00058-x - DOI - PubMed
    1. Balbi P., Massobrio P., Hellgren Kotaleski J. (2017). A single Markov-type kinetic model accounting for the macroscopic currents of all human voltage-gated sodium channel isoforms. PLoS Comput. Biol. 13:e1005737. 10.1371/journal.pcbi.1005737 - DOI - PMC - PubMed
    1. Barnett M. W., Larkman P. M. (2007). The action potential. Pract. Neurol. 7 192–197. - PubMed
    1. Bondarenko V. E., Szigeti G. P., Bett G. C., Kim S. J., Rasmusson R. L. (2004). Computer model of action potential of mouse ventricular myocytes. Am. J. Physiol. Heart Circ. Physiol. 287 H1378–H1403. - PubMed
    1. Chung S. H., Kennedy R. A. (1996). Coupled Markov chain model: characterization of membrane channel currents with multiple conductance sublevels as partially coupled elementary pores. Math Biosci. 133 111–137. 10.1016/0025-5564(95)00084-4 - DOI - PubMed