Comprehensive Proteomic Profiling of Urinary Exosomes and Identification of Potential Non-invasive Early Biomarkers of Alzheimer's Disease in 5XFAD Mouse Model
- PMID: 33250918
- PMCID: PMC7674956
- DOI: 10.3389/fgene.2020.565479
Comprehensive Proteomic Profiling of Urinary Exosomes and Identification of Potential Non-invasive Early Biomarkers of Alzheimer's Disease in 5XFAD Mouse Model
Abstract
Background: Alzheimer's disease (AD) is an incurable neurodegenerative disease characterized by irreversible progressive cognitive deficits. Identification of candidate biomarkers, before amyloid-β-plaque deposition occurs, is therefore of great importance for early intervention of AD.
Objective: To investigate the potential non-invasive early biomarkers of AD in 5XFAD mouse model, we investigate the proteome of urinary exosomes present in 1-month-old (before amyloid-β accumulation) 5XFAD mouse models and their littermate controls. Another two groups of 2 and 6 months-old urinary samples were collected for monitoring the dynamic change of target proteins during AD progression.
Methods: Proteomic, bioinformatics analysis, multiple reaction monitoring (MRM), western blotting (WB) or ELISA were performed for analyzing these urinary exosomes.
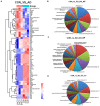
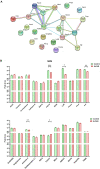
Results: A total of 316 proteins including 44 brain cell markers were identified using liquid chromatography tandem mass spectrometry. Importantly, 18 proteins were unique to the 5XFAD group. Eighty-eight proteins including 11 brain cell markers were differentially expressed. Twenty-two proteins were selected to be verified by WB. Furthermore, based on an independent set of 12 urinary exosomes samples, five in these proteins were further confirmed significant difference. Notably, Annexin 2 and Clusterin displayed significant decreased in AD model during the course detected by ELISA. AOAH, Clusterin, and Ly86 are also brain cell markers that were first reported differential expression in urinary exosomes of AD model.
Conclusion: Our data demonstrated that some urinary exosome proteins, especially Annexin 2 and Clusterin, as nanometer-sized particles, enable detection of differences before amyloid-β-plaque deposition in 5XFAD mouse model, which may present an ideal non-invasive source of biomarkers for prevention of AD.
Keywords: 5XFAD mouse model; Alzheimer’s disease; biomarkers; early diagnosis; urinary exosome proteome.
Copyright © 2020 Song, Xu, Zhang, Zhou, Zhang, Han, Li, Yu, Qu, Zhao and Qin.
Figures


Similar articles
-
Microarray microRNA profiling of urinary exosomes in a 5XFAD mouse model of Alzheimer's disease.Animal Model Exp Med. 2021 Jun 9;4(3):233-242. doi: 10.1002/ame2.12175. eCollection 2021 Sep. Animal Model Exp Med. 2021. PMID: 34557649 Free PMC article.
-
Early Candidate Urine Biomarkers for Detecting Alzheimer's Disease Before Amyloid-β Plaque Deposition in an APP (swe)/PSEN1dE9 Transgenic Mouse Model.J Alzheimers Dis. 2018;66(2):613-637. doi: 10.3233/JAD-180412. J Alzheimers Dis. 2018. PMID: 30320578
-
Deep proteome profiling of the hippocampus in the 5XFAD mouse model reveals biological process alterations and a novel biomarker of Alzheimer's disease.Exp Mol Med. 2019 Nov 15;51(11):1-17. doi: 10.1038/s12276-019-0326-z. Exp Mol Med. 2019. PMID: 31727875 Free PMC article.
-
Plasma neuronal exosomes serve as biomarkers of cognitive impairment in HIV infection and Alzheimer's disease.J Neurovirol. 2019 Oct;25(5):702-709. doi: 10.1007/s13365-018-0695-4. Epub 2019 Jan 4. J Neurovirol. 2019. PMID: 30610738 Free PMC article. Review.
-
Unveiling the Molecular Footprint: Proteome-Based Biomarkers for Alzheimer's Disease.Proteomes. 2023 Oct 16;11(4):33. doi: 10.3390/proteomes11040033. Proteomes. 2023. PMID: 37873875 Free PMC article. Review.
Cited by
-
Microarray microRNA profiling of urinary exosomes in a 5XFAD mouse model of Alzheimer's disease.Animal Model Exp Med. 2021 Jun 9;4(3):233-242. doi: 10.1002/ame2.12175. eCollection 2021 Sep. Animal Model Exp Med. 2021. PMID: 34557649 Free PMC article.
-
Is liquid biopsy mature enough for the diagnosis of Alzheimer's disease?Front Aging Neurosci. 2022 Aug 5;14:977999. doi: 10.3389/fnagi.2022.977999. eCollection 2022. Front Aging Neurosci. 2022. PMID: 35992602 Free PMC article. Review.
-
Exploring Exosome-Based Approaches for Early Diagnosis and Treatment of Neurodegenerative Diseases.Mol Neurobiol. 2025 May 10. doi: 10.1007/s12035-025-05026-w. Online ahead of print. Mol Neurobiol. 2025. PMID: 40347374 Review.
-
Stable expression of a truncated TLX variant drives differentiation of induced pluripotent stem cells into self-renewing neural stem cells for production of extracellular vesicles.Stem Cell Res Ther. 2022 Sep 2;13(1):436. doi: 10.1186/s13287-022-03131-4. Stem Cell Res Ther. 2022. PMID: 36056423 Free PMC article.
-
Endoplasmic reticulum stress increases exosome biogenesis and packaging relevant to sperm maturation in response to oxidative stress in obese mice.Reprod Biol Endocrinol. 2022 Nov 21;20(1):161. doi: 10.1186/s12958-022-01031-z. Reprod Biol Endocrinol. 2022. PMID: 36411474 Free PMC article.
References
-
- Bush A. I. (2013). The metal theory of Alzheimer’s disease. J. Alzheimer Dis. 33 S277–S281. - PubMed
LinkOut - more resources
Full Text Sources
Molecular Biology Databases

