

A randomized trial of vorinostat with treatment interruption after initiating antiretroviral therapy during acute HIV-1 infection
- PMID: 33251022
- PMCID: PMC7646672
- DOI: 10.1016/j.jve.2020.100004
A randomized trial of vorinostat with treatment interruption after initiating antiretroviral therapy during acute HIV-1 infection
Abstract
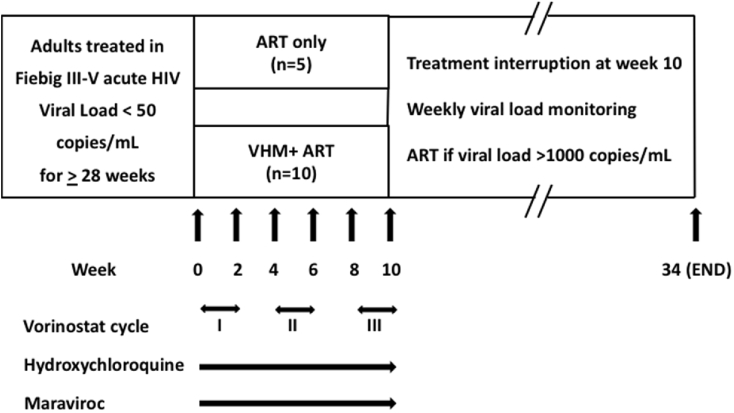
Objective and design: A randomized, open-label pilot study in individuals treated with antiretroviral therapy (ART) since acute HIV infection (AHI) with a regimen including a histone deacetylase inhibitor to induce HIV from latency and control HIV replication during subsequent treatment interruption (TI).
Methods: Fifteen participants who initiated ART at AHI were randomized to vorinostat/hydroxychloroquine/maraviroc (VHM) plus ART (n = 10) or ART alone (n = 5). The VHM arm received three 14-day vorinostat cycles within 10 weeks before TI. ART was resumed for plasma viral load (VL) > 1,000 HIV RNA copies/mL. Primary outcome was proportion of participants on VHM + ART versus ART only with VL < 50 copies/mL for 24 weeks after TI.
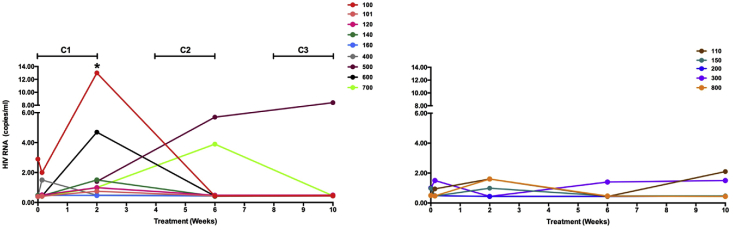
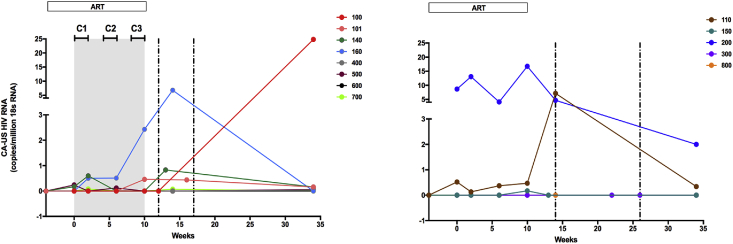
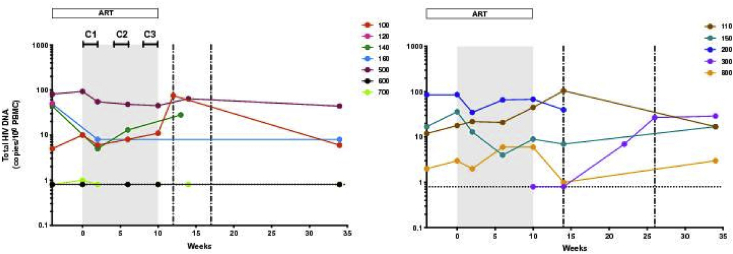
Results: Fifteen participants on ART (median: 178 weeks: range 79-295) enrolled. Two on VHM + ART experienced serious adverse events. Fourteen participants underwent TI; all experienced VL rebound with no difference in time between arms: VHM + ART (n = 9) median: 4 weeks and ART only (n = 5) median: 5 weeks. VHM induced a 2.2-fold increase in VL (p = 0.008) by single-copy HIV RNA assay after the first cycle. Neopterin levels increased significantly following the first two cycles. After VHM treatment, the frequencies of peripheral blood mononuclear cells harboring total HIV DNA and cell-associated RNA were unchanged. All participants achieved VL suppression following ART re-initiation.
Conclusions: Administration of VHM increased HIV VL in plasma, but this was not sustained. VHM did not impact time to viral rebound following TI and had no impact on the size of the HIV reservoir, suggesting that HIV reservoir elimination will require alternative treatment strategies.
Keywords: Acute HIV infection; HIV remission; Latency reversal; Maraviroc; Vorinostat.
© 2020 The Author(s).
Conflict of interest statement
NC has served on the scientific advisory board of Theravectys. JA has participated in advisory meetings for ViiV Healthcare, Merck, AbbVie, Gilead, and Roche. All other authors declare no competing interests.
Figures
References
-
- Finzi D., Hermankova M., Pierson T. Identification of a reservoir for HIV-1 in patients on highly active antiretroviral therapy. Science. 1997;278:1295–1300. - PubMed
-
- Hamer D.H. Can HIV be Cured? Mechanisms of HIV persistence and strategies to combat it. Curr. HIV Res. 2004;2:99–111. - PubMed
-
- Falkenberg K.J., Johnstone R.W. Histone deacetylases and their inhibitors in cancer, neurological diseases and immune disorders. Nat. Rev. Drug Discov. 2014;13:673–691. - PubMed
Grants and funding
LinkOut - more resources
Full Text Sources
