CEP164 Deficiency Causes Hyperproliferation of Pancreatic Cancer Cells
- PMID: 33251215
- PMCID: PMC7674857
- DOI: 10.3389/fcell.2020.587691
CEP164 Deficiency Causes Hyperproliferation of Pancreatic Cancer Cells
Abstract
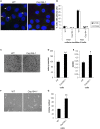
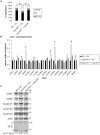
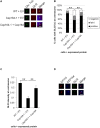
Primary cilia are hair-like projections that protrude from most mammalian cells and mediate various extracellular signaling pathways. Pancreatic ductal adenocarcinoma (PDAC) cells are known to lose their primary cilia, but the relevance of this phenomenon remains unclear. In this study, we generated PDAC-originated Panc1 cells devoid of primary cilia by mutating a centriolar protein, centrosomal protein 164 (CEP164), which is required for ciliogenesis. CEP164 depletion enhanced the clonogenicity of Panc1 cells, along with chemically induced elimination of primary cilia, suggesting that a lack of these organelles promotes PDAC cells proliferation. In addition, the loss of CEP164 altered the cell cycle progression irrespective of absence of primary cilia. We found that CEP164 was co-localized with the GLI2 transcription factor at the mother centriole and controlled its activation, thus inducing Cyclin D-CDK6 expression. Furthermore, CEP164-mutated Panc1 cells were significantly tolerant to KRAS depletion-dependent growth inhibition. This study suggests that CEP164 deficiency is advantageous for PDAC cells proliferation due to not only lack of ciliation but also cilia-independent GLI2-Cyclin D/CDK6 activation, and that CEP164 is a potential therapeutic target for PDAC.
Keywords: CEP164; PDAC; hedgehog; primary cilia; proliferation.
Copyright © 2020 Kobayashi, Tanaka, Mashima, Shoda, Tokuda and Itoh.
Figures


Similar articles
-
Molecular mechanisms underlying the role of the centriolar CEP164-TTBK2 complex in ciliopathies.Structure. 2022 Jan 6;30(1):114-128.e9. doi: 10.1016/j.str.2021.08.007. Epub 2021 Sep 8. Structure. 2022. PMID: 34499853 Free PMC article.
-
CEP164-GLI2 association ensures the hedgehog signaling in pancreatic cancer cells.Biochem Biophys Res Commun. 2023 Jul 23;666:179-185. doi: 10.1016/j.bbrc.2023.05.031. Epub 2023 May 10. Biochem Biophys Res Commun. 2023. PMID: 37199136
-
Binding to Cep164, but not EB1, is essential for centriolar localization of TTBK2 and its function in ciliogenesis.Genes Cells. 2014 Dec;19(12):927-40. doi: 10.1111/gtc.12191. Epub 2014 Oct 9. Genes Cells. 2014. PMID: 25297623
-
CEP164-null cells generated by genome editing show a ciliation defect with intact DNA repair capacity.J Cell Sci. 2016 May 1;129(9):1769-74. doi: 10.1242/jcs.186221. Epub 2016 Mar 10. J Cell Sci. 2016. PMID: 26966185
-
Disruption of distal appendage protein CEP164 causes skeletal malformation in mice.Biochem Biophys Res Commun. 2024 Dec 31;741:151063. doi: 10.1016/j.bbrc.2024.151063. Epub 2024 Nov 26. Biochem Biophys Res Commun. 2024. PMID: 39612644
Cited by
-
Brain microvascular endothelial cells possess a second cilium that arises from the daughter centriole.Front Mol Biosci. 2023 Nov 6;10:1250016. doi: 10.3389/fmolb.2023.1250016. eCollection 2023. Front Mol Biosci. 2023. PMID: 38028541 Free PMC article.
-
Molecular mechanisms underlying the role of the centriolar CEP164-TTBK2 complex in ciliopathies.Structure. 2022 Jan 6;30(1):114-128.e9. doi: 10.1016/j.str.2021.08.007. Epub 2021 Sep 8. Structure. 2022. PMID: 34499853 Free PMC article.
-
A type of pancreatic cancer cells form cell clusters from a solitary condition in a primary ciliogenesis-dependent manner.Med Mol Morphol. 2025 Sep;58(3):213-226. doi: 10.1007/s00795-025-00428-0. Epub 2025 Mar 12. Med Mol Morphol. 2025. PMID: 40069423 Free PMC article.
-
Distinctive interactomes of RNA polymerase II phosphorylation during different stages of transcription.iScience. 2023 Aug 9;26(9):107581. doi: 10.1016/j.isci.2023.107581. eCollection 2023 Sep 15. iScience. 2023. PMID: 37664589 Free PMC article.
-
KIF24 depletion induces clustering of supernumerary centrosomes in PDAC cells.Life Sci Alliance. 2022 Jul 8;5(11):e202201470. doi: 10.26508/lsa.202201470. Print 2022 Nov. Life Sci Alliance. 2022. PMID: 35803737 Free PMC article.
References
LinkOut - more resources
Full Text Sources
Miscellaneous

