

Imaging-based internal body temperature measurements: The journal Temperature toolbox
- PMID: 33251282
- PMCID: PMC7678923
- DOI: 10.1080/23328940.2020.1769006
Imaging-based internal body temperature measurements: The journal Temperature toolbox
Abstract
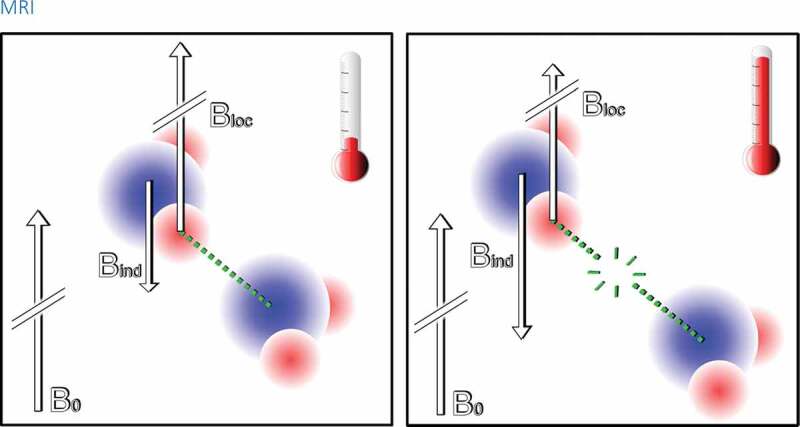
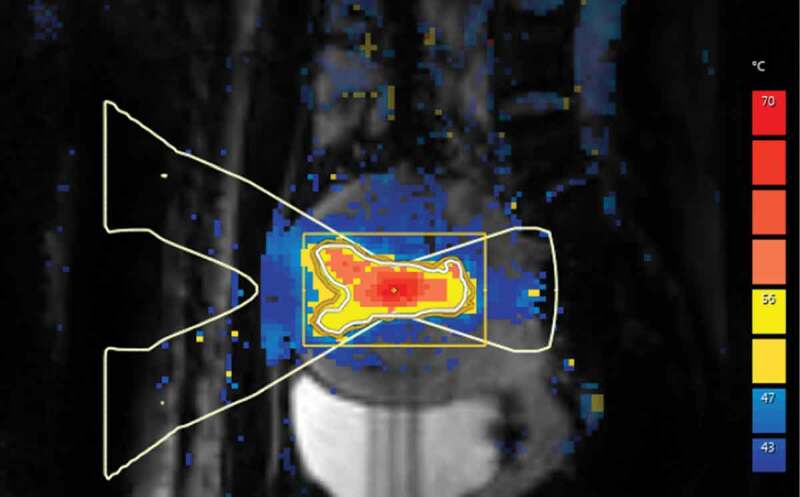
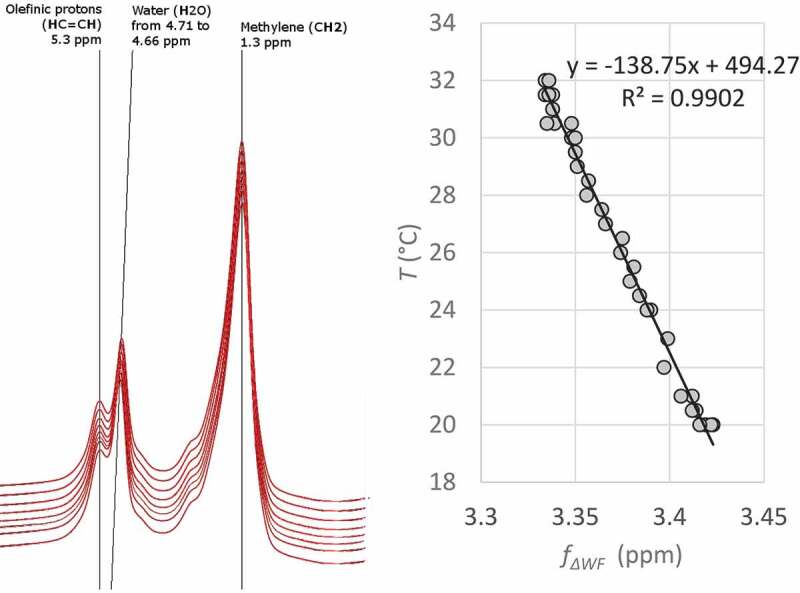
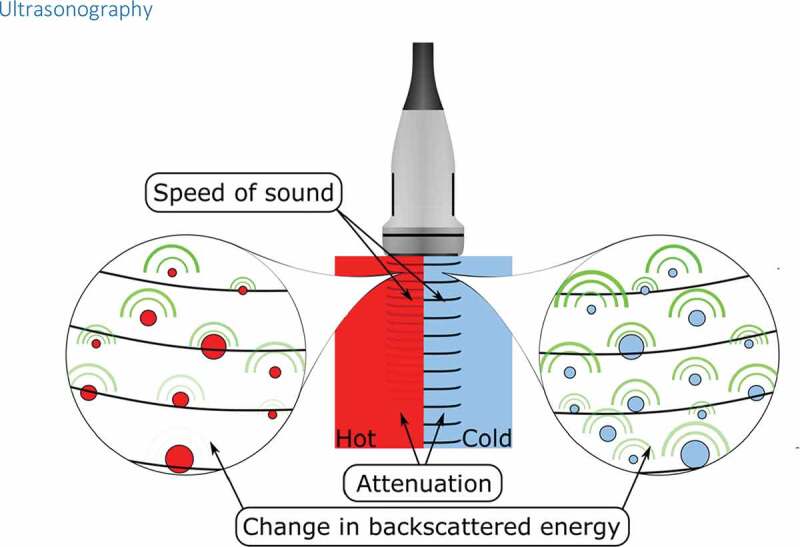
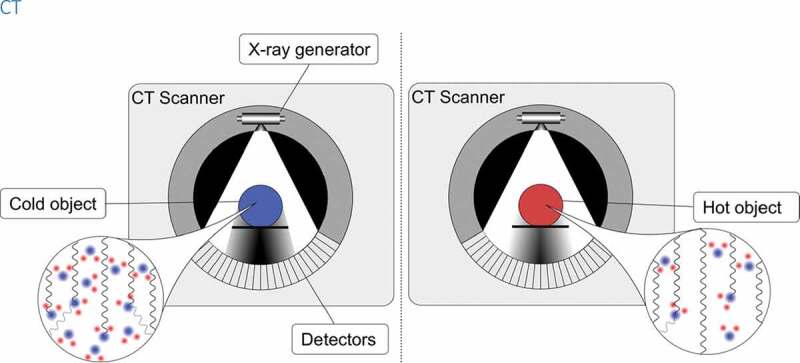
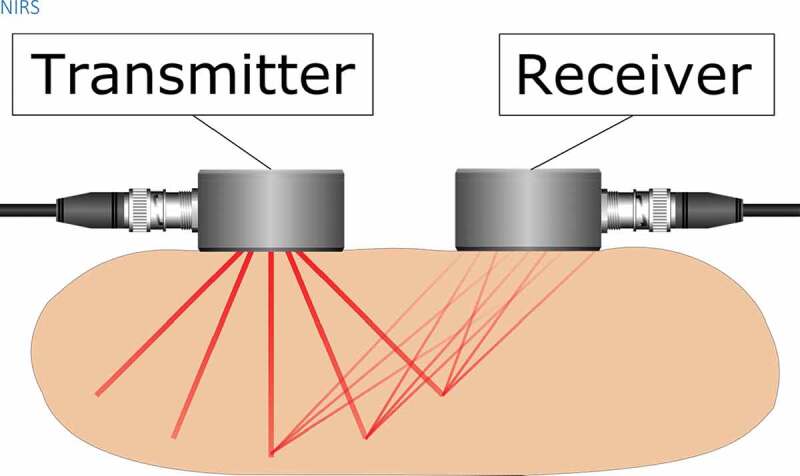
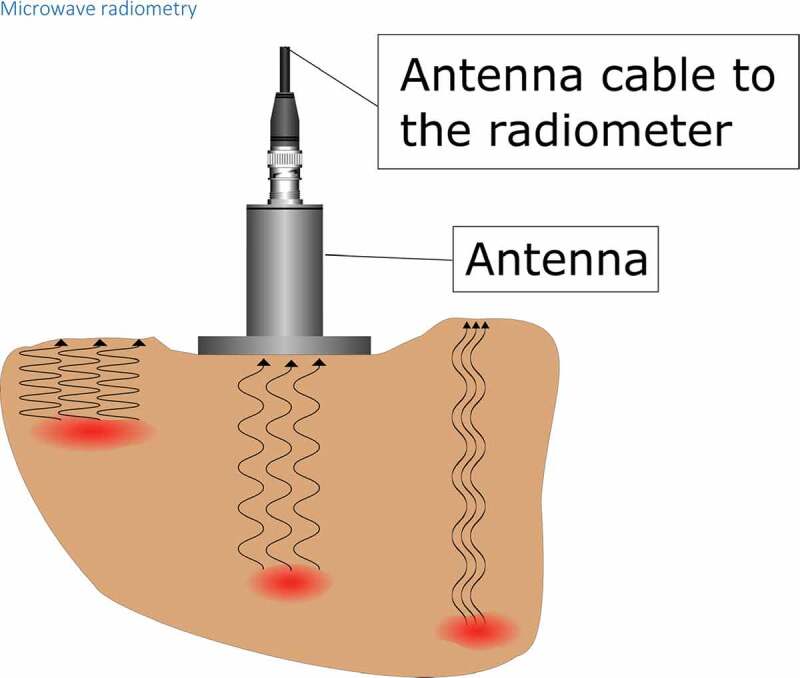
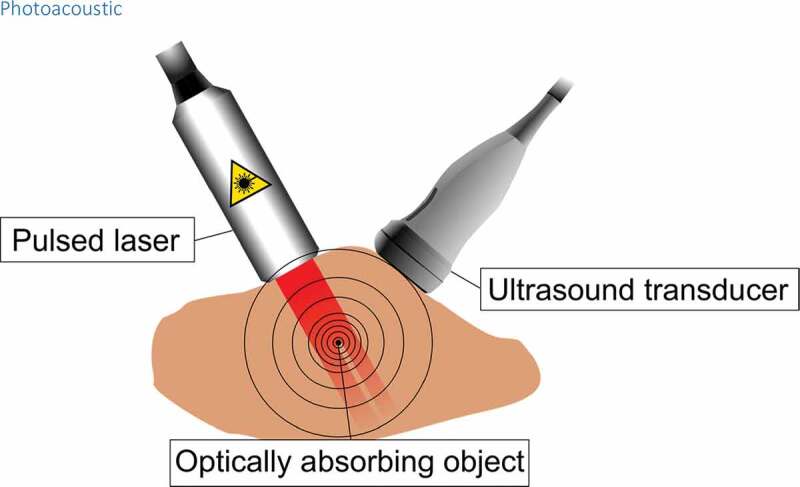
Noninvasive imaging methods of internal body temperature are in high demand in both clinical medicine and physiological research. Thermography and thermometry can be used to assess tissue temperature during thermal therapies: ablative and hyperthermia treatments to ensure adequate temperature rise in target tissues but also to avoid collateral damage by heating healthy tissues. In research use, measurement of internal body temperature enables us the production of thermal maps on muscles, internal organs, and other tissues of interest. The most used methods for noninvasive imaging of internal body temperature are based on different parameters acquired with magnetic resonance imaging, ultrasound, computed tomography, microwave radiometry, photoacoustic imaging, and near-infrared spectroscopy. In the current review, we examine the aforementioned imaging methods, their use in estimating internal body temperature in vivo with their advantages and disadvantages, and the physical phenomena the thermography or thermometry modalities are based on.
Keywords: computed tomography; imaging; magnetic resonance imaging; temperature; ultrasound.
© 2020 Informa UK Limited, trading as Taylor & Francis Group.
Conflict of interest statement
We declare no conflicts of interest.
Figures
Similar articles
-
Magnetic resonance thermometry and its biological applications - Physical principles and practical considerations.Prog Nucl Magn Reson Spectrosc. 2019 Feb;110:34-61. doi: 10.1016/j.pnmrs.2019.01.003. Epub 2019 Jan 31. Prog Nucl Magn Reson Spectrosc. 2019. PMID: 30803693 Free PMC article. Review.
-
Comparison of thermal damage calculated using magnetic resonance thermometry, with magnetic resonance imaging post-treatment and histology, after interstitial microwave thermal therapy of rabbit brain.Phys Med Biol. 2000 Dec;45(12):3563-76. doi: 10.1088/0031-9155/45/12/304. Phys Med Biol. 2000. PMID: 11131184
-
Recent technological advancements in thermometry.Adv Drug Deliv Rev. 2020;163-164:19-39. doi: 10.1016/j.addr.2020.11.001. Epub 2020 Nov 18. Adv Drug Deliv Rev. 2020. PMID: 33217482
-
Interleaved Mapping of Temperature and Longitudinal Relaxation Rate to Monitor Drug Delivery During Magnetic Resonance-Guided High-Intensity Focused Ultrasound-Induced Hyperthermia.Invest Radiol. 2017 Oct;52(10):620-630. doi: 10.1097/RLI.0000000000000392. Invest Radiol. 2017. PMID: 28598900
-
Integrated thermal and magnetic susceptibility modeling for air-motion artifact correction in proton resonance frequency shift thermometry.Int J Hyperthermia. 2022;39(1):967-976. doi: 10.1080/02656736.2022.2094475. Int J Hyperthermia. 2022. PMID: 35853735
Cited by
-
Comparative Analysis of Human Body Temperatures Measured with Noncontact and Contact Thermometers.Healthcare (Basel). 2022 Feb 9;10(2):331. doi: 10.3390/healthcare10020331. Healthcare (Basel). 2022. PMID: 35206944 Free PMC article.
-
Recent progress in cryoablation cancer therapy and nanoparticles mediated cryoablation.Theranostics. 2022 Feb 14;12(5):2175-2204. doi: 10.7150/thno.67530. eCollection 2022. Theranostics. 2022. PMID: 35265206 Free PMC article. Review.
-
Infrared Thermal Imaging of Patients With Acute Upper Respiratory Tract Infection: Mixed Methods Analysis.Interact J Med Res. 2021 Aug 19;10(3):e22524. doi: 10.2196/22524. Interact J Med Res. 2021. PMID: 34420912 Free PMC article.
-
Proof of Concept of an Integrated Laser Irradiation and Thermal/Visible Imaging System for Optimized Photothermal Therapy in Skin Cancer.Sensors (Basel). 2025 Jul 19;25(14):4495. doi: 10.3390/s25144495. Sensors (Basel). 2025. PMID: 40732623 Free PMC article.
-
Backstage of rising body temperature: Advances in research on intracellular heat diffusion.Temperature (Austin). 2021 Oct 19;8(4):303-305. doi: 10.1080/23328940.2021.1982363. eCollection 2021. Temperature (Austin). 2021. PMID: 34901314 Free PMC article. No abstract available.
References
-
- Zaretsky DV, Romanovsky AA, Zaretskaia MV, et al. Tissue oxidative metabolism can increase the difference between local temperature and arterial blood temperature by up to 1.3°C: implications for brain, brown adipose tissue, and muscle physiology. Temperature. 2018;5(1):22–35. doi:10.1080/23328940.2018.1437311. - DOI - PMC - PubMed
Publication types
LinkOut - more resources
Full Text Sources