. 2020 Nov 10:2:100059.
doi: 10.1016/j.ijpx.2020.100059. eCollection 2020 Dec.

Towards better understanding of the influence of process parameters in roll compaction/dry granulation on throughput, ribbon microhardness and granule failure load

Affiliations

Towards better understanding of the influence of process parameters in roll compaction/dry granulation on throughput, ribbon microhardness and granule failure load

Annika Wilms et al. Int J Pharm X. .

Abstract

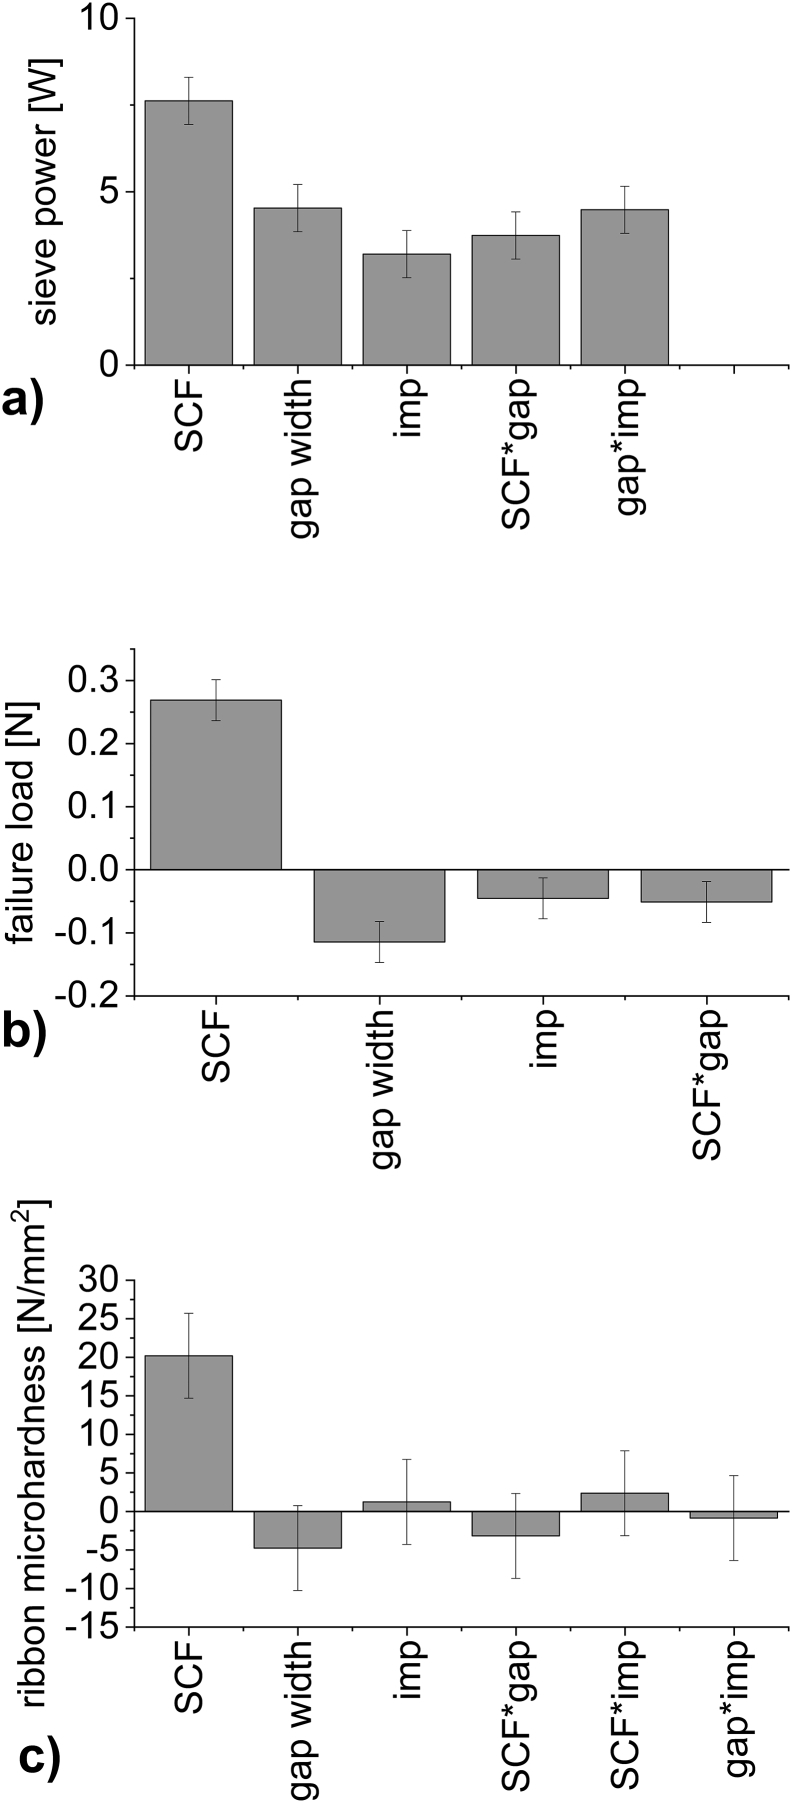
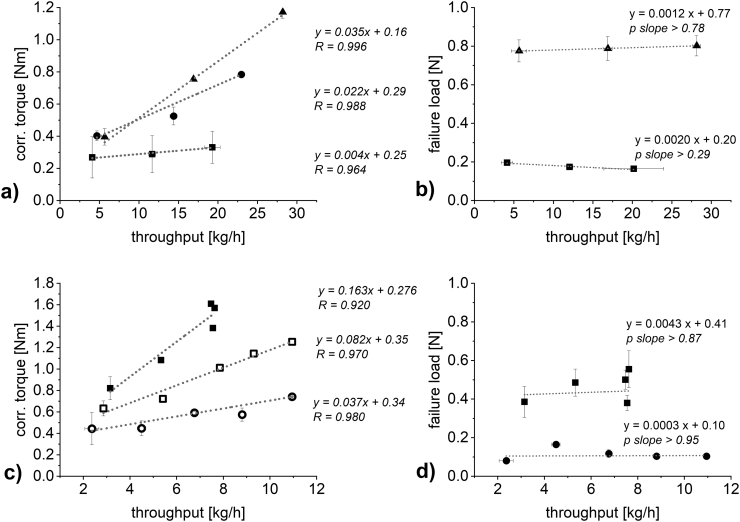
A key quality attribute for solid oral dosage forms is their hardness and ability to withstand breaking or grinding. If the product is to be manufactured continuously, it can be of interest to monitor the hardness of the material at different stages of manufacturing. Using the controlled process parameters of roll compaction/dry granulation specific compaction force, roll speed and gap width, hardness of the resulting ribbons and granules can be predicted. For the first time, in this study two yield variables (corrected torque of the granulation unit and throughput of material) are used to predict the granules failure load. The increase in granule hardness was monitored in-line when the specific compaction force was increased during the compaction process. This opens the way for in-line control of material hardness, and its use for feedback and feedforward control loops for future continuous manufacturing processes.

Keywords: Continuous manufacturing; Granule strength/failure load; Microhardness; Process analytical technologies; Process monitoring; Roll compaction/dry granulation.


Conflict of interest statement

The authors declare that they have no known competing financial interests or personal relationships that could have appeared to influence the work reported in this paper.

Figures

Unlabelled Image
Graphical abstract
Fig. 1
Fig. 1
Microindentation experimental procedure.
Fig. 2
Fig. 2
Coefficient plots. Effects on a) sieve power: additional power consumption of the granulation unit, b) failure load and c) ribbon microhardness. Error bars indicating 95% confidence interval (sieve power R2: 0.98, Q2:0.85., failure load R2: 0.99, Q2: 0.95, ribbon microhardness R2: 0.96, Q2:0.74).
Fig. 3
Fig. 3
Contour plots. Effects on a) sieve power, b) failure load and c) ribbon microhardness. (sieve power R2: 0.98, Q2:0.85., failure load R2: 0.99, Q2: 0.95, ribbon microhardness R2: 0.96, Q2:0.74).
Fig. 4
Fig. 4
Plot of SCF against a) and c) the torque of the granulation unit (n = 3–7; mean ± sd) and b) and d) the failure load of the resulting granules (n = 5; mean ± sd). a) and b) DCPA c) and d) MCC.
Fig. 5
Fig. 5
Plots of a) and c) SCF against throughput, (n = 3–6; mean ± sd) and b) and d) roll speed against throughput for 2 kN/cm (unfilled circle), 4 kN/cm (unfilled square), 6 kN/cm (square), 12 kN/cm (circle) and 18 kN/cm (triangle) (n = 3–6; mean ± sd). a) and b) DCPA, c) and d) MCC. Gap width in all experiments: 2.0 mm.
Fig. 6
Fig. 6
Plot of throughput against a) and c) the torque of the granulation unit (n = 1–6; mean ± sd) b) and d) the failure load of the resulting granules (n = 3–5; mean ± sd). 2 kN/cm (unfilled circle), 4 kN/cm (unfilled square), 6 kN/cm (square), 12 kN/cm (circle) and 18 kN/cm (triangle). a) and b) DCPA and c) and d) MCC. Gap width in all experiments: 2.0 mm.
Fig. 7
Fig. 7
Interaction plot of SCF against the torque of the granulation unit at varying throughputs for a) DCPA; 6 kg/h (circle); 12 kg/h (square); 18 kg/h (triangle) and b) MCC; 4.0 kg/h (circle); 5.5 kg/h (square); 7.0 kg/h (triangle).
Fig. 8
Fig. 8
Plots of failure load against the torque of the granulation unit for throughputs of a) DCPA, 15.89 kg/h and b) MCC, 2.87 kg/h.
Fig. 9
Fig. 9
Plot of failure load (solid black), gap width (solid gray) and SCF (dotted black) against time. Gray coloring highlights time periods of instable process conditions. DCPA as excipient. Failure load moving average over 2 min. Gap width and SCF values every 10 s. Real-time data, n = 1.
Fig. 10
Fig. 10
Plots of a) SCF against throughput b) roll speed against throughput at 2 kN/cm (circle), 4 kN/cm (horizontal line), 6 kN/cm (square) c) throughput against corrected torque of the granulation unit d) SCF against corrected torque of the granulation unit. n = 1–3; mean ± sd.
Fig. 11
Fig. 11
Plot of SCF against the interpolated corrected torque of the granulation unit at 3.5 kg/h (circle) and 8 kg/h (square).

References

    1. Adams M.J., Mullier M.A., Seville J.P.K. Agglomerate strength measurement using a uniaxial confined compression test. Powder Technol. 1994;78:5–13.
    1. Arndt O.-R., Baggio R., Adam A.K., Harting J., Franceschinis E., Kleinebudde P. Impact of different dry and wet granulation techniques on granule and tablet properties: a comparative study. J. Pharm. Sci. 2018;107:3143–3152. - PubMed
    1. Broitman E. Indentation hardness measurements at macro-, micro-, and nanoscale: a critical overview. Ribol. Lett. 2017;65 (article number 23)
    1. Chatterjee S. IFPAC Annual Meeting; Baltimore: 2012. FDA Perspective on Continuous Manufacturing.
    1. Chowhan Z. Moisture, hardness, disintegration and dissolution interrelationships in compressed tablets prepared by the wet granulation process. Drug Dev. Ind. Pharm. 1979;5:41–62.

LinkOut - more resources