AMPK regulates cell shape of cardiomyocytes by modulating turnover of microtubules through CLIP-170
- PMID: 33251722
- PMCID: PMC7788454
- DOI: 10.15252/embr.202050949
AMPK regulates cell shape of cardiomyocytes by modulating turnover of microtubules through CLIP-170
Abstract
AMP-activated protein kinase (AMPK) is a multifunctional kinase that regulates microtubule (MT) dynamic instability through CLIP-170 phosphorylation; however, its physiological relevance in vivo remains to be elucidated. In this study, we identified an active form of AMPK localized at the intercalated disks in the heart, a specific cell-cell junction present between cardiomyocytes. A contractile inhibitor, MYK-461, prevented the localization of AMPK at the intercalated disks, and the effect was reversed by the removal of MYK-461, suggesting that the localization of AMPK is regulated by mechanical stress. Time-lapse imaging analysis revealed that the inhibition of CLIP-170 Ser-311 phosphorylation by AMPK leads to the accumulation of MTs at the intercalated disks. Interestingly, MYK-461 increased the individual cell area of cardiomyocytes in CLIP-170 phosphorylation-dependent manner. Moreover, heart-specific CLIP-170 S311A transgenic mice demonstrated elongation of cardiomyocytes along with accumulated MTs, leading to progressive decline in cardiac contraction. In conclusion, these findings suggest that AMPK regulates the cell shape and aspect ratio of cardiomyocytes by modulating the turnover of MTs through homeostatic phosphorylation of CLIP-170 at the intercalated disks.
Keywords: AMPK; CLIP-170; intercalated disk; microtubule.
© 2020 The Authors. Published under the terms of the CC BY NC ND 4.0 license.
Conflict of interest statement
The authors declare that they have no conflict of interest.
Figures
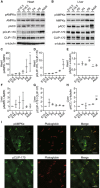
- A, B
Immunoblot analysis of the phosphorylation level of CLIP‐170, AMPK, and ACC in heart (A) and liver (B) along with the developmental stages. α‐Tubulin was used as a loading control.
- C–E
Quantitative analysis of Western blotting shown in (A). Multiple tissues from each stage were collected and mixed to minimize variation. The data represent three independent sample collections for the heart and liver. *P < 0.05, **P < 0.01 vs E15.5. One‐way ANOVA followed by Dunnett post hoc test.
- F–H
Quantitative analysis of Western blotting shown in (B). Multiple tissues from each stage were collected and mixed to minimize variation. The data represent three independent sample collections for the heart and liver. **P < 0.01 vs E15.5. One‐way ANOVA followed by Dunnett post hoc test.
- I
Immunostained images of adult mouse heart tissue. These were stained with a phosphorylated AMPK antibody (I, upper), a phosphorylated CLIP‐170 antibody (I, lower), and a plakoglobin antibody (middle). The representative images from more than five analyzed tissues were shown.
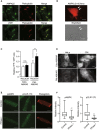
Immunostained images of adult mouse heart tissue. These were stained with an AMPKβ2 antibody (upper, left), an LKB1 antibody (bottom, left), and a plakoglobin antibody (center). The representative images from more than three analyzed tissues were shown.
Cardiomyocytes transfected with adenovirus vector encoding AMPKβ2‐mCherry were observed by a fluorescent (mCherry; red) and bright‐field microscope. White arrows indicate that AMPKβ2 localized at the cell–cell junction site of the cardiomyocytes. The data represent two independent experiments.
Quantitative analysis of FRET signal (YFP/CFP) from organelle‐specific ABKAR. Number of cells analyzed: Cyto‐ABKAR in HeLa (n = 117), Cyto‐ABKAR in cardiomyocytes (n = 112), PM‐ABKAR in HeLa (n = 27), PM‐ABKAR in cardiomyocytes (n = 94). Data means ± SD. All measurements were normalized to the average of Cyto‐ABKAR in HeLa cells. Statistical analysis was done by ANOVA followed by post hoc analysis (Turkey). CM: cardiomyocytes. **P < 0.01.
Organelle‐specific expression of Cyto‐ or PM‐ABKAR was confirmed by fluorescent microscope.
Immunostained images of adult cardiomyocytes obtained by Langendorff method. PPase+; lambda phosphatase treatment.
Quantitative analysis of intensity of pAMPK or CLIP‐170 in (E). Box and whisker plots showed the 25th percentile (bottom line of each box), median (middle line of each box), 75th percentile (top line of each box), maximum and minimum (each whisker). Number of cells analyzed, pAMPK; Control, n = 29, PPase+, n = 28, pCLIP‐170; Control, n = 29, PPase+, n = 26. **P < 0.01 vs Control.
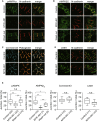
- A, B
Immunostained images of neonatal rat cardiomyocytes 2 h after treatment with 0.01% DMSO (Control, upper row) or 2 μM MYK‐461(MYK‐461, middle row) and 4 h after washing out of MYK‐461 (Wash out, bottom row). These cells were stained with a phosphorylated AMPK antibody, an AMPKβ2 antibody, and a N‐cadherin antibody.
- C, D
Immunostained images of neonatal rat cardiomyocytes 2 h after treatment with 0.01% DMSO (Control, upper row) or 2 μM MYK‐461(MYK‐461, bottom row) and stained with a connexin 43 antibody, a plakoglobin antibody, an LKB‐1 antibody, and an N‐cadherin antibody. The representative images from four independent experiments were shown.
- E
Quantification of pAMPK, AMPKβ2, Connexin 43, or LKB1 that was localized with a cell–cell junction marker (N‐cadherin or Plakoglobin). Box and whisker plots showed the 25th percentile (bottom line of each box), median (middle line of each box), 75th percentile (top line of each box), maximum and minimum (each whisker). Numbers in the brackets indicate the cells that were analyzed for quantification. Differences among multiple groups were compared by one‐way ANOVA, followed by a post hoc comparison using the Tukey method. Two‐tailed Student's t‐test was used to analyze differences between two groups. *P < 0.05, **P < 0.01. n.s., not significant.

GFP time‐lapse images of neonatal rat cardiomyocytes expressing EGFP‐CLIP‐170 WT 0 and 15 min after treatment with 20 μM compound C (left side panel) and expressing EGFP‐CLIP‐170 S311A (right side panel). Higher magnification of white square (upper row) showing CLIP‐170 migrated longitudinally toward the cell–cell junctions.
Beeswarm plots of comet length of EGFP‐CLIP‐170. The comet length from multiple cells in different fields was analyzed. Number of comets analyzed, Pre: n = 32, Cpd. C: n = 36, CLIP S311A: n = 68. Data means ± SD. Differences among multiple groups were compared by one‐way ANOVA, followed by a post hoc comparison using the Tukey method. **P < 0.01 vs Pre.
GFP time‐lapse images of neonatal rat cardiomyocytes expressing EGFP‐CLIP‐170 WT treated with control siRNA (siCL, left) or siRNA targeting both AMPKα1 and α2 (siAMPKα1α2, right). White dotted lines in the images showed the connected cardiomyocyte not expressing EGFP‐CLIP‐170 WT.
Beeswarm plots of comet length of EGFP‐CLIP‐170. The comet length from multiple cells from different fields was analyzed. Number of comets analyzed, siCL: n = 178, siAMPKα1α2: n = 184. Data means ± SD. Two‐tailed Student's t‐test was used to analyze differences between two groups. **P < 0.01 vs siCL.
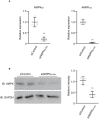
(A, B) Knockdown by siRNA was confirmed by real‐time PCR (A) and Western blotting (B). The data were confirmed by three independent experiments. Student's t‐tests, **P < 0.01 vs siControl.
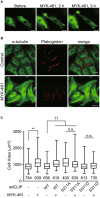
GFP time‐lapse images of neonatal rat cardiomyocytes expressing EGFP‐CLIP‐170 WT 0, 2 and 3 h after treatment with 2 μM MYK‐461.
Immunostained images of neonatal rat cardiomyocytes 4 h after treatment with 0.01% DMSO (Control, upper row) or 2 μM MYK‐461(MYK‐461, bottom row). These cells were stained with an α‐tubulin (green) and a plakoglobin (red) antibody.
Box and whisker plots of the cell size of a cardiomyocyte 2 h after treatment with or without 2 μM MYK‐461, showing the 25th percentile (bottom line of each box), median (middle line of each box), 75th percentile (top line of each box), and maximum and minimum (each whisker). Adenovirus expressing EGFP‐CLIP‐170 (adCLIP) mutant was used (WT, S311A, S311D). Numbers in the graph indicate n number of the cells from 2 independent experiments. Control (−/−): n = 784, MYK‐461: n = 939, CLIP WT: n = 656, CLIP WT + MYK‐461: n = 619, CLIP S311A: n = 405, CLIP S311A + MYK‐461: n = 635, CLIP S311D: n = 613, CLIP S311D + MYK‐461: n = 735. Data means ± SD. Differences among multiple groups were compared by one‐way ANOVA, followed by a post hoc comparison using the Tukey method. **P < 0.01 vs Control, †† P < 0.01 vs CLIP WT, n.s., not significant.
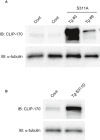
Immunoblot analysis of the CLIP‐170 in control (Cont) and two lines of S311A TG heart (Tg #3 and #9).
Immunoblot analysis of the CLIP‐170 in control (Cont) and S311D TG heart. α‐Tubulin was used as a loading control. Tissues were collected 1 week after tamoxifen induction.
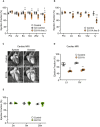
Beeswarm plots of the echocardiographic parameter (ejection fraction) of individual Cre control (CLIP‐170 S311A +/+ ; α‐MHC‐MerCreMer +/−), Control mice (CLIP‐170 S311Aflox /+ ; α‐MHC‐MerCreMer −/−), and CLIP‐170 S311A overexpressing mice (CLIP‐170 S311 Aflox /+ ; α‐MHC‐MerCreMer +/−), before (Pre), 2 weeks (Tx2w), 8 weeks (Tx8w), 26 weeks (Tx26w), and over 1 year (Tx1y) after tamoxifen induction. Number of mice (Cre control, Control, S311A), Pre (6, 2, 3), Tx2w (9, 5, 5), Tx8w (9, 10, 14), Tx12w (7, 10, 14), Tx26w (3, 7, 8), Tx52w (3, 7, 9).
Beeswarm plots of another line of CLIP‐170 S311A overexpressing mice (line 9). Number of mice (Control, S311A), Pre (7, 3), Tx2w (4, 7), Tx8w (6, 4), Tx12w (5, 4), Tx52w (3, 3). Data means ± SD. Statistical significance was determined by two‐way ANOVA followed by post hoc Tukey's multiple comparison test. ## P < 0.01 vs duration‐matched Cre Control, *P < 0.05, **P < 0.01 vs duration‐matched Control; † P < 0.05, †† P < 0.01, S311A TG mice 12 vs 52 weeks.
Representative long‐axis four‐chamber cardiac magnetic resonance images of CLIP‐170 S311A TG mice and control mice over 1 year after tamoxifen induction. Left column showed systole images, and right column represented diastole images. Three mice from each group were analyzed for cardiac MRI. The representative images were shown.
Beeswarm plots showed the ejection fraction from cardiac MRI. LV, left ventricular, RV, right ventricular. Number of mice, (Control, S311A), 1y (3, 3). Data means ± SD. Two‐tailed Student's t‐test was used to analyze differences between two groups. **P < 0.01 vs Control.
Beeswarm plots of the echocardiographic parameter (ejection fraction) from CLIP‐170 S311D overexpressing mice and the control. Number of mice (Control, S311D), Tx2w (3, 4), Tx8w (5, 11), Tx26w (4, 11). Data means ± SD. There was no significant difference.

Echocardiographic measurements of S311A TG mice line 3, control and Cre control.
Echocardiographic measurements of S311A TG mice line 9 and control.
Heart, lung, and body weight of S311A TG mice and its control.
Cardiac MRI measurements of S311A line 3 over 1 year after the tamoxifen induction.
Echocardiographic measurements of S311D TG mice and control.
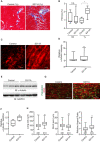
Masson's trichrome staining of the heart of CLIP‐170 S311A overexpressing mice and the control mice from 3 months and 1 year after tamoxifen treatment.
Quantitative analysis of cardiac fibrosis. Quantification was made as percentage of fibrosis area (in blue) in the left ventricle. Number of mice, (Control, S311A), 3 months (7, 6), 1 year (5, 6). *P < 0.05 vs Control.
Representative immunostained images with an α‐tubulin antibody of CLIP‐170 S311A overexpressing mice heart and control mice heart over 1 year after tamoxifen treatment.
Quantitative analysis of intensity of α‐tubulin in (C). Number of mice (Control: n = 7, S311A: n = 8). Average of 5 sections per animal was analyzed. **P < 0.01 vs Control.
Representative images of Western blot for an α‐tubulin antibody. GAPDH was used as a loading control.
Quantitative analysis of intensity of α‐tubulin in (E). Number of mice (Control: n = 4, S311A: n = 5). *P < 0.05 vs Control.
Representative immunostained images of CLIP‐170 S311A overexpressing mice heart and the control mice heart over 1 year after tamoxifen treatment. These were stained with WGA (red) and a plakoglobin antibody (green).
Quantitative analysis of (G) cell width, length, and aspect ratio (length/width) were measured. Number of cells analyzed, control, n = 251, S311A, n = 310, **P < 0.01 vs Control.
Similar articles
-
AMPK attenuates microtubule proliferation in cardiac hypertrophy.Am J Physiol Heart Circ Physiol. 2013 Mar 1;304(5):H749-58. doi: 10.1152/ajpheart.00935.2011. Epub 2013 Jan 11. Am J Physiol Heart Circ Physiol. 2013. PMID: 23316058 Free PMC article.
-
AMPK controls the speed of microtubule polymerization and directional cell migration through CLIP-170 phosphorylation.Nat Cell Biol. 2010 Jun;12(6):583-90. doi: 10.1038/ncb2060. Epub 2010 May 23. Nat Cell Biol. 2010. PMID: 20495555
-
Alpha1 catalytic subunit of AMPK modulates contractile function of cardiomyocytes through phosphorylation of troponin I.Life Sci. 2014 Mar 11;98(2):75-82. doi: 10.1016/j.lfs.2014.01.006. Epub 2014 Jan 19. Life Sci. 2014. PMID: 24447627 Free PMC article.
-
[AMP-kinase regulates the speed of microtubule polymerization and cell polarity by phosphorylation of microtubule plus end protein CLIP-170].Seikagaku. 2011 Sep;83(9):850-4. Seikagaku. 2011. PMID: 22111378 Review. Japanese. No abstract available.
-
The role of AMPK in cardiomyocyte health and survival.Biochim Biophys Acta. 2016 Dec;1862(12):2199-2210. doi: 10.1016/j.bbadis.2016.07.001. Epub 2016 Jul 10. Biochim Biophys Acta. 2016. PMID: 27412473 Review.
Cited by
-
Ion channel trafficking implications in heart failure.Front Cardiovasc Med. 2024 Feb 14;11:1351496. doi: 10.3389/fcvm.2024.1351496. eCollection 2024. Front Cardiovasc Med. 2024. PMID: 38420267 Free PMC article. Review.
-
The microtubule cytoskeleton in cardiac mechanics and heart failure.Nat Rev Cardiol. 2022 Jun;19(6):364-378. doi: 10.1038/s41569-022-00692-y. Epub 2022 Apr 19. Nat Rev Cardiol. 2022. PMID: 35440741 Free PMC article. Review.
-
Mitochondrial Dynamics: Working with the Cytoskeleton and Intracellular Organelles to Mediate Mechanotransduction.Aging Dis. 2023 Oct 1;14(5):1511-1532. doi: 10.14336/AD.2023.0201. Aging Dis. 2023. PMID: 37196113 Free PMC article. Review.
-
Intermittent Fasting Activates AMP-Kinase to Restructure Right Ventricular Lipid Metabolism and Microtubules.JACC Basic Transl Sci. 2023 Feb 20;8(3):239-254. doi: 10.1016/j.jacbts.2022.12.001. eCollection 2023 Mar. JACC Basic Transl Sci. 2023. PMID: 37034280 Free PMC article.
-
LSMEM2, Localized at the Neuromuscular Junction, Modulates Mitochondrial Integration in Skeletal Muscles.FASEB J. 2025 Jun 30;39(12):e70609. doi: 10.1096/fj.202402152R. FASEB J. 2025. PMID: 40525396 Free PMC article.
References
-
- Bairwa SC, Parajuli N, Dyck JRB (2016) The role of AMPK in cardiomyocyte health and survival. Biochim Biophys Acta Mol Basis Dis 1862: 2199–2210. - PubMed
Publication types
MeSH terms
Substances
Grants and funding
LinkOut - more resources
Full Text Sources
Other Literature Sources
Molecular Biology Databases
Research Materials

