. 2021 Jun;49(4):755-772.
doi: 10.1177/0192623320970534. Epub 2020 Nov 28.

Impact of Preanalytical Factors During Histology Processing on Section Suitability for Digital Image Analysis

Affiliations

Impact of Preanalytical Factors During Histology Processing on Section Suitability for Digital Image Analysis

Elizabeth A Chlipala et al. Toxicol Pathol. 2021 Jun.

Abstract

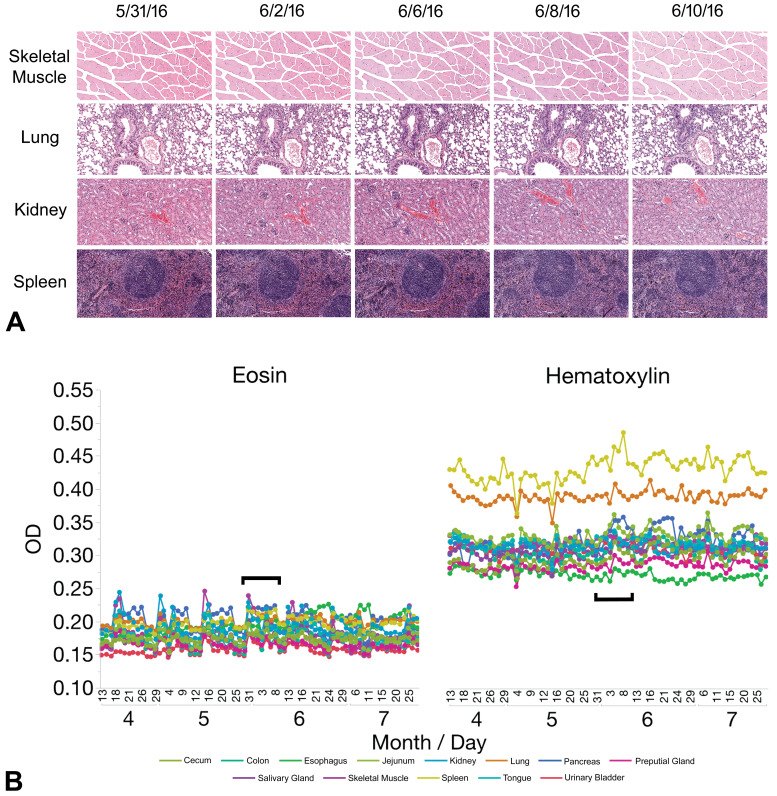
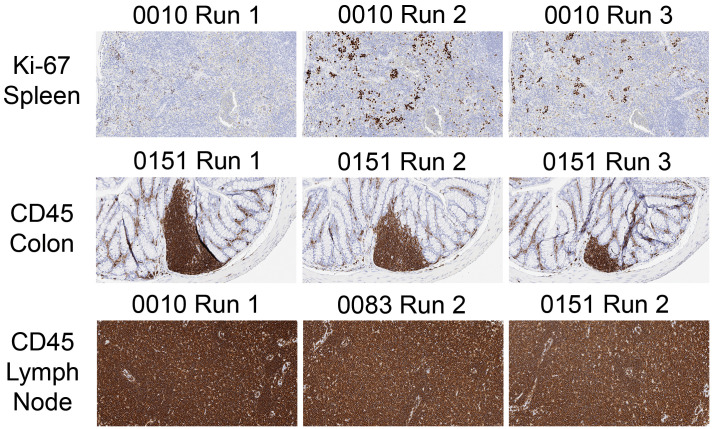
Digital image analysis (DIA) is impacted by the quality of tissue staining. This study examined the influence of preanalytical variables-staining protocol design, reagent quality, section attributes, and instrumentation-on the performance of automated DIA software. Our hypotheses were that (1) staining intensity is impacted by subtle differences in protocol design, reagent quality, and section composition and that (2) identically programmed and loaded stainers will produce equivalent immunohistochemical (IHC) staining. We tested these propositions by using 1 hematoxylin and eosin stainer to process 13 formalin-fixed, paraffin-embedded (FFPE) mouse tissues and by using 3 identically programmed and loaded immunostainers to process 5 FFPE mouse tissues for 4 cell biomarkers. Digital images of stained sections acquired with a commercial whole slide scanner were analyzed by customizable algorithms incorporated into commercially available DIA software. Staining intensity as viewed qualitatively by an observer and/or quantitatively by DIA was affected by staining conditions and tissue attributes. Intrarun and inter-run IHC staining intensities were equivalent for each tissue when processed on a given stainer but varied measurably across stainers. Our data indicate that staining quality must be monitored for each method and stainer to ensure that preanalytical factors do not impact digital pathology data quality.

Keywords: digital pathology; histology process validation; image analysis; immunohistochemistry; preanalytical factors; precision; reproducibility.


Conflict of interest statement

Declaration of Conflicting Interests: The author(s) declared no potential conflicts of interest with respect to the research, authorship, and/or publication of this article.

Figures

Figure 1.
Figure 1.
Impact of the staining protocol design (reagent times) on staining intensities. Panel A depicts representative images of 4-µm thick H&E-stained sections of prototypic tissues characterized by different nuclear-to-cytoplasmic ratios in key cell populations showing the effect of changing the incubation lengths for staining and differentiation steps. Panel B shows shifts in measurements of staining intensity for both hematoxylin and eosin as the protocol design is altered. Protocol number 4 reflects the standard H&E method for vertebrate tissues., Protocol numbers 0 to 3 have shorter staining times and longer differentiation and alcohol steps, while protocol numbers 5 to 8 have longer staining times and shorter differentiation and alcohol steps. (For details on each protocol, see Table 1.). H&E indicates hematoxylin and eosin; OD, optical density.
Figure 2.
Figure 2.
Precision (repeatability and reproducibility) of H&E staining varies over time for visual and OD-based assessments. Panel A shows a 2-week subset of representative images for H&E-stained sections of prototypic tissues characterized by different nuclear-to-cytoplasmic ratios in key cell populations taken at the middle of the 4-month study. Panel B shows the OD (a quantitative measure of staining intensity) of hematoxylin and eosin  separately for each staining run, indicated by month and day. Note that the OD for each stain is fairly consistent over time for a given tissue but may vary among tissues (as indicated by the higher hematoxylin OD readings for lung and spleen). Black brackets  represent the 2-week period during which the images were captured. H&E indicates hematoxylin and eosin; OD, optical density.
Figure 3.
Figure 3.
Staining intensity for H&E rises as section thickness increases. Panel A shows representative images of H&E-stained sections of various thicknesses for prototypic tissues characterized by different nuclear-to-cytoplasmic ratios in key cell populations. Panel B illustrates the progressive rise in OD ( a quantitative measure of staining intensity) for both hematoxylin and eosin  as section thickness increases from 2 to 10 µm. Note that the eosin staining intensity is affected more substantially with increasing section thickness, especially in cytoplasm- and connective tissue-rich tissues like colon, esophagus, skeletal muscle, and tongue. H&E indicates hematoxylin and eosin; OD, optical density.
Figure 4.
Figure 4.
Reagent quality has a measurable impact on H&E staining intensity. Panel A demonstrates that sections stained with expired hematoxylin are still interpretable by visual examination, while panel B confirms that the older hematoxylin lots yield reduced OD (a quantitative measure of staining intensity). The same eosin lot was used throughout this experiment. Status of hematoxylin lots (on the start date for the study): 5261, expired for 30 weeks (left); 5390, expired for 6 weeks (middle); 5822, unexpired (right). H&E indicates hematoxylin and eosin; OD, optical density.
Figure 5.
Figure 5.
Precision (repeatability and reproducibility) of IHC staining typically is similar within (intrarun) and between (inter-run) staining runs on a given instrument and across instruments. However, inter-run variability may occur depending on the biomarker and tissue (eg, CD45 and Ki67 in colon [panels A and B]). An unexpected result was that different instruments may share a similar pattern of inter-run variation (eg, CD45 and Ki67 in colon [panel B]). Each dot represents the average OD for deposition in 1 section. Instrument models: AutostainerPlus Link, Nos. 0010 and 0083; Autostainer Link 48, No. 0151. DAB indicates 3,3′-diaminobenzidene; IHC, immunohistochemical; OD, optical density.
Figure 6.
Figure 6.
Precision (repeatability and reproducibility) of IHC staining depends principally on the biomarker and tissue rather than the stainer. Each dot represents the number of positive cells in 1 section. Instrument models: AutostainerPlus Link, Nos. 0010 and 0083; Autostainer Link 48, No. 0151. IHC indicates immunohistochemical.
Figure 7.
Figure 7.
Precision (repeatability and reproducibility) of IHC staining for OD-based assessments generally is comparable across stainers, although subtle variations (eg, reduced average OD values for instrument 0151 for several biomarkers in colon, lymph node, and spleen) may be detected. These OD differences do not impact analysis of IHC data where the final interpretation is based on labeling of a specific tissue feature (eg, counts of positive cells; see Figure 6). IHC indicates immunohistochemical; OD, optical density.
Figure 8.
Figure 8.
The choice of qualifying end point impacts the apparent equivalence of IHC procedures when done on different instruments. Comparisons of stainers based on measurements linked to a particular tissue feature (eg, labeled objects, such as positive cells [panel A]) show less variation for some tissues than do quantitative data based on staining intensity (OD) across the entire section (panel B). For a given instrument, each dot represents the average for all runs of all 4 biomarkers for that tissue. Instrument models: AutostainerPlus Link, Nos. 0010 and 0083; Autostainer Link 48, No. 0151. DAB indicates  3,3′-diaminobenzidene; IHC, immunohistochemical; OD, optical density.
Figure 9.
Figure 9.
The staining intensity of a particular IHC method is influenced more by the biomarker than the choice of stainer. Data are shown as the CV (calculated as the SD divided by the mean) for the average OD within each staining run for each biomarker on a given instrument for all tissues. The box plots represent the distribution of the data, where the box defines the range encompassing values between the 25th and 75th quartiles, the line within the box is drawn at the median OD, and the whiskers demonstrate the expected variation in the data. Dots located over some boxes (eg, CD3 on instrument 0083) plot data that fell beyond the whiskers, which are indicative of staining runs with higher than expected variability. For Ki-67, the expanded ranges (longer boxes) on all 3 stainers denote that staining was more variable across runs for sections containing lymphoid tissue (see Figure 5). Instrument models: AutostainerPlus Link, Nos. 0010 and 0083; Autostainer Link 48, No. 0151. CV indicates coefficient of variation; DAB, 3,3′-diaminobenzidene; IHC, immunohistochemical; OD, optical density; SD, standard deviation.
Figure 10.
Figure 10.
Staining intensity for IHC methods in sections of different thicknesses may be comparable by visual inspection of tissue where specific tissue features are the subject of the evaluation (panel A, depicting CD45) but nonetheless have a quantitative difference in optical OD for some biomarkers in certain tissues as section thickness increases from 3 to 8 µm (panel B, showing lower OD for sections <5 µm thick for CD45 in lymph node and F4/80 in spleen). IHC indicates immunohistochemical; OD, optical density.
Figure 11.
Figure 11.
Optical density as a measure of staining intensity must be verified against the tissue architecture prior to interpretation. This quality control step is necessary chiefly for methods in which staining intensity varies across runs based on the IHC protocol design (top row; see also Figures 9 and 12) or the variable presence of the cell population expressing the biomarker (middle row) but is not needed for sections where tissue composition is consistent across the entire section (bottom row). Images for each row show representative step sections for the same site of each tissue. IHC indicates immunohistochemical.
Figure 12.
Figure 12.
Staining intensity may be impacted unexpectedly by inadvertent adjustments to the IHC protocol design. In this example, Ki-67-positive cells in 4-µm-thick step sections exhibit stronger staining when processed using a protocol in which the incubation in primary antibody is followed rapidly by application of the visualization reagent (ie, the standard protocol [column A]) relative to 4-µm thick step sections in which the primary antibody was followed by a 35-min incubation in buffer before addition of the visualization reagent (column B); the extended buffer incubation for Ki-67 corresponded to the time needed to accommodate another biomarker in the same staining run (CD45, which requires incubation with a secondary antibody prior to application of the visualization reagent). The decreased staining intensity associated with extended rinsing for some staining runs likely explains the higher variation in Ki-67 labeling across instruments (see Figure 9) relative to labeling provided by the other biomarkers tested in this study (CD3, CD45, F4/80). IHC indicates immunohistochemical.

References

    1. Aeffner F, Zarella MD, Buchbinder N, et al. Introduction to digital image analysis in whole-slide imaging: a white paper from the Digital Pathology Association. J Pathol Inform. 2019;10:9. - PMC - PubMed
    1. Webster JD, Dunstan RW. Whole-slide imaging and automated image analysis: considerations and opportunities in the practice of pathology. Vet Pathol. 2014;51(1):211–223. - PubMed
    1. Potts SJ. Digital pathology in drug discovery and development: multisite integration. Drug Discov Today. 2009;14(19-20):935–941. - PubMed
    1. Gauthier BE, Gervais F, Hamm G, O’Shea D, Piton A, Schumacher VL. Toxicologic Pathology Forum: opinion on integrating innovative digital pathology tools in the regulatory framework. Toxicol Pathol. 2019;47(4):436–443. - PubMed
    1. Griffin J, Treanor D. Digital pathology in clinical use: where are we now and what is holding us back? Histopathology. 2017;70(1):134–145. - PubMed

Substances

LinkOut - more resources