. 2021;79(1):163-175.
doi: 10.3233/JAD-200496.

White Matter Hyperintensities Are No Major Confounder for Alzheimer's Disease Cerebrospinal Fluid Biomarkers

Affiliations

White Matter Hyperintensities Are No Major Confounder for Alzheimer's Disease Cerebrospinal Fluid Biomarkers

Linda J C van Waalwijk van Doorn et al. J Alzheimers Dis. 2021.

Abstract

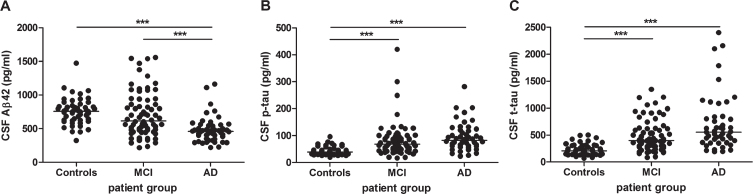
Background: The cerebrospinal fluid (CSF) biomarkers amyloid-β 1-42 (Aβ42), total and phosphorylated tau (t-tau, p-tau) are increasingly used to assist in the clinical diagnosis of Alzheimer's disease (AD). However, CSF biomarker levels can be affected by confounding factors.

Objective: To investigate the association of white matter hyperintensities (WMHs) present in the brain with AD CSF biomarker levels.

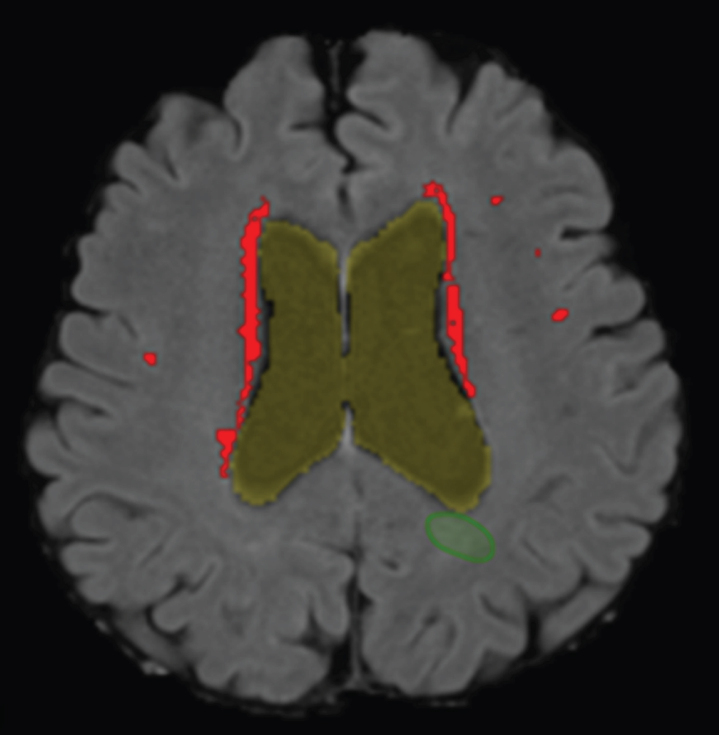
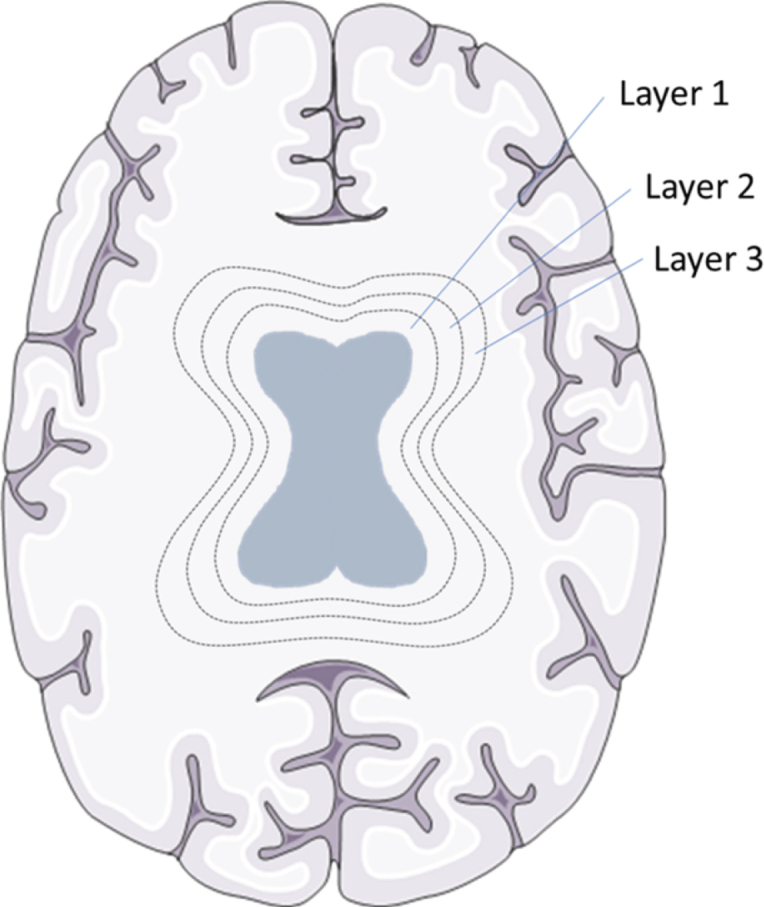
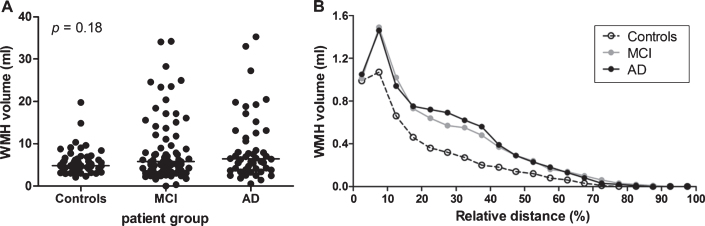
Methods: We included CSF biomarker and magnetic resonance imaging (MRI) data of 172 subjects (52 controls, 72 mild cognitive impairment (MCI), and 48 AD patients) from 9 European Memory Clinics. A computer aided detection system for standardized automated segmentation of WMHs was used on MRI scans to determine WMH volumes. Association of WMH volume with AD CSF biomarkers was determined using linear regression analysis.

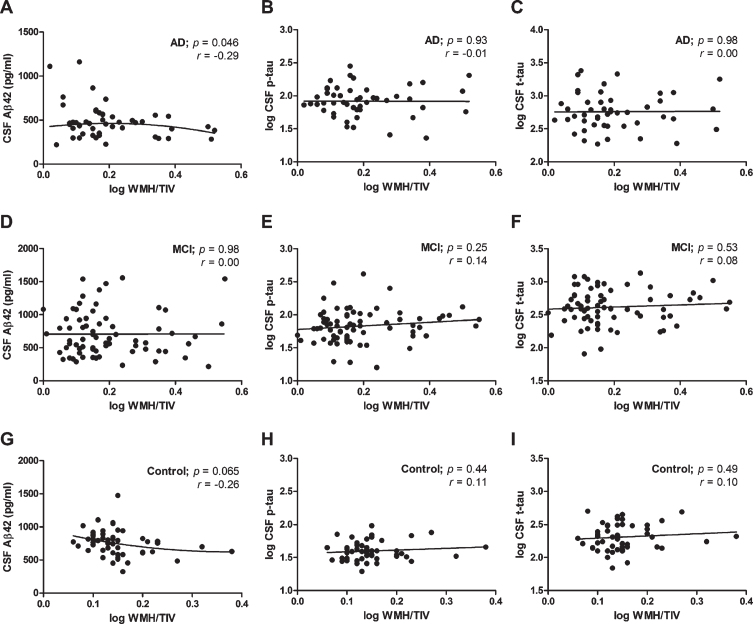
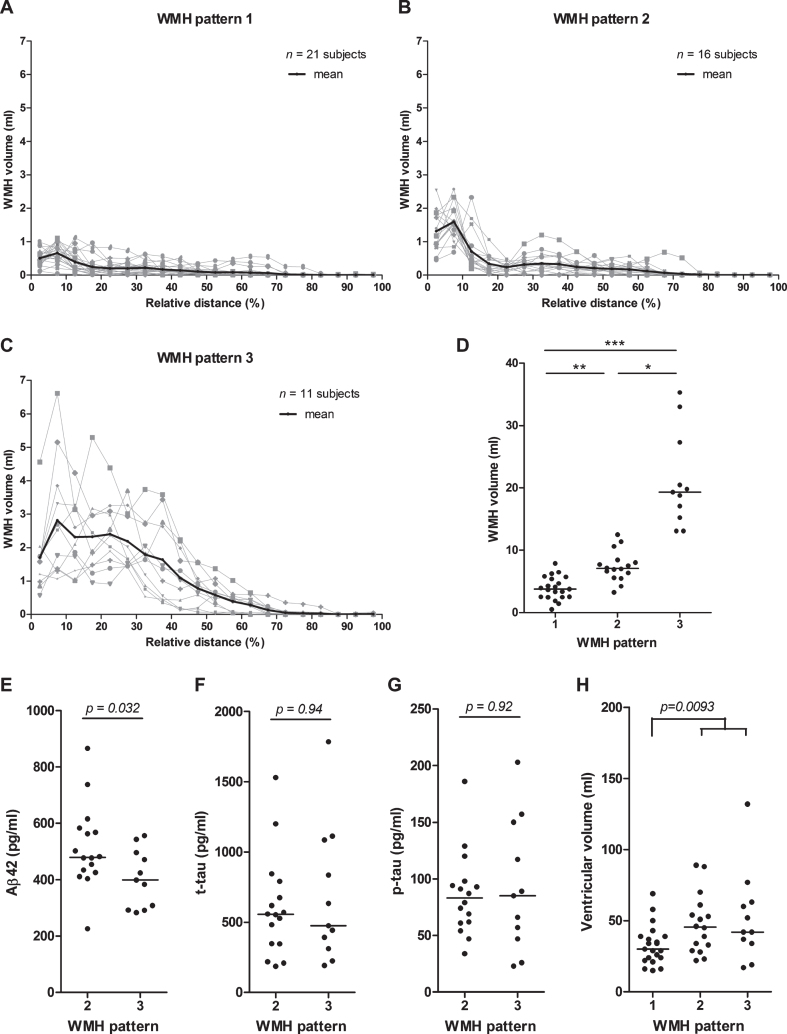
Results: A small, negative association of CSF Aβ42, but not p-tau and t-tau, levels with WMH volume was observed in the AD (r2 = 0.084, p = 0.046), but not the MCI and control groups, which was slightly increased when including the distance of WMHs to the ventricles in the analysis (r2 = 0.105, p = 0.025). Three global patterns of WMH distribution, either with 1) a low, 2) a peak close to the ventricles, or 3) a high, broadly-distributed WMH volume could be observed in brains of subjects in each diagnostic group.

Conclusion: Despite an association of WMH volume with CSF Aβ42 levels in AD patients, the occurrence of WMHs is not accompanied by excess release of cellular proteins in the CSF, suggesting that WMHs are no major confounder for AD CSF biomarker assessment.

Keywords: Alzheimer’s disease; amyloid; biomarkers; cerebrospinal fluid; magnetic resonance imaging; tau proteins; white matter hyperintensities; white matter lesions.


Conflict of interest statement

Authors’ disclosures available online (https://www.j-alz.com/manuscript-disclosures/20-0496r2).

Figures

Fig. 1
Fig. 1
WMH detection on a structural MRI scan. Segmentation of the WMHs detected by the computer aided detection system in the transverse plane projected on a T1-weighted MRI scan of an AD patient. Periventricular WMHs are indicated in red/light gray. Of note, the (green) circumference, right under ventricle, indicates a false positive WMH and was removed during post-processing.
Fig. 2
Fig. 2
WMH layers in a schematic overview. Brain tissue was divided into 20 layers, from ventricles to the skull, with each layer accounting for 5% of the total distance between ventricles to the skull. To exemplify this division the first three circular layers around the ventricles are shown in this schematic picture. Brain section image was modified from Smart Servier Medical Art, https://smart.servier.com.
Fig. 3
Fig. 3
Analysis of AD CSF biomarkers: Aβ42 (n = 172), p-tau (n = 172), and t-tau (n = 168) in healthy controls, MCI, and AD patients. Analysis of (A) Aβ42 in healthy controls (n = 52), mild cognitive impairment (MCI) (n = 72), and Alzheimer’s disease (AD) patients (n = 48), (B) p-tau in healthy controls (n = 52), MCI (n = 72), and AD patients (n = 48) and (C) t-tau in healthy controls (n = 52), MCI (n = 69), and AD patients (n = 47). Solid bar = median; p-value: ***p < 0.001 (Kruskal-Wallis with Dunn’s post hoc test).
Fig. 4
Fig. 4
WMH volume per diagnostic group. A) WMH volume per diagnostic group: healthy controls (n = 52), mild cognitive impairment (MCI) (n = 72), and Alzheimer’s disease (AD) patients (n = 48). No significant differences were found between the diagnostic groups (p = 0.18). Solid bar = median. B) WMH volume distribution as a function of the relative distance to the ventricles, per diagnostic group. Healthy controls had a lower WMH volume, but showed a similar distribution pattern as MCI and AD patients.
Fig. 5
Fig. 5
Correlation of WMH volume with CSF Aβ42, t-tau and p-tau. White matter hyperintensity volumes corrected for total intracranial volume (WMH/TIV) versus CSF Aβ42 (A, D, G), p-tau (B, E, H), and t-tau (C, F, I) concentrations in the Alzheimer’s disease (AD) group (A-C), the mild cognitive impairment (MCI) group (D-F), and the control group (G-I). A significant (p < 0.05), negative correlation was found between (log) WML/TIV and CSF Aβ42 concentrations in the AD group (A), but not for (log) p-tau or (log) t-tau in any group or for Aβ42 in the MCI and control groups. p and r values derived from linear regression analyses are plotted. Linear regression lines are shown, except for panels A and G where quadratic relations are shown.
Fig. 6
Fig. 6
WMH distribution patterns in brains of AD patients. WMH in brains of AD patients showed either (A) a distribution of a low WMH volume across the whole brain (pattern 1), or (B) an increased WMH volume (peak) close to the ventricles only (pattern 2), or (C) a high WMH volume distributed across a broader region of the brain (pattern 3). The WMH volume is shown per brain layer for a total of 20 evenly distributed layers per brain (indicated as relative distance from the ventricles in %). The distribution pattern for each patient is shown in grey, with the mean WMH volume per layer for each pattern shown in black. D) Dot plot of the total WMH volumes in the brain of AD patients per WMH pattern. Mean WMH volumes were statistically significant different between the three patterns (Kruskal Wallis test with Dunn’s test for multiple comparisons). Aβ42 CSF levels (E), but not t-tau (F), and p-tau levels (G), were significantly decreased in AD patients with WMH pattern 3 compared to pattern 2. H) Ventricular volume was significantly increased in AD patients with WMH pattern 2 or 3 (high WMH volumes) compared to pattern 1 (low WMH volumes). Solid bar = median; p-value: *< 0.05, **< 0.01, ***< 0.001.

References

    1. Blennow K, de Leon MJ, Zetterberg H (2006) Alzheimer’s disease. Lancet 368, 387–403. - PubMed
    1. Prins ND, Scheltens P (2015) White matter hyperintensities, cognitive impairment and dementia: An update. Nat Rev Neurol 11, 157–165. - PubMed
    1. Swan GE, DeCarli C, Miller BL, Reed T, Wolf PA, Jack LM, Carmelli D (1998) Association of midlife blood pressure to late-life cognitive decline and brain morphology. Neurology 51, 986–993. - PubMed
    1. Bigler ED, Kerr B, Victoroff J, Tate DF, Breitner JC (2002) White matter lesions, quantitative magnetic resonance imaging, and dementia. Alzheimer Dis Assoc Disord 16, 161–170. - PubMed
    1. De Groot JC, De Leeuw FE, Oudkerk M, Van Gijn J, Hofman A, Jolles J, Breteler MM (2002) Periventricular cerebral white matter lesions predict rate of cognitive decline. Ann Neurol 52, 335–341. - PubMed

Publication types

MeSH terms