. 2021 Jul;99(7):707-721.
doi: 10.1002/cyto.a.24274. Epub 2020 Dec 13.

In Situ Classification of Cell Types in Human Kidney Tissue Using 3D Nuclear Staining

Affiliations

In Situ Classification of Cell Types in Human Kidney Tissue Using 3D Nuclear Staining

Andre Woloshuk et al. Cytometry A. 2021 Jul.

Abstract

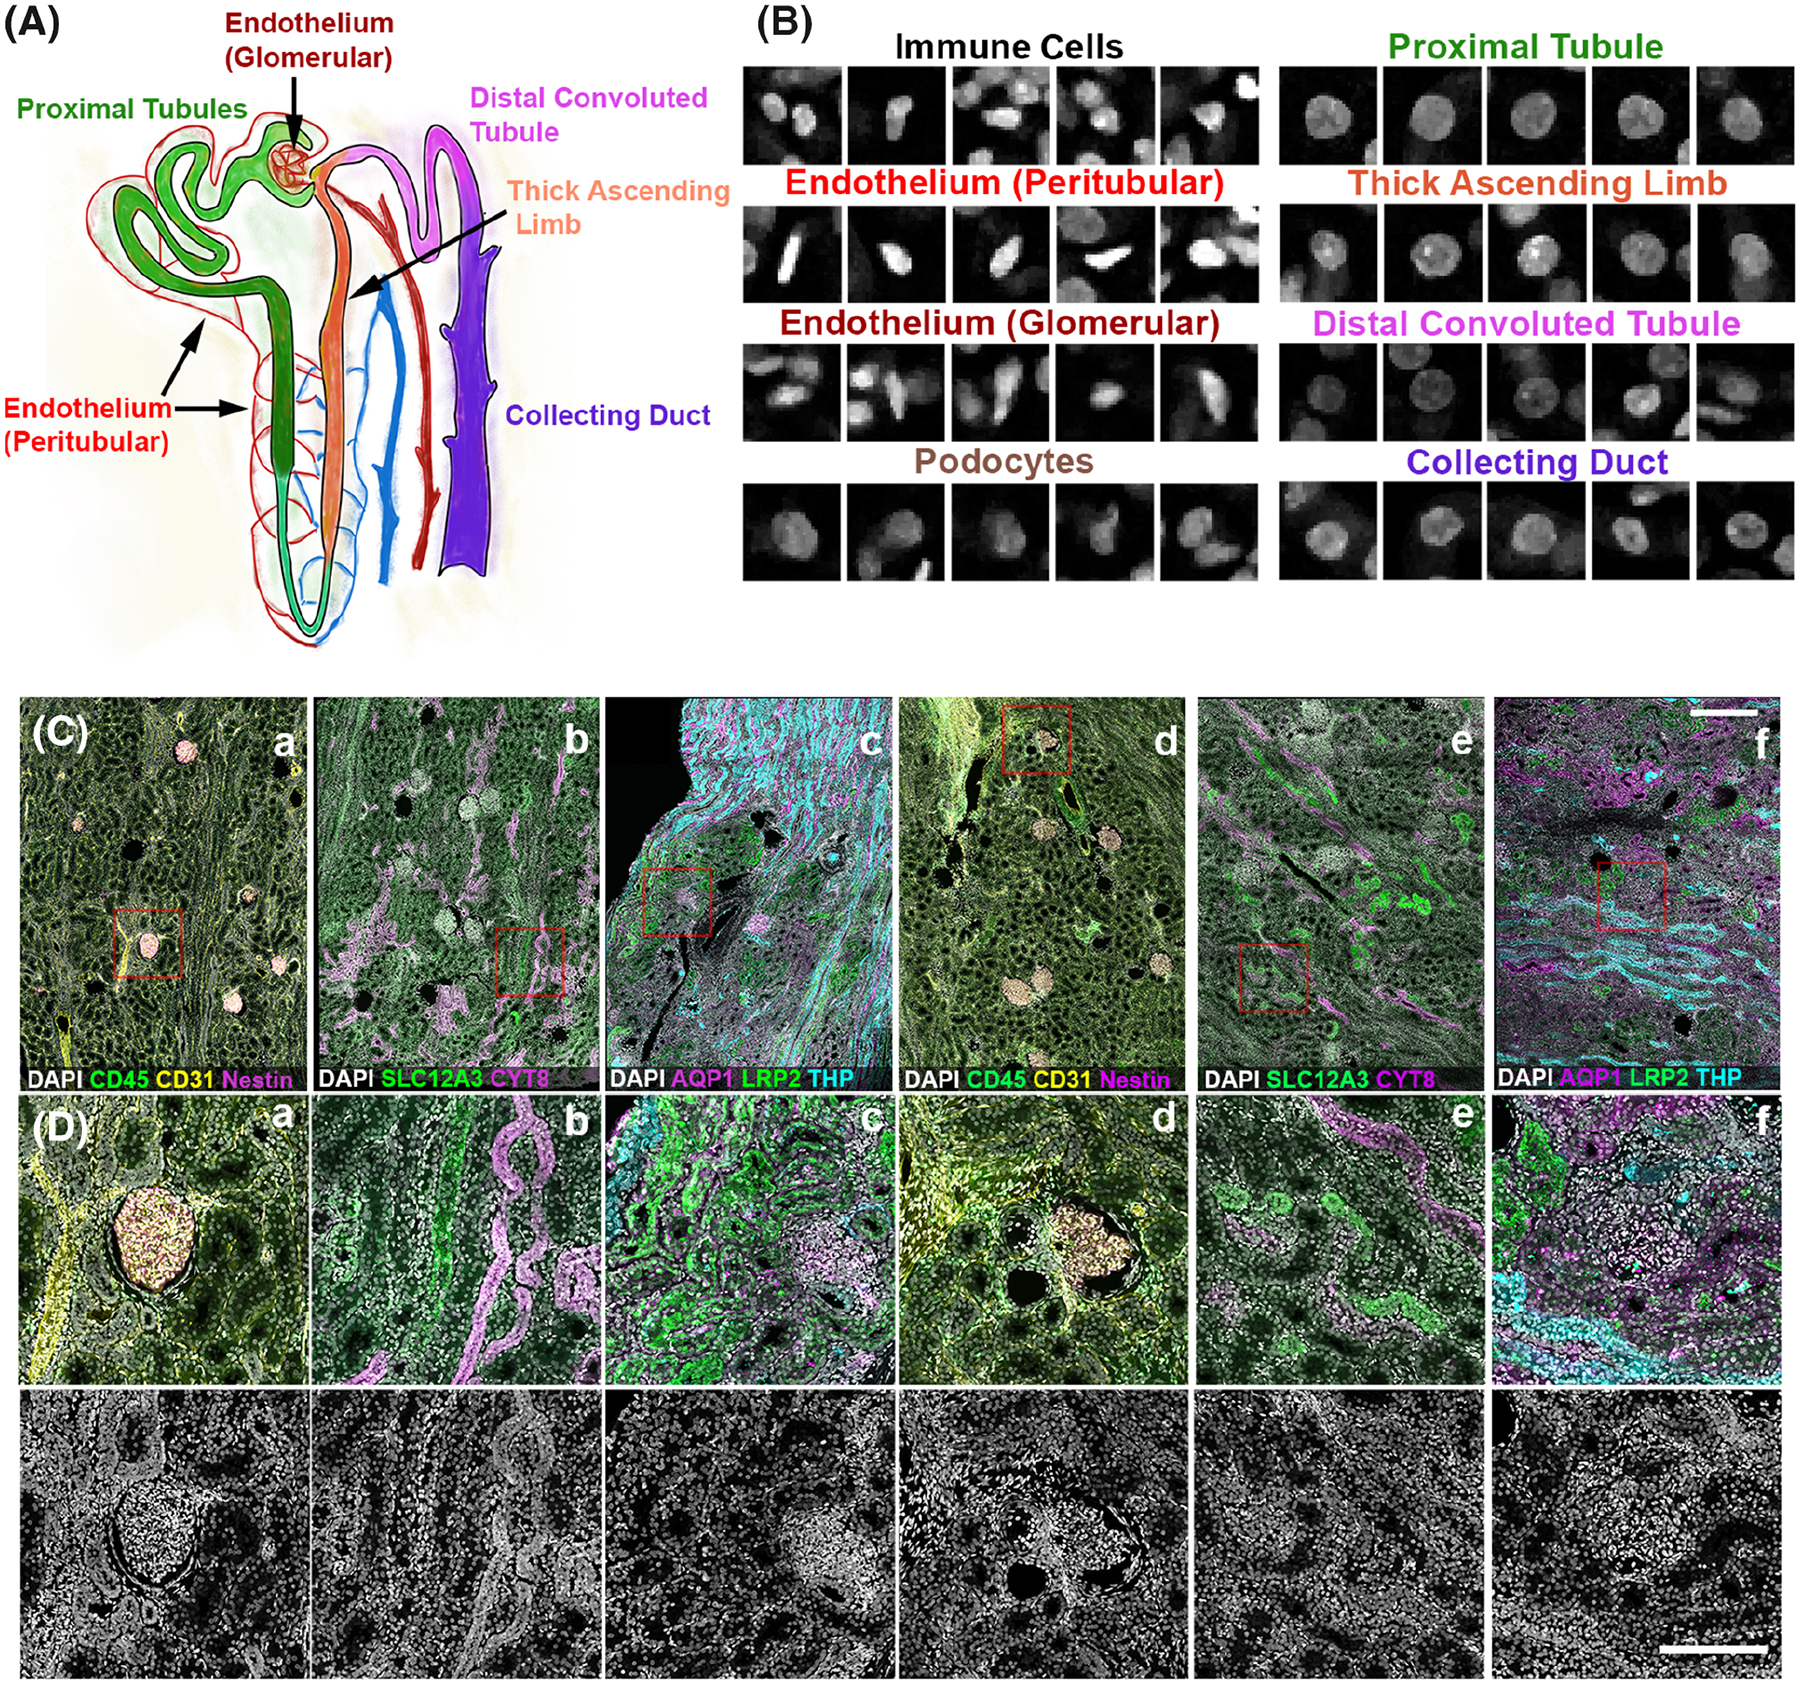
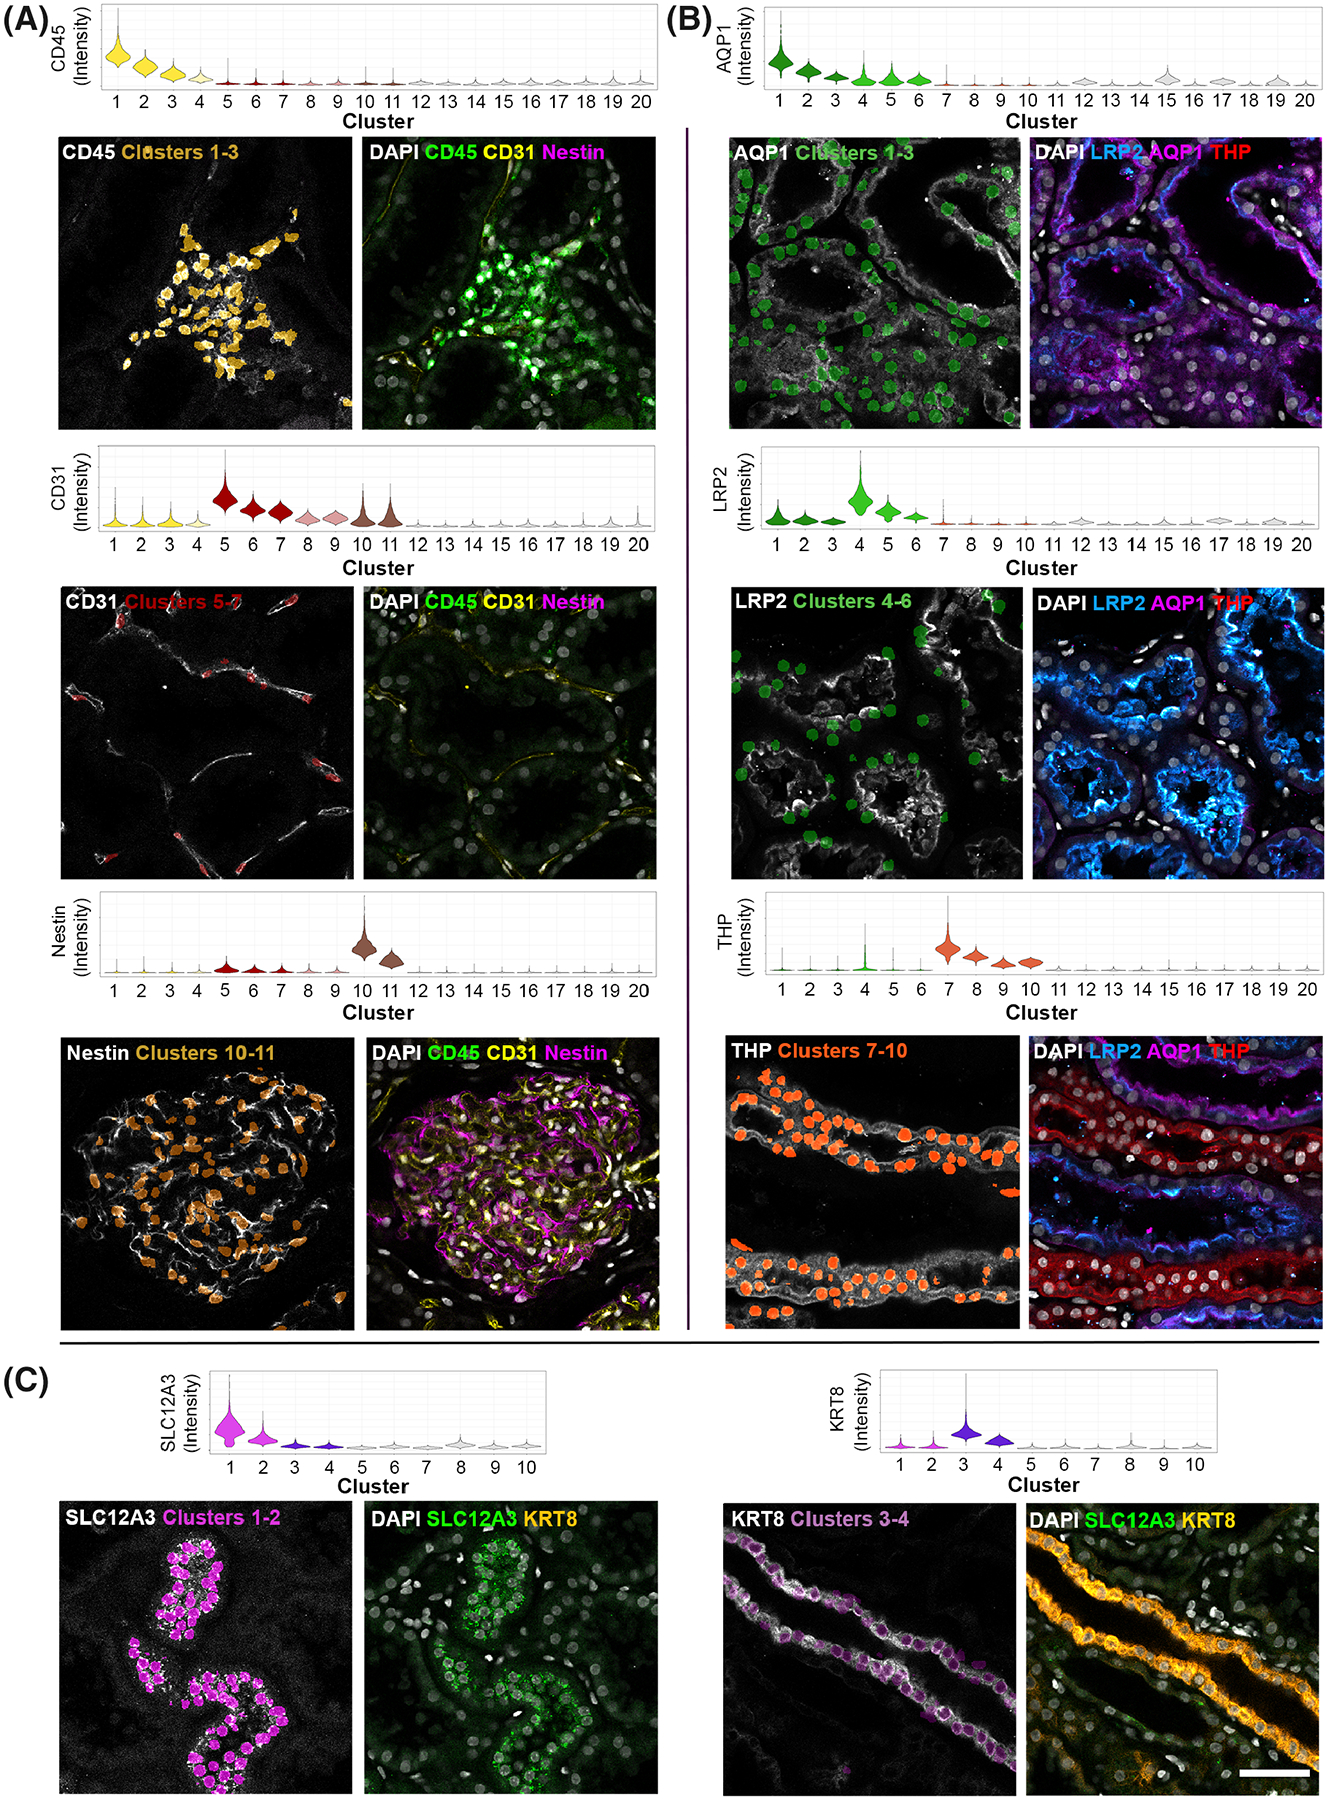
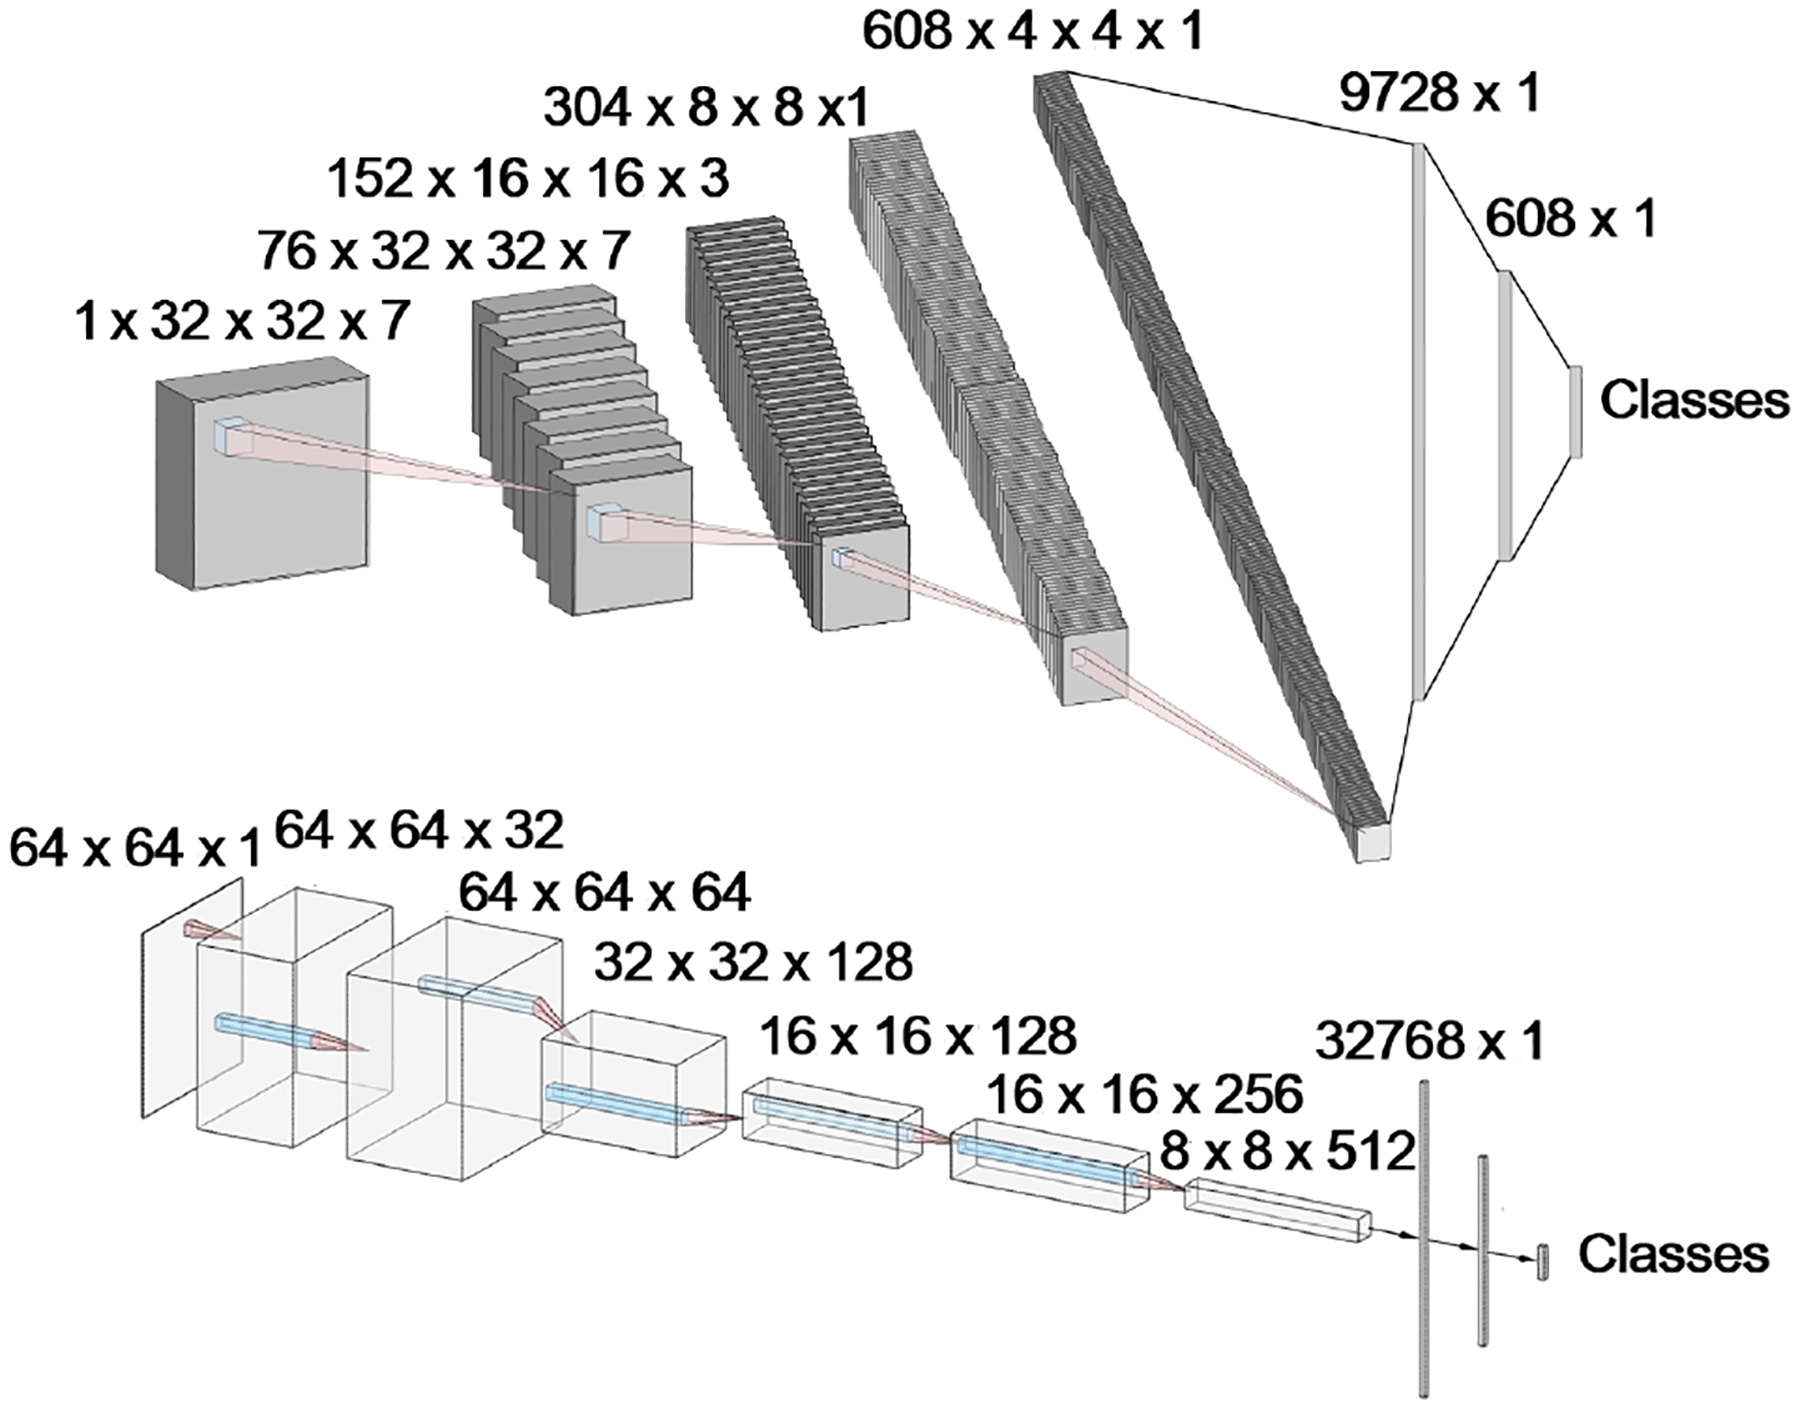
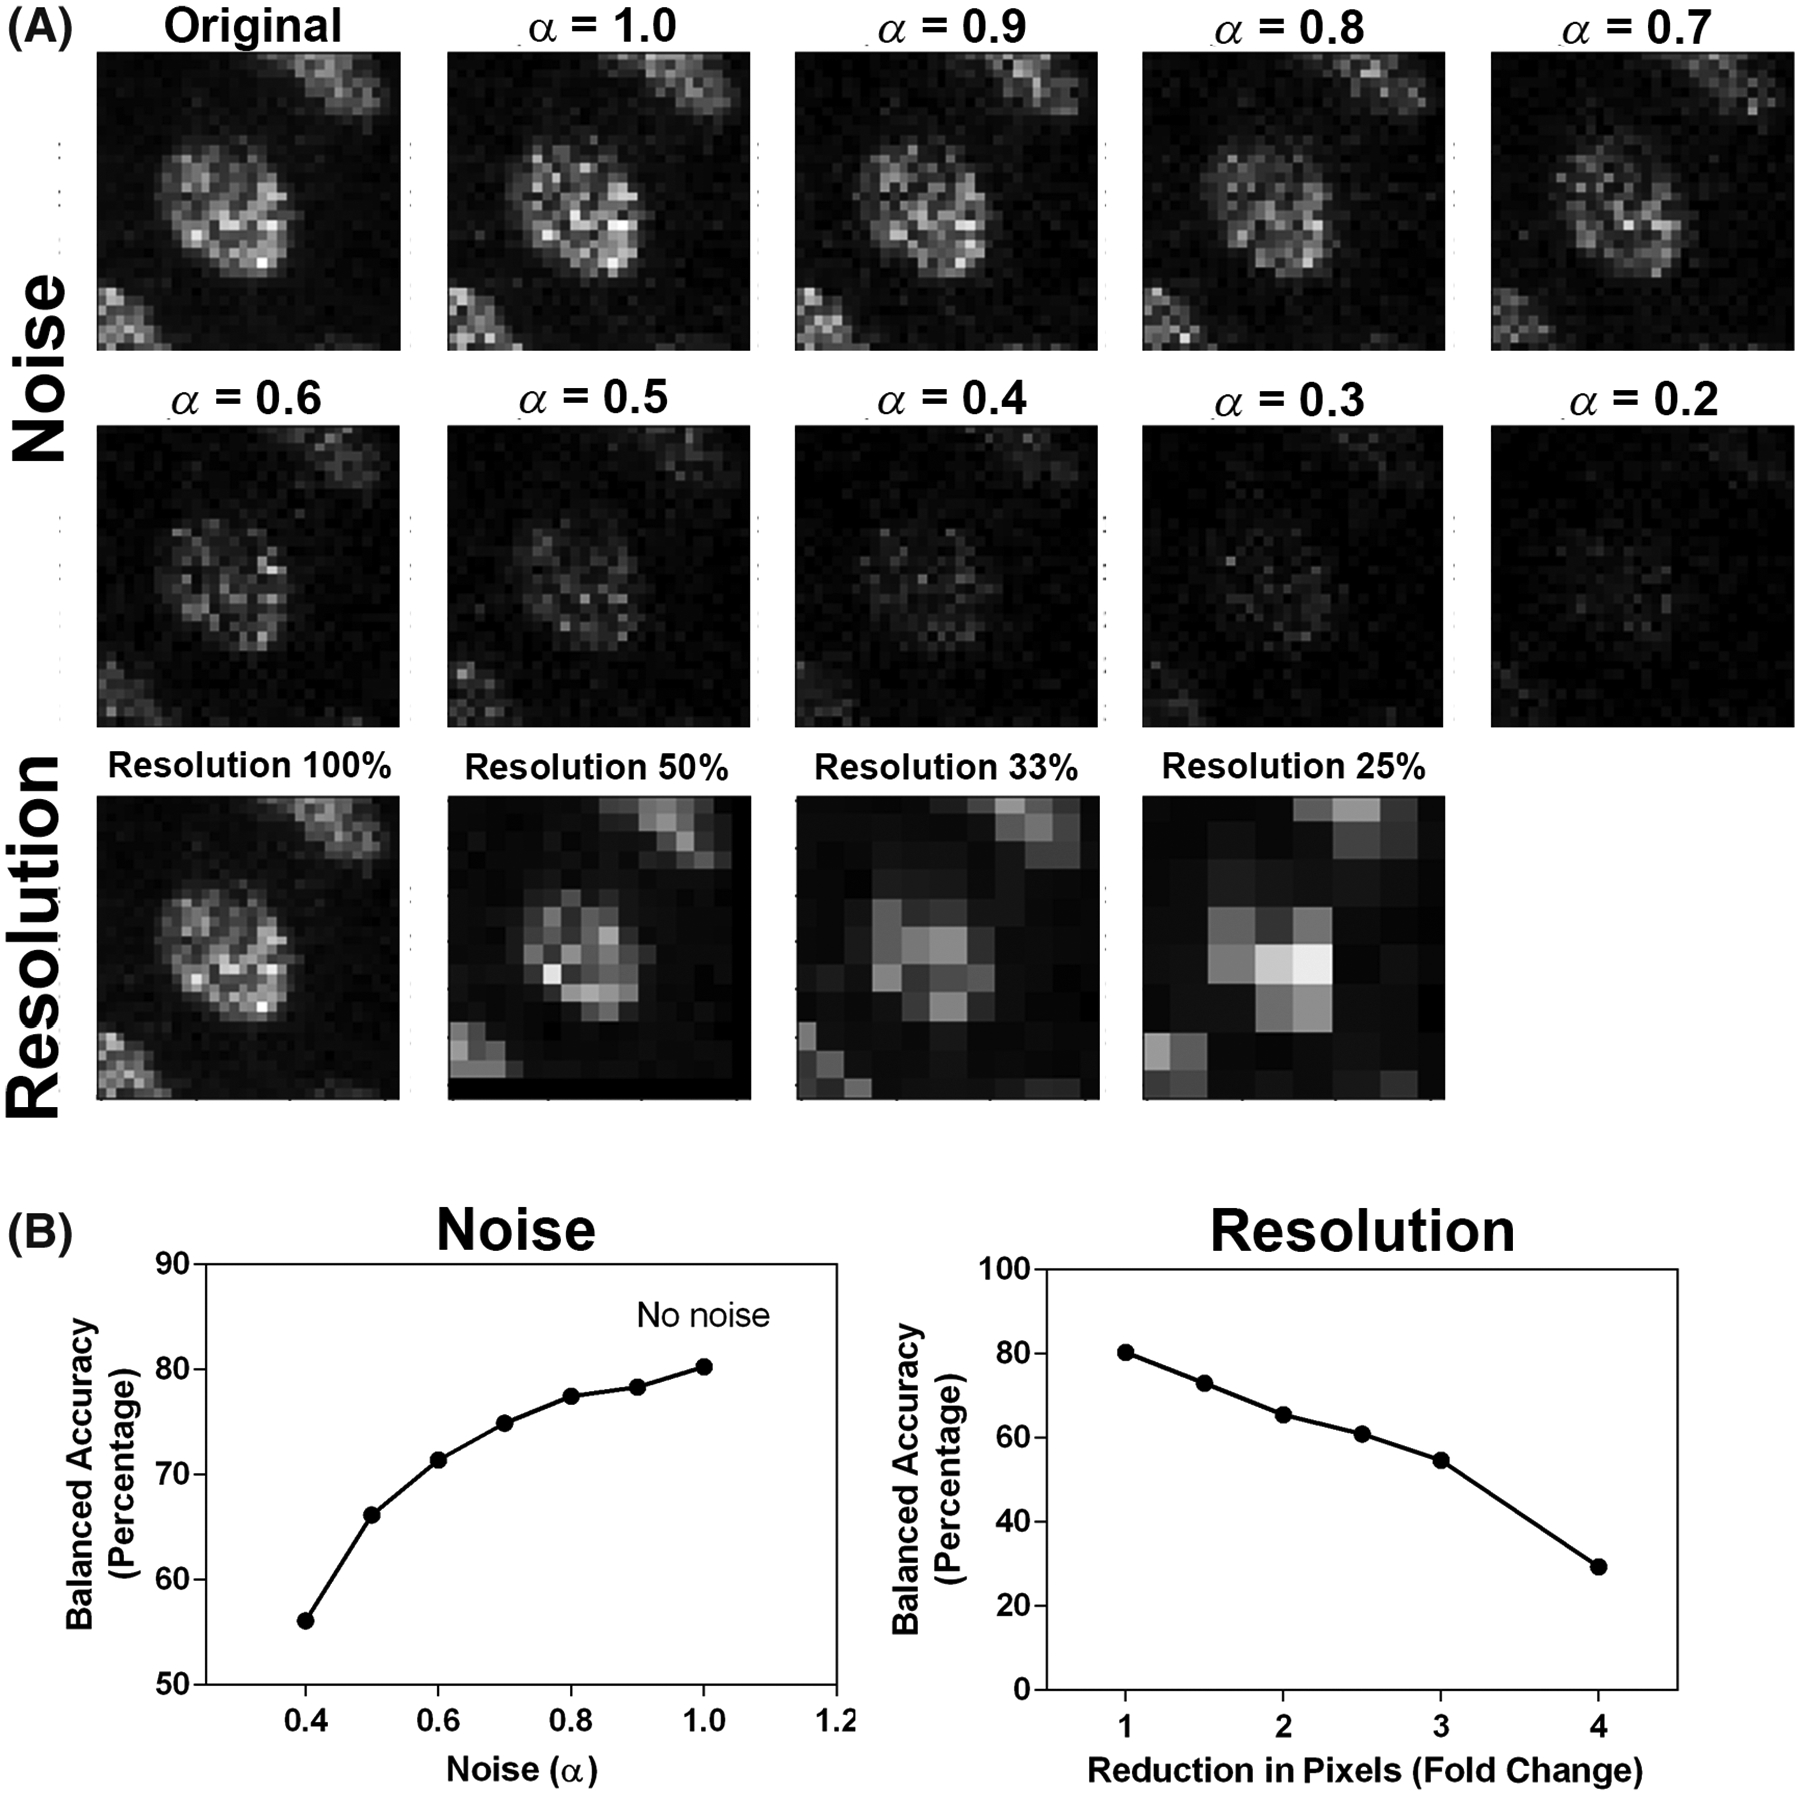
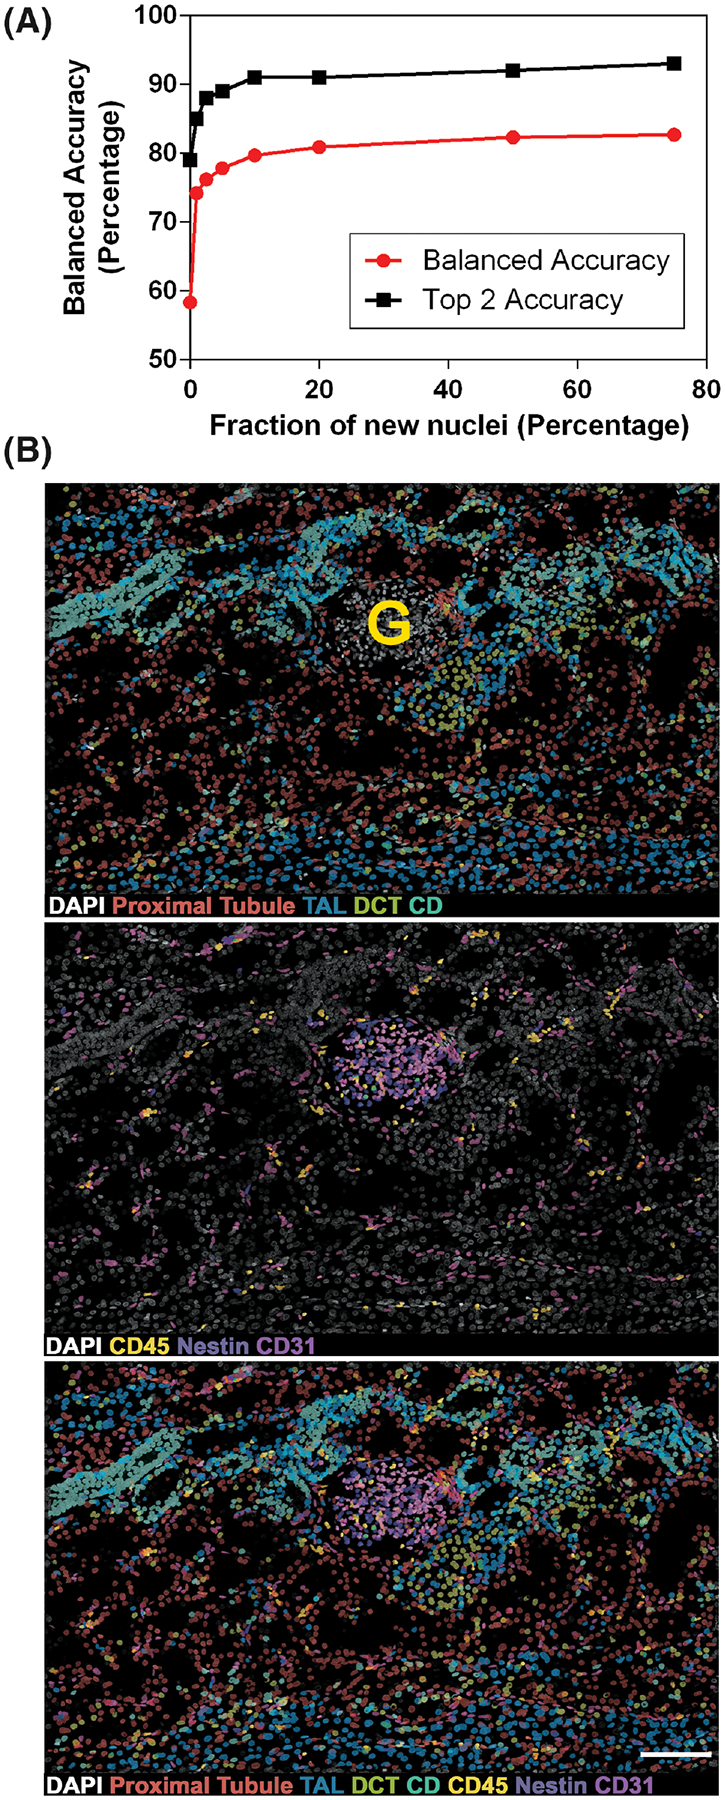
To understand the physiology and pathology of disease, capturing the heterogeneity of cell types within their tissue environment is fundamental. In such an endeavor, the human kidney presents a formidable challenge because its complex organizational structure is tightly linked to key physiological functions. Advances in imaging-based cell classification may be limited by the need to incorporate specific markers that can link classification to function. Multiplex imaging can mitigate these limitations, but requires cumulative incorporation of markers, which may lead to tissue exhaustion. Furthermore, the application of such strategies in large scale 3-dimensional (3D) imaging is challenging. Here, we propose that 3D nuclear signatures from a DNA stain, DAPI, which could be incorporated in most experimental imaging, can be used for classifying cells in intact human kidney tissue. We developed an unsupervised approach that uses 3D tissue cytometry to generate a large training dataset of nuclei images (NephNuc), where each nucleus is associated with a cell type label. We then devised various supervised machine learning approaches for kidney cell classification and demonstrated that a deep learning approach outperforms classical machine learning or shape-based classifiers. Specifically, a custom 3D convolutional neural network (NephNet3D) trained on nuclei image volumes achieved a balanced accuracy of 80.26%. Importantly, integrating NephNet3D classification with tissue cytometry allowed in situ visualization of cell type classifications in kidney tissue. In conclusion, we present a tissue cytometry and deep learning approach for in situ classification of cell types in human kidney tissue using only a DNA stain. This methodology is generalizable to other tissues and has potential advantages on tissue economy and non-exhaustive classification of different cell types.

Keywords: deep learning; human kidney; in situ classification; tissue cytometry.


Conflict of interest statement

CONFLICT OF INTEREST

The authors have no conflicts of interest to declare.

Figures

FIG 1
FIG 1
Uniqueness of nuclear morphology and staining signature of cell types found in the human kidney. A. Unique tubules and structures found in the nephron unit of the kidney. B. DAPI nuclear staining signature of various cell types identified manually based on specific markers (from C), location and morphology. C. 50 μm sections from human nephrectomy specimens were stained with three sets of markers all including DAPI in three different experiments. Tissue was imaged by tile scanning confocal microscopy and the images stitched together. D. Subregions from indicated red boxes in C. Bottom panels showing the DAPI channel only indicate the number and variety of nuclear morphology present in the cortex of the human kidney. Scale bars = 200 μm
FIG 2
FIG 2
Training set generation and validation of cell type images. 50 μm sections from human nephrectomy specimens were stained with three sets of markers all including DAPI in three different experiments. Tissue was imaged by tile scanning confocal microscopy and images stitched together and processed for tissue cytometry by VTEA. Cells were classified by X-means clustering based on their associated marker intensity by unsupervised machine learning as outlined in the methods. Classified cells were mapped by cluster color on violin plots. Mapping of identified clusters is displayed on the left of each panel and original volumes at shown at the right. Tissue sections were stained with CD45, CD31 and Nestin (A), AQP1, LRP2, and THP (B) and SLC12A3 and KRT8 (C)
FIG 3
FIG 3
CNN Architectures for NephNet2D and NephNet3D. CNNs were developed and implemented in PyTorch. A. 2D CNN architecture, where each layer is separated by one 3 × 3 convolution, batch normalization, leaky ReLU, and max pooling with a stride of 2 × 2 × 2. Linear layers are separated by dropout normalization (P = 0.5). B. 3D architecture where each layer consisted of two 3 × 3 × 3 convolutions, batch normalization, leaky ReLU, and max pooling with a stride of 2 × 2 × 2. Linear layers are separated by dropout normalization (P = 0.5)
FIG 4
FIG 4
Cell classification based on nuclear staining using NephNet2D or NephNet3D and the NephNuc datasets. The NephNuc datasets were split into training and testing. The eight classes used for training are epithelial cells from the proximal tubules (PT), thick ascending limbs (TAL), distal convoluted tubules (DCT), and collecting duct (CD), and other cells such as leukocytes (Leuk), podocytes (Podo) and endothelial cells (Endo) in glomeruli (G) or in the peritubular (P) space. The testing datasets were classified, and accuracy and confusion matrices were generated. A. The balanced accuracies of networks trained on 2D sections (left) or 3D volumes (right) containing a single nucleus. B. The balanced accuracies of networks trained on 2D sections (left) or 3D (right) containing a nucleus and surrounding nuclei. Asterisks indicate specific weaknesses in either the 2D or 3D classifications and the influence of surrounding nuclei on the classification. In all configurations except 3D nuclei with surrounding nuclei, there were errors in classifying podocytes as leukocytes and glomerular endothelium (blue and green asterisks) and between epithelial cells (red asterisks). Surrounding nuclei, context, improved classification of DCT and CD (magenta asterisks, compare A to B)
FIG 5
FIG 5
NephNet3D performance on noisy and lower resolution images. Increasing amounts of noise or decreasing resolution was used to generate testing datasets of 3D nuclei from the NephNuc3D with context data and classified with NephNet3D. A nearest neighbor approach was used for reducing the resolution of the image and noise was added by incorporating an α-factor described in the methods. A. Example of augmentation of training data with increasing noise or decreasing resolution for one nucleus. B. NephNet3D performance on testing data augmented by adding noise (left) or reducing the number of pixels to simulate less resolution (right)
FIG 6
FIG 6
NephNet3D classification of cells in new image volumes. A. Finetuning of NephNet3D with nuclei from specimen 3 labeled for the eight cell types. 10% of Specimen 3 for fine tuning of NephNet3D trained on Specimens 1 and 2 is sufficient for near-peak balanced accuracy on the entire specimen. The CNN was fine-tuned on varying amounts of data from a new specimen (nephrectomy) prior to being tested on the nuclei from the new specimen. B. An image volume of DAPI stained nuclei not previously used, from Specimen 1, was segmented by VTEA and classified with NephNet3D. Overlay of predicted labels from NephNet3D on the DAPI stained nuclei. The overlays in the top panel are for cells classified as: Proximal tubules (red), TAL (blue), DCT (yellow-green) and CD (blue-green); in the middle panel, leukocytes (CD45, yellow), podocytes (Nestin, purple), and endothelium (CD31, magenta and pink). Bottom panel shows DAPI stained nuclei with all predicted labels. G indicates a glomerulus. One hundred and seventy-seven segmented object/nuclei were manually classified by an expert. NephNet3D had an agreement of 67.9% (balanced accuracy as compared to expert classified nuclei). Maximum Z-projections are shown, scale bar = 100 μm

Similar articles

Cited by

References

    1. Nawata CM, Pannabecker TL. Mammalian urine concentration: A review of renal medullary architecture and membrane transporters. J Comp Physiol B 2018;188:899–918. - PMC - PubMed
    1. Park J, Shrestha R, Qiu C, Kondo A, Huang S, Werth M, Li M, Barasch J, Suszták K. Single-cell transcriptomics of the mouse kidney reveals potential cellular targets of kidney disease. Science 2018;360: 758–763. - PMC - PubMed
    1. Stewart BJ, Ferdinand JR, Young MD, Mitchell TJ, Loudon KW, Riding AM, Richoz N, Frazer GL, Staniforth JUL, Vieira Braga FA, et al.Spatiotemporal immune zonation of the human kidney. Science 2019; 365:1461–1466. - PMC - PubMed
    1. Taal MW, Brenner BM, Rector FC. Brenner and Rector’s the Kidney. 9th ed. Philadelphia: Elsevier/Saunders, 2012.
    1. Lake BB, Chen S, Hoshi M, Plongthongkum N, Salamon D, Knoten A, Vijayan A, Venkatesh R, Kim EH, Gao D, et al.A single-nucleus RNA-sequencing pipeline to decipher the molecular anatomy and pathophysiology of human kidneys. Nat Commun 2019;10:2832. - PMC - PubMed

Publication types

LinkOut - more resources