

The DISTANCE study: Determining the impact of social distancing on trauma epidemiology during the COVID-19 epidemic-An interrupted time-series analysis
- PMID: 33252457
- PMCID: PMC7979514
- DOI: 10.1097/TA.0000000000003044
The DISTANCE study: Determining the impact of social distancing on trauma epidemiology during the COVID-19 epidemic-An interrupted time-series analysis
Abstract
Background: The large-scale social distancing efforts to reduce SARS-CoV-2 transmission have dramatically changed human behaviors associated with traumatic injuries. Trauma centers have reported decreases in trauma volume, paralleled by changes in injury mechanisms. We aimed to quantify changes in trauma epidemiology at an urban Level I trauma center in a county that instituted one of the earliest shelter-in-place orders to inform trauma care during future pandemic responses.
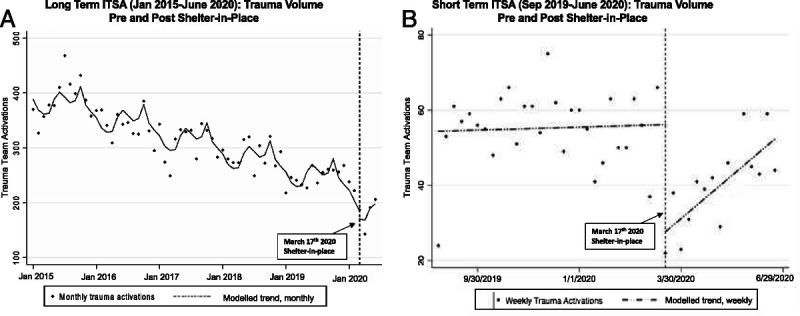
Methods: A single-center interrupted time-series analysis was performed to identify associations of shelter-in-place with trauma volume, injury mechanisms, and patient demographics in San Francisco, California. To control for short-term trends in trauma epidemiology, weekly level data were analyzed 6 months before shelter-in-place. To control for long-term trends, monthly level data were analyzed 5 years before shelter-in-place.
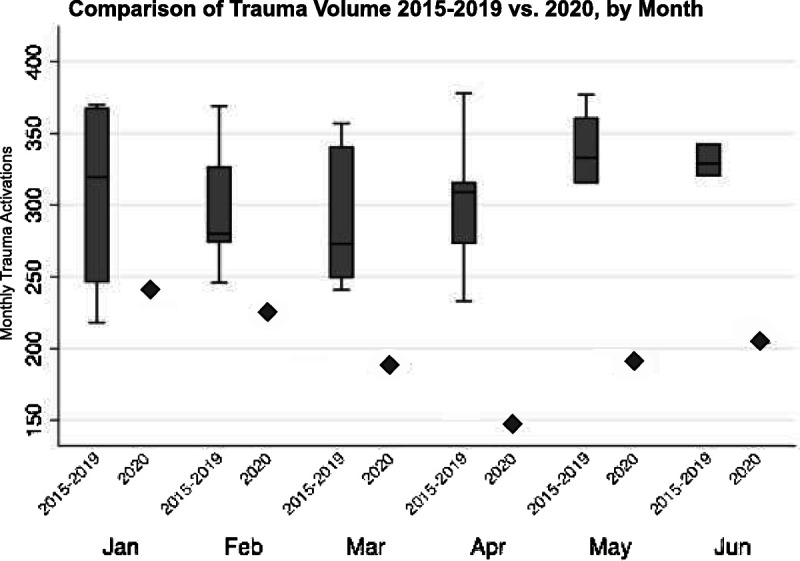
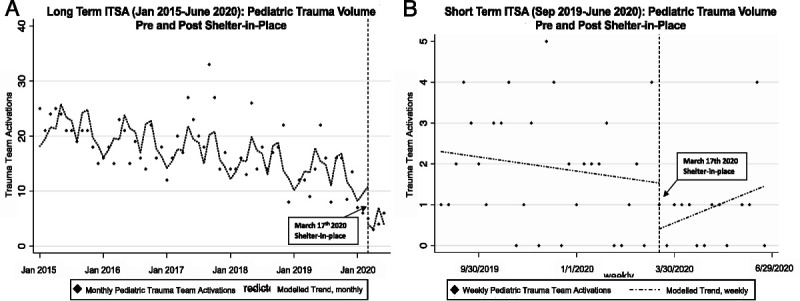
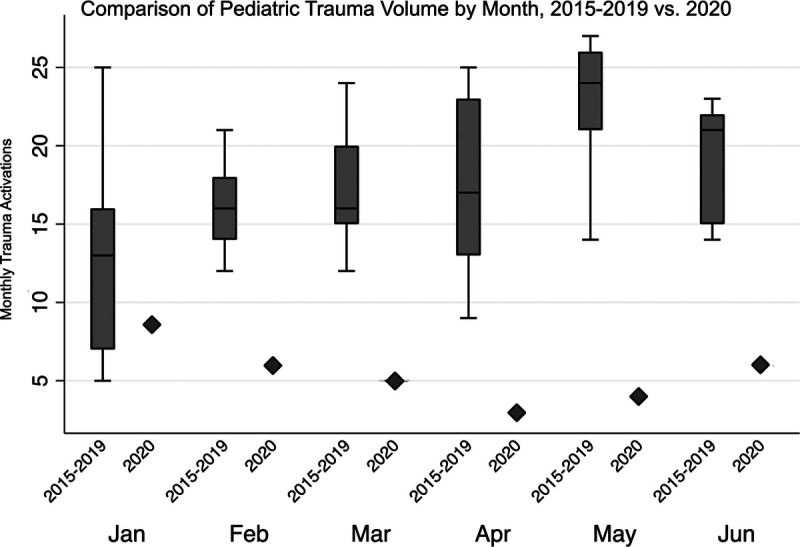
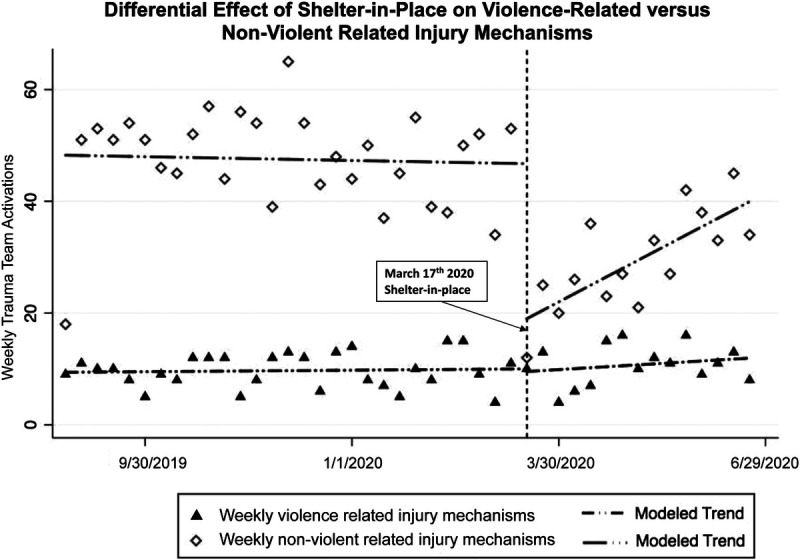
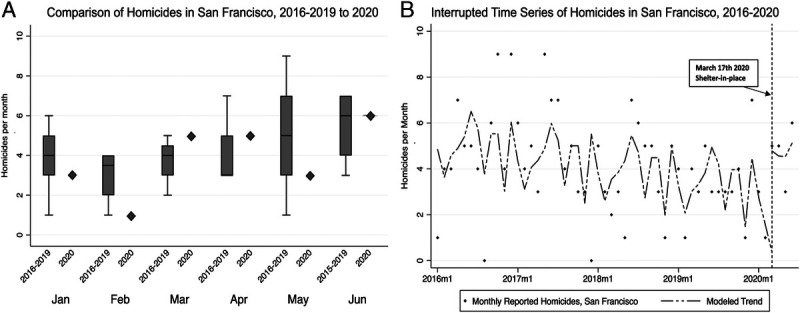
Results: Trauma volume decreased by 50% in the week following shelter-in-place (p < 0.01), followed by a linear increase each successive week (p < 0.01). Despite this, trauma volume for each month (March-June 2020) remained lower compared with corresponding months for all previous 5 years (2015-2019). Pediatric trauma volume showed similar trends with initial decreases (p = 0.02) followed by steady increases (p = 0.05). Reductions in trauma volumes were due entirely to changes in nonviolent injury mechanisms, while violence-related injury mechanisms remained unchanged (p < 0.01).
Conclusion: Although the shelter-in-place order was associated with an overall decline in trauma volume, violence-related injuries persisted. Delineating and addressing underlying factors driving persistent violence-related injuries during shelter-in-place orders should be a focus of public health efforts in preparation for future pandemic responses.
Level of evidence: Epidemiological study, level III.
Copyright © 2020 Wolters Kluwer Health, Inc. All rights reserved.
Figures
Similar articles
-
The Impact of the first COVID-19 shelter-in-place announcement on social distancing, difficulty in daily activities, and levels of concern in the San Francisco Bay Area: A cross-sectional social media survey.PLoS One. 2021 Jan 14;16(1):e0244819. doi: 10.1371/journal.pone.0244819. eCollection 2021. PLoS One. 2021. PMID: 33444363 Free PMC article.
-
Impact of COVID-19 and Shelter in Place on Volume and Type of Traumatic Injuries.West J Emerg Med. 2021 Sep 2;22(5):1060-1066. doi: 10.5811/westjem.2021.5.49968. West J Emerg Med. 2021. PMID: 34546881 Free PMC article.
-
"Safer at home": The effect of the COVID-19 lockdown on epidemiology, resource utilization, and outcomes at a large urban trauma center.J Trauma Acute Care Surg. 2021 Apr 1;90(4):708-713. doi: 10.1097/TA.0000000000003061. J Trauma Acute Care Surg. 2021. PMID: 33347094 Free PMC article.
-
Increased proportion of physical child abuse injuries at a level I pediatric trauma center during the Covid-19 pandemic.Child Abuse Negl. 2021 Jun;116(Pt 2):104756. doi: 10.1016/j.chiabu.2020.104756. Epub 2020 Sep 25. Child Abuse Negl. 2021. PMID: 33004213 Free PMC article.
-
The Impact of the COVID-19 Shelter-in-Place Order on Traumatic Brain Injuries in San Francisco, California.J Emerg Med. 2023 Dec;65(6):e479-e486. doi: 10.1016/j.jemermed.2023.07.002. Epub 2023 Jul 21. J Emerg Med. 2023. PMID: 37914599 Review.
Cited by
-
Pediatric trauma volume fell during the initial COVID-19 wave but rebounded to new highs for the remainder of 2020.J Inj Violence Res. 2024 Mar 13;16(1):61-70. doi: 10.5249/jivr.v16i1.1771. Online ahead of print. J Inj Violence Res. 2024. PMID: 38521978 Free PMC article.
-
Effect of COVID-19 Pandemic on Incidence and Mortality Rate Due to Road Traffic Injury in Shiraz.Bull Emerg Trauma. 2022 Jul;10(3):110-115. doi: 10.30476/BEAT.2022.95640.1365. Bull Emerg Trauma. 2022. PMID: 35991373 Free PMC article.
-
Impact of the COVID-19 Pandemic on Trauma Encounters.Am Surg. 2023 Mar;89(3):434-439. doi: 10.1177/00031348211029858. Epub 2021 Jul 4. Am Surg. 2023. PMID: 34219502 Free PMC article.
-
Letter to the Editor Regarding "Viscoelastic Hemostatic Assays and Outcomes in Traumatic Brain Injury: A Systematic Literature Review".World Neurosurg. 2022 Oct;166:291-293. doi: 10.1016/j.wneu.2022.04.040. World Neurosurg. 2022. PMID: 36192854 Free PMC article. No abstract available.
-
The mental health toll of COVID-19: significant increase in admissions to ICU for voluntary self-inflicted injuries after the beginning of the pandemic.Int J Ment Health Syst. 2023 Jul 15;17(1):22. doi: 10.1186/s13033-023-00590-x. Int J Ment Health Syst. 2023. PMID: 37454115 Free PMC article.
References
-
- Kopf D. Traffic collisions are plummeting in several US cities. Aust Q. March 24, 2020. Available from: https://qz.com/1822492/traffic-accidents-are-plummeting-because-of-the-p.... Accessed April 16 2020.
-
- Nieuwenhuijsen M. COVID-19 and the City: how is the pandemic affecting urban health? ISGlobal. 2020;25. Available from: https://www.isglobal.org/en/healthisglobal/-/custom-blog-portlet/covid-1.... Accessed April 16, 2020.
-
- University of California, Davis. Special Report (Update): Impact of COVID-19 Mitigation on Numbers and Costs of California Traffic Crashes. https://roadecology.ucdavis.edu/. Published April 2020. Accessed May 15, 2020.
Publication types
MeSH terms
Grants and funding
LinkOut - more resources
Full Text Sources
Medical
Research Materials
Miscellaneous
