. 2021 Mar 1;78(3):275-284.
doi: 10.1001/jamaneurol.2020.4471.

Trends in Relative Incidence and Prevalence of Dementia Across Non-Hispanic Black and White Individuals in the United States, 2000-2016

Affiliations

Trends in Relative Incidence and Prevalence of Dementia Across Non-Hispanic Black and White Individuals in the United States, 2000-2016

Melinda C Power et al. JAMA Neurol. .

Abstract

Importance: In the US, dementia risk is higher in non-Hispanic Black individuals than in non-Hispanic White individuals. To evaluate progress toward reducing such disparities, tracking secular trends in racial disparities in dementia prevalence is essential.

Objective: To examine whether relative racial disparities in dementia prevalence or incidence have changed in the US from 2000 to 2016.

Design, settings, and participants: The Health and Retirement Study (HRS) is a nationally representative study of adults 50 years or older. New participants are recruited every 6 years, and study visits occur biennially. Approximately 17 000 to 22 000 respondents have been surveyed at each wave since 2000, achieving response rates of 81% to 89%. Data for this cohort study were obtained from non-Hispanic White and non-Hispanic Black participants aged 70 years and older from the 2000 to 2016 waves. For analyses of secular trends in racial disparities in dementia prevalence, each HRS wave was considered separately (range of participants meeting eligibility criteria in each wave, 6322-7579). For analyses of secular trends in racial disparities in dementia incidence, 7 subcohorts were created (range of participants meeting eligibility criteria in each subcohort, 5322-5961) following up people without dementia for 4 years from subcohort baseline visits in 2000, 2002, 2004, 2006, 2008, 2010, and 2012. Data were analyzed from October 2019 to August 2020.

Exposures: Race based on self-response to closed-ended survey questions.

Main outcomes and measures: Dementia status was determined using 3 algorithms with similar sensitivity and specificity across non-Hispanic White and Black participants. Disparities were characterized using ratio measures.

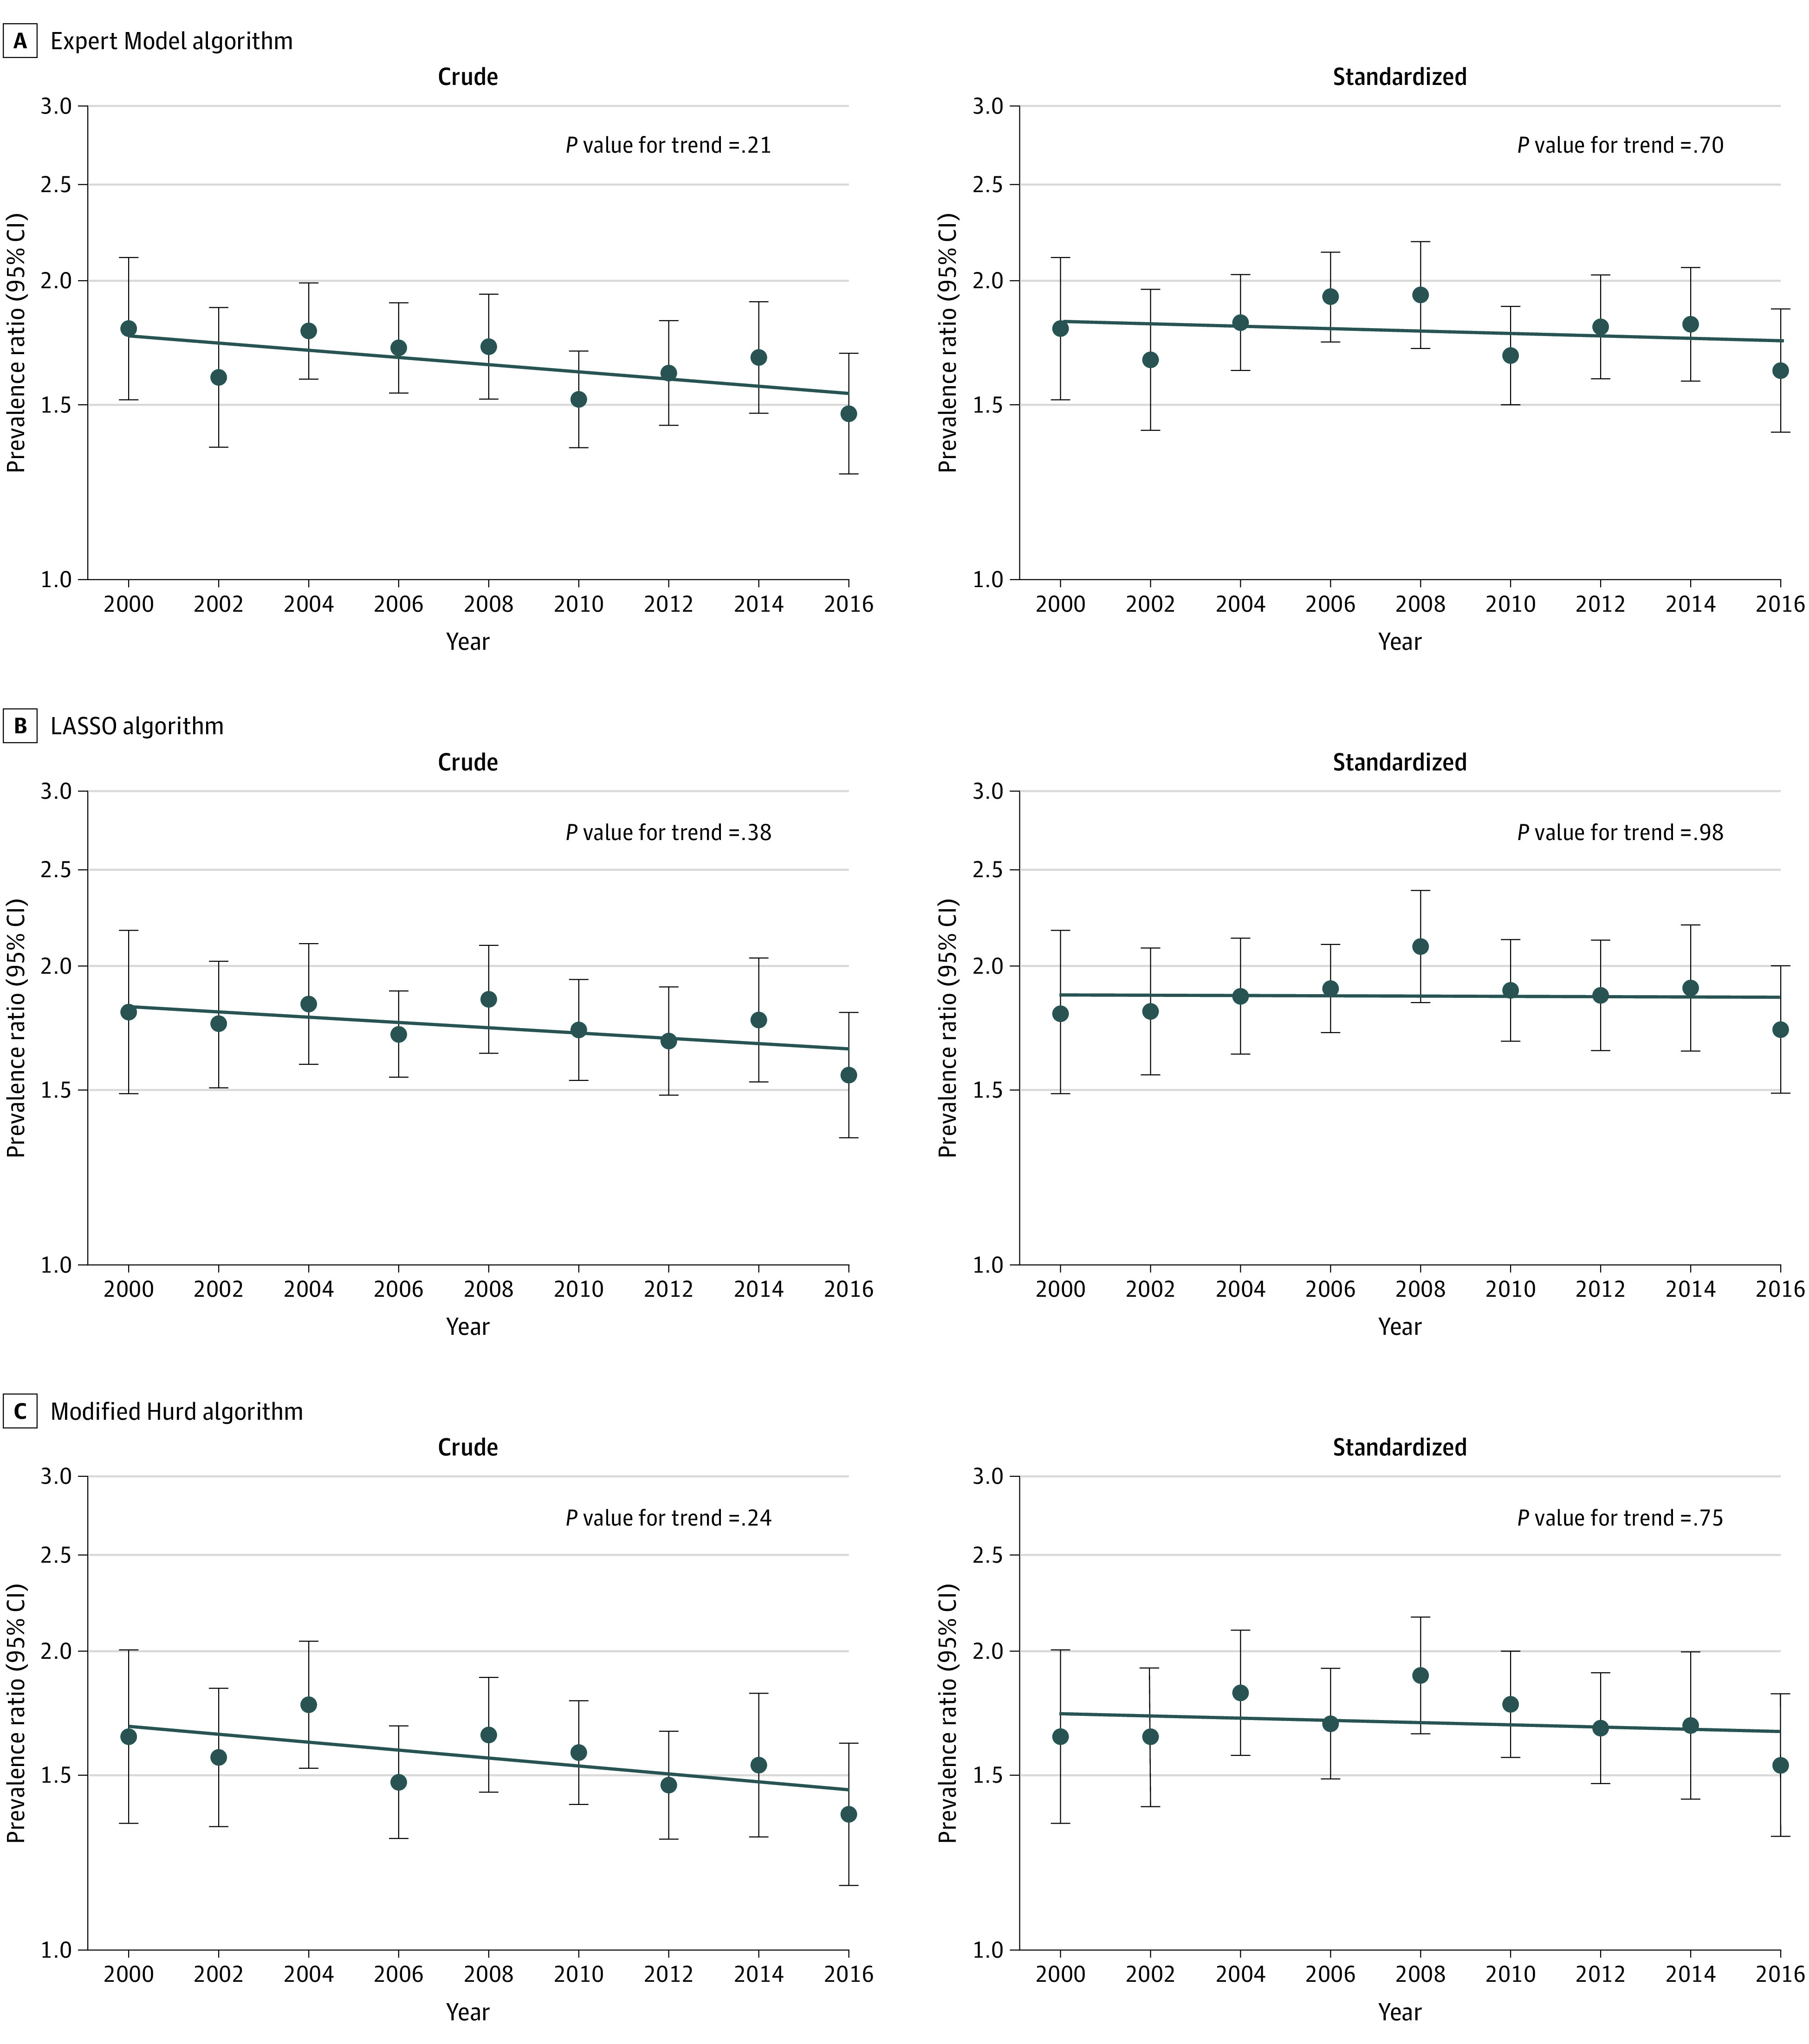
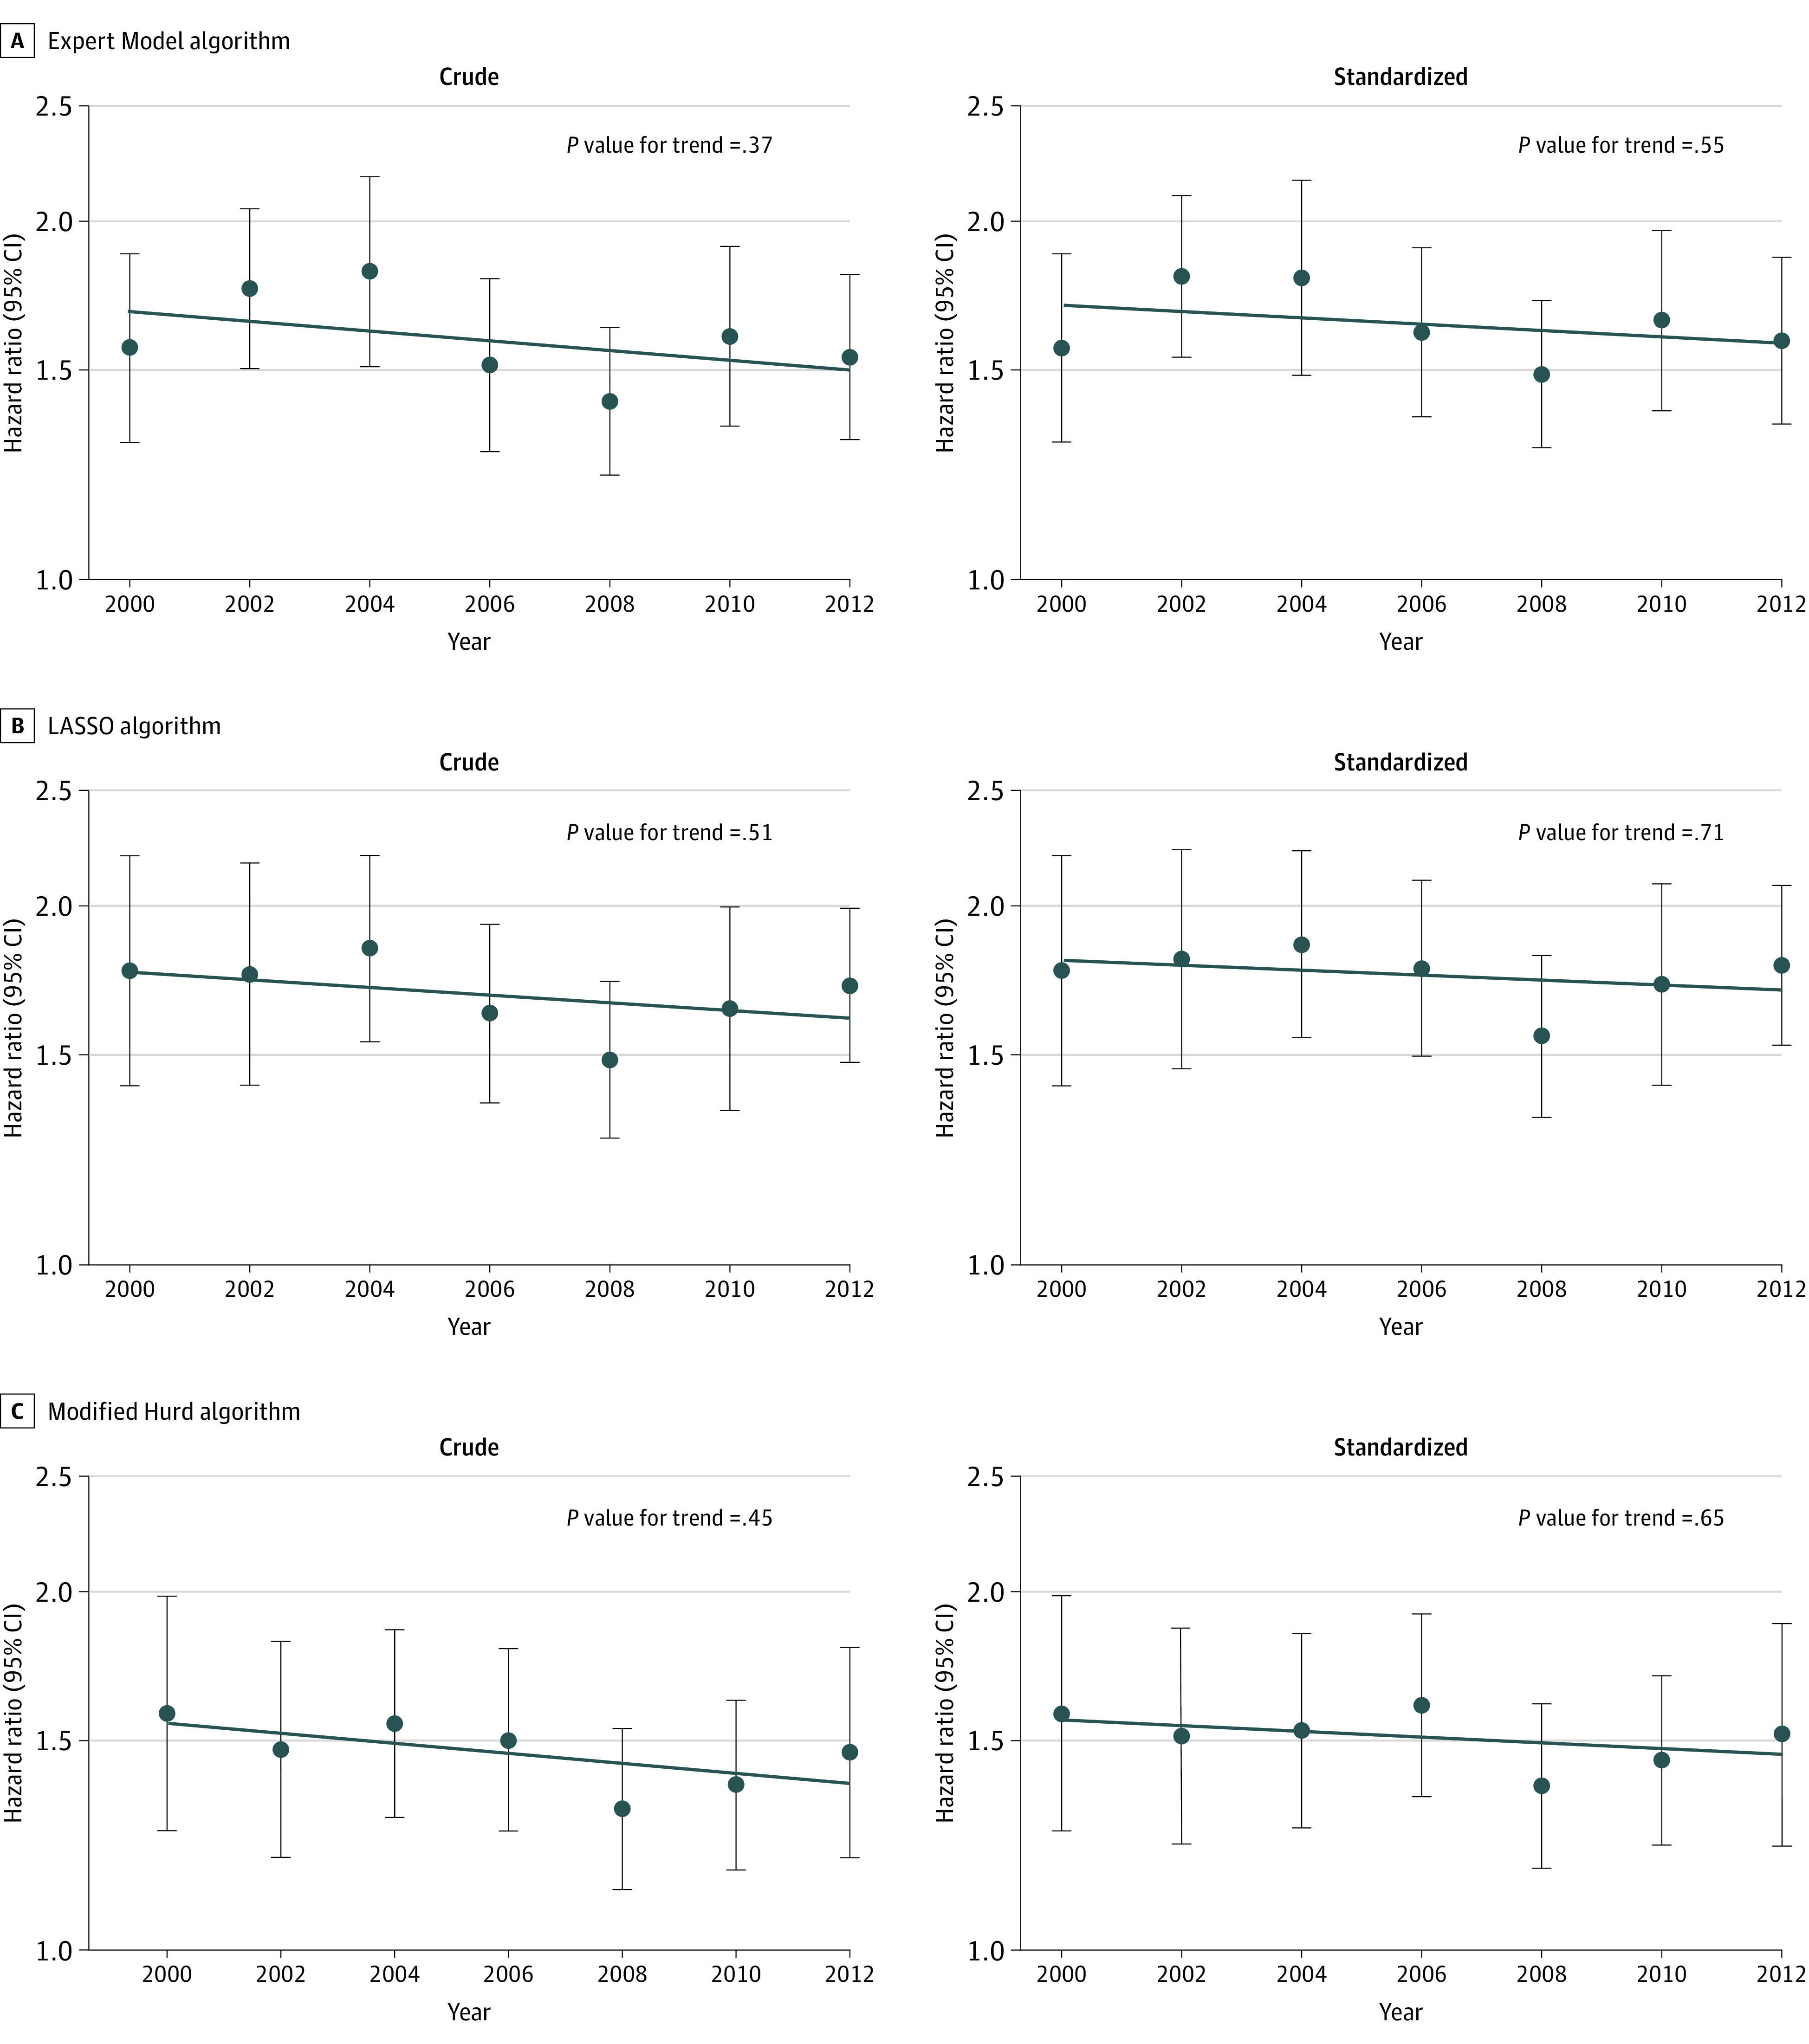
Results: In this study, the mean age and percentage of male participants eligible for inclusion in analyses of racial disparities in dementia prevalence increased over time among non-Hispanic White participants (from 78.2 years and 40% in 2000 to 78.7 years and 44% in 2016) but remained steady in non-Hispanic Black participants during the same period (from 78.0 years and 37% in 2000 to 77.9 years and 38% in 2016). Prevalence ratios comparing Black and White participants ranged from approximately 1.5 to 1.9 across algorithms and years, whereas hazard ratios ranged from approximately 1.4 to 1.8. Although results suggest stable or declining dementia risk overall, there was no evidence suggesting change in relative racial disparities in dementia prevalence or incidence during follow-up.

Conclusions and relevance: This study did not find evidence to suggest that the ratio of dementia risk across Black and White individuals changed in the US between 2000 and 2016. Additional efforts to identify and mitigate the source of these disparities is warranted.


Conflict of interest statement

Conflict of Interest Disclosures: Dr Power reported receiving grants from the National Institutes of Health during the conduct of the study. No other disclosures were reported.

Figures

Figure 1.
Figure 1.. Relative Prevalence of Dementia Across Non-Hispanic Black and White Individuals in the US by Year, 2000 to 2016
A, Expert Model algorithm; B, LASSO algorithm; and C, Modified Hurd algorithm. Each panel represents a set of analyses using a different algorithmic approach to ascertain dementia. Within each panel, the figure on the left represents crude analyses, and the figure on the right represents standardized analyses. Dots and error bars within each panel represent the prevalence ratio and associated 95% CI in each year comparing the prevalence of dementia in non-Hispanic Black participants to the prevalence of dementia in non-Hispanic White participants, where non-Hispanic White participants are the reference group (eg, in the top left panel, the first dot on the left represents the prevalence ratio in 2000). The line plotted across years represents the trend in relative differences in dementia prevalence across racial groups (ie, the trend over time in these prevalence ratios). The P value for trend tests whether the observed trend is significantly different from the null hypothesis of no trend. All analyses are weighted using Health and Retirement Study sampling weights and account for geographical stratification and clustering when estimating standard errors. Standardized analyses are standardized to the race-specific age and sex distribution in the year 2000.
Figure 2.
Figure 2.. Relative Incidence of Dementia Across Non-Hispanic Black and White Individuals in the US by Year, 2000 to 2016
A, Expert Model algorithm; B, LASSO algorithm; and C, Modified Hurd algorithm. Each panel represents a set of analyses using a different algorithmic approach to ascertain dementia. Within each panel, the figure on the left represents crude analyses, and the figure on the right represents standardized analyses. Dots and error bars within each panel represent the hazard ratio (HR) and associated 95% CI in each subcohort (identified by its baseline year) comparing the incidence of dementia in non-Hispanic Black participants to the incidence of dementia in non-Hispanic White participants, where non-Hispanic White participants are the reference group (eg, in the top left panel, the first dot on the left represents the HR for the 2000-2006 subcohort). The line plotted across years represents the trend in relative differences in dementia incidence across racial groups (ie, the trend over time in these HRs). The P value for trend tests whether the observed trend is significantly different from the null hypothesis of no trend. All analyses are weighted using Health and Retirement Study sampling weights and account for geographical stratification and clustering when estimating standard errors. Standardized analyses are standardized to the race-specific age and sex distribution in the year 2000.

Comment in

Similar articles

Cited by

References

    1. Fitzpatrick AL, Kuller LH, Ives DG, et al. . Incidence and prevalence of dementia in the Cardiovascular Health Study. J Am Geriatr Soc. 2004;52(2):195-204. doi:10.1111/j.1532-5415.2004.52058.x - DOI - PubMed
    1. Rajan KB, Weuve J, Barnes LL, Wilson RS, Evans DA. Prevalence and incidence of clinically diagnosed Alzheimer’s disease dementia from 1994 to 2012 in a population study. Alzheimers Dement. 2019;15(1):1-7. doi:10.1016/j.jalz.2018.07.216 - DOI - PMC - PubMed
    1. Steenland K, Goldstein FC, Levey A, Wharton W. A meta-analysis of Alzheimer’s disease incidence and prevalence comparing African-Americans and Caucasians. J Alzheimers Dis. 2016;50(1):71-76. doi:10.3233/JAD-150778 - DOI - PMC - PubMed
    1. Williams DR, Lawrence JA, Davis BA. Racism and health: evidence and needed research. Annu Rev Public Health. 2019;40:105-125. doi:10.1146/annurev-publhealth-040218-043750 - DOI - PMC - PubMed
    1. Hill CV, Pérez-Stable EJ, Anderson NA, Bernard MA. The National Institute on Aging health disparities research framework. Ethn Dis. 2015;25(3):245-254. doi:10.18865/ed.25.3.245 - DOI - PMC - PubMed

Publication types