. 2021 May 1;148(9):2274-2288.
doi: 10.1002/ijc.33416. Epub 2020 Dec 11.

Circulating insulin-like growth factor-I, total and free testosterone concentrations and prostate cancer risk in 200 000 men in UK Biobank

Affiliations

Circulating insulin-like growth factor-I, total and free testosterone concentrations and prostate cancer risk in 200 000 men in UK Biobank

Eleanor L Watts et al. Int J Cancer. .

Abstract

Insulin-like growth factor-I (IGF-I) and testosterone have been implicated in prostate cancer aetiology. Using data from a large prospective full-cohort with standardised assays and repeat blood measurements, and genetic data from an international consortium, we investigated the associations of circulating IGF-I, sex hormone-binding globulin (SHBG), and total and calculated free testosterone concentrations with prostate cancer incidence and mortality. For prospective analyses, risk was estimated using multivariable-adjusted Cox regression in 199 698 male UK Biobank participants. Hazard ratios (HRs) were corrected for regression dilution bias using repeat hormone measurements from a subsample. Two-sample Mendelian randomisation (MR) analysis of IGF-I and risk used genetic instruments identified from UK Biobank men and genetic outcome data from the PRACTICAL consortium (79 148 cases and 61 106 controls). We used cis- and all (cis and trans) SNP MR approaches. A total of 5402 men were diagnosed with and 295 died from prostate cancer (mean follow-up 6.9 years). Higher circulating IGF-I was associated with elevated prostate cancer diagnosis (HR per 5 nmol/L increment = 1.09, 95% CI 1.05-1.12) and mortality (HR per 5 nmol/L increment = 1.15, 1.02-1.29). MR analyses also supported the role of IGF-I in prostate cancer diagnosis (cis-MR odds ratio per 5 nmol/L increment = 1.34, 1.07-1.68). In observational analyses, higher free testosterone was associated with a higher risk of prostate cancer (HR per 50 pmol/L increment = 1.10, 1.05-1.15). Higher SHBG was associated with a lower risk (HR per 10 nmol/L increment = 0.95, 0.94-0.97), neither was associated with prostate cancer mortality. Total testosterone was not associated with prostate cancer. These findings implicate IGF-I and free testosterone in prostate cancer development and/or progression.

Keywords: IGF-I; Mendelian randomisation; prospective analysis; prostate cancer; testosterone.


Conflict of interest statement

Dr Holmes has collaborated with Boehringer Ingelheim in research, and in adherence to the University of Oxford's Clinical Trial Service Unit & Epidemiological Studies Unit (CSTU) staff policy, did not accept personal honoraria or other payments from pharmaceutical companies. All other authors have no competing interests to declare.

Figures
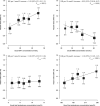
FIGURE 1
FIGURE 1
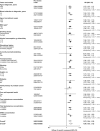
Hazard ratios of incident prostate cancer by fifths of usual serum hormone concentrations in UK Biobank. HRs are stratified by region (10 UK cancer registry regions) and age at recruitment (<45, 45‐49, 50‐54, 55‐59, 60‐64 and ≥65 years) and adjusted for age (underlying time variable), Townsend deprivation score (fifths, unknown), racial/ethnic group (white, mixed background, Asian, black, other unknown), height (<170, ≥170‐<175, ≥175‐<180, ≥180 cm, unknown), lives with a wife or partner (no, yes), BMI (<25, ≥25‐<30, ≥30‐<35, ≥35 kg/m2), cigarette smoking (never, former, light smoker, heavy smoker, current unknown and smoking status unknown), alcohol consumption (non‐drinkers, <1‐<10, ≥10‐<20, ≥20 g ethanol/day, unknown) and diabetes (no, yes and unknown). HRs for trend are adjusted for regression dilution bias. The boxes represent the HRs; the vertical lines represent the 95% CIs, with the size inversely proportional to the variance of the logarithm of the HR. The numbers above the vertical lines are point estimates for HRs, and the numbers below are the number of prostate cancer diagnoses. BMI, body mass index; CI, confidence intervals; HR, hazard ratio; IGF‐I, insulin‐like growth factor‐I; SHBG, sex hormone‐binding globulin
FIGURE 2
FIGURE 2
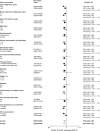
Hazard ratios of prostate cancer mortality by fifths of usual serum hormone concentrations in the UK Biobank. HRs are stratified by region (10 UK cancer registry regions) and age at recruitment (<45, 45‐49, 50‐54, 55‐59, 60‐64, and ≥65 years) and adjusted for age (underlying time variable), Townsend deprivation score (fifths, unknown), racial/ethnic group (white, mixed background, Asian, black, other, unknown), height (<170, ≥170‐<175, ≥175‐<180, ≥180 cm, unknown), lives with a wife or partner (no, yes), BMI (<25, ≥25‐<30, ≥30‐<35, ≥35 kg/m2), cigarette smoking (never, former, light smoker, heavy smoker, current unknown and smoking status unknown), alcohol consumption (non‐drinkers, <1‐<10, ≥10‐<20, ≥20 g ethanol/day, unknown) and diabetes (no, yes and unknown). HRs for trend are adjusted for regression dilution bias. The boxes represent the HRs; the vertical lines represent the 95% CIs, with the size inversely proportional to the variance of the logarithm of the HR. The numbers above the vertical lines are point estimates for HRs, and the numbers below are the number of prostate cancer deaths. BMI, body mass index; CI, confidence intervals; HR, hazard ratio; IGF‐I, insulin‐like growth factor‐I; SHBG, sex hormone‐binding globulin
FIGURE 3
FIGURE 3
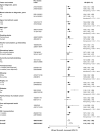
Hazard ratios of incident prostate cancer per 5 nmol/L increase in serum IGF‐I concentration by subgroup in the UK Biobank. Cox models based on competing risks and compared the risk coefficients and SEs in the two subgroups and tested using a χ 2 test of heterogeneity. For non‐case specific factors, heterogeneity was assessed using a χ 2 interaction term. HRs are stratified by region (10 UK cancer registry regions) and age at recruitment (<45, 45‐49, 50‐54, 55‐59, 60‐64, and ≥65 years) and adjusted for age (underlying time variable), Townsend deprivation score (fifths, unknown), racial/ethnic group (white, mixed background, Asian, black, other, unknown), height (<170, ≥170‐<175, ≥175‐<180, ≥180 cm, unknown), lives with a wife or partner (no, yes), BMI (<25, ≥25‐<30, ≥30‐<35, ≥35 kg/m2), cigarette smoking (never, former, light smoker, heavy smoker, current unknown and smoking status unknown), alcohol consumption (non‐drinkers, <1‐<10, ≥10‐<20, ≥20 g ethanol/day, unknown) and diabetes (no, yes and unknown). The boxes represent the HRs; the horizontal lines represent the 95% CIs, with the size inversely proportional to the variance of the logarithm of the HR. (1) Not adjusted for regression dilution bias. (2) Adjusted for regression dilution bias. BMI, body mass index; CI, confidence intervals; HR, hazard ratio; IGF‐I, insulin‐like growth factor‐I; PCa, prostate cancer
FIGURE 4
FIGURE 4
Hazard ratio of incident prostate cancer per 10 nmol/L increase in serum SHBG concentration by subgroup in the UK Biobank. Cox models based on competing risks and compared the risk coefficients and SEs in the two subgroups and tested using a χ 2 test of heterogeneity. For non‐case‐specific factors, heterogeneity was assessed using a χ 2 interaction term. HRs are stratified by region (10 UK cancer registry regions) and age at recruitment (<45, 45‐49, 50‐54, 55‐59, 60‐64 and ≥65 years) and adjusted for age (underlying time variable), and adjusted for Townsend deprivation score (fifths, unknown), racial/ethnic group (white, mixed background, Asian, black, other, unknown), height (<170, ≥170‐<175, ≥175‐<180, ≥180 cm, unknown), lives with a wife or partner (no, yes), BMI (<25, ≥25‐<30, ≥30‐<35, ≥35 kg/m2), cigarette smoking (never, former, light smoker, heavy smoker, current unknown and smoking status unknown), alcohol consumption (non‐drinkers, <1‐<10, ≥10‐<20, ≥20 g ethanol/day, unknown) and diabetes (no, yes and unknown). The boxes represent the HRs; the horizontal lines represent the 95% CIs, with the size inversely proportional to the variance of the logarithm of the HR. (1) Not adjusted for regression dilution bias. (2) Adjusted for regression dilution bias. BMI, body mass index; CI, confidence intervals; HR, hazard ratio; PCa, prostate cancer; SHBG, sex hormone‐binding globulin
FIGURE 5
FIGURE 5
Hazard ratio of incident prostate cancer per 50 pmol/L increase in serum free testosterone concentration by subgroup in the UK Biobank. Cox models based on competing risks and compared the risk coefficients and SEs in the two subgroups and tested using a χ 2 test of heterogeneity. For non‐case‐specific factors, heterogeneity was assessed using a χ 2 interaction term. HRs are stratified by region (10 UK cancer registry regions) and age at recruitment (<45, 45‐49, 50‐54, 55‐59, 60‐64, and ≥65 years) and adjusted for age (underlying time variable), and adjusted for Townsend deprivation score (fifths, unknown), racial/ethnic group (white, mixed background, Asian, black, other, unknown), height (<170, ≥170‐<175, ≥175‐<180, ≥180 cm, unknown), lives with a wife or partner (no, yes), BMI (<25, ≥25‐<30, ≥30‐<35, ≥35 kg/m2), cigarette smoking (never, former, light smoker, heavy smoker, current unknown and smoking status unknown), alcohol consumption (non‐drinkers, <1‐<10, ≥10‐<20, ≥20 g ethanol/day, unknown) and diabetes (no, yes and unknown). The boxes represent the HRs; the horizontal lines represent the 95% CIs, with the size inversely proportional to the variance of the logarithm of the HR. (1) Not adjusted for regression dilution bias. (2) Adjusted for regression dilution bias. BMI, body mass index; CI, confidence intervals; HR, hazard ratio; PCa, prostate cancer

Similar articles

Cited by

References

    1. Ferlay J, Ervik M, Lam F, et al. Global Cancer Observatory: Cancer Today. International Agency for Research on Cancer: Lyon, France; 2018.
    1. Pollak M. The insulin and insulin‐like growth factor receptor family in neoplasia: an update. Nat Rev Cancer. 2012;12:159‐169. - PubMed
    1. Morgentaler A, Traish AM. Shifting the paradigm of testosterone and prostate cancer: the saturation model and the limits of androgen‐dependent growth. Eur Urol. 2009;55:310‐320. - PubMed
    1. Travis RC, Appleby PN, Martin RM, et al. A meta‐analysis of individual participant data reveals an association between circulating levels of IGF‐I and prostate cancer risk. Cancer Res. 2016;76:2288‐2300. - PMC - PubMed
    1. Major JM, Laughlin GA, Kritz‐Silverstein D, Wingard DL, Barrett‐Connor E. Insulin‐like growth factor‐I and cancer mortality in older men. J Clin Endocrinol Metab. 2010;95:1054‐1059. - PMC - PubMed

Publication types