. 2020 Nov 30;16(11):e1008434.
doi: 10.1371/journal.pcbi.1008434. eCollection 2020 Nov.

Pre-existing resistance in the latent reservoir can compromise VRC01 therapy during chronic HIV-1 infection

Affiliations

Pre-existing resistance in the latent reservoir can compromise VRC01 therapy during chronic HIV-1 infection

Ananya Saha et al. PLoS Comput Biol. .

Abstract

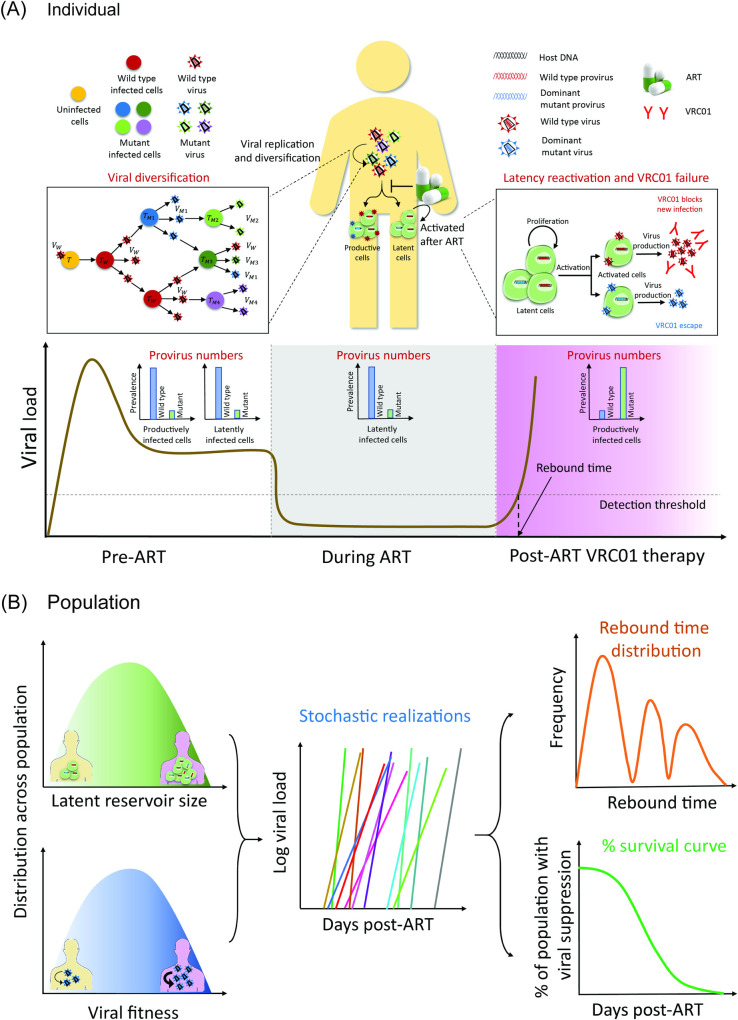
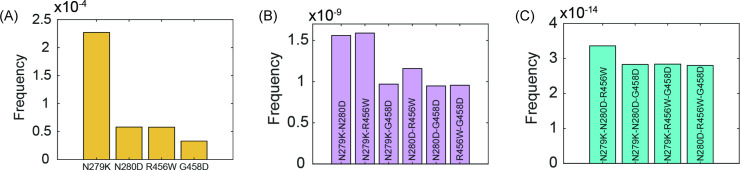
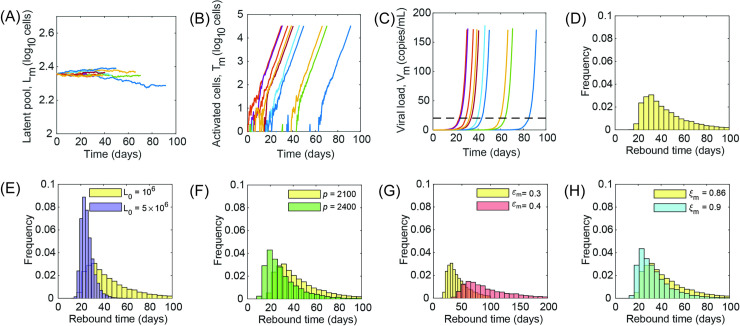
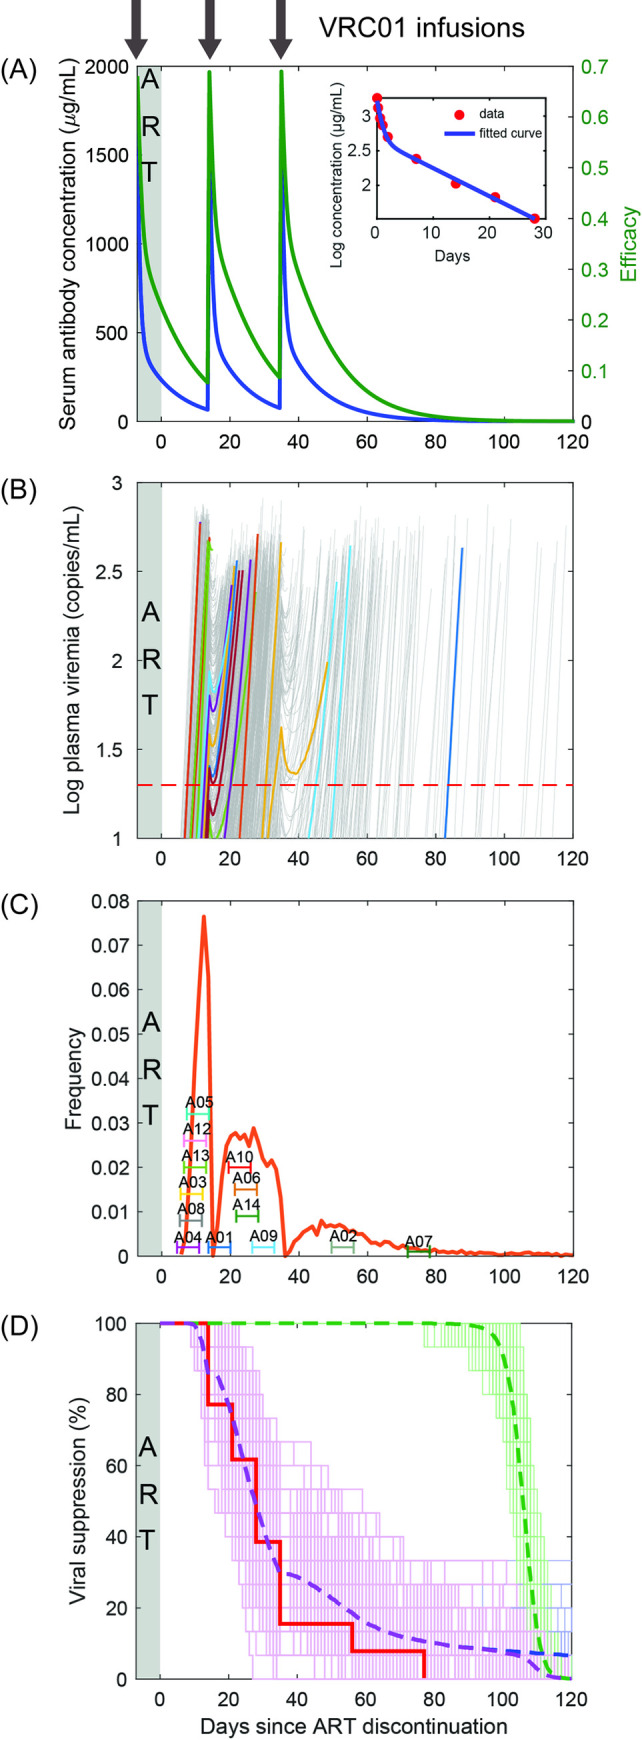
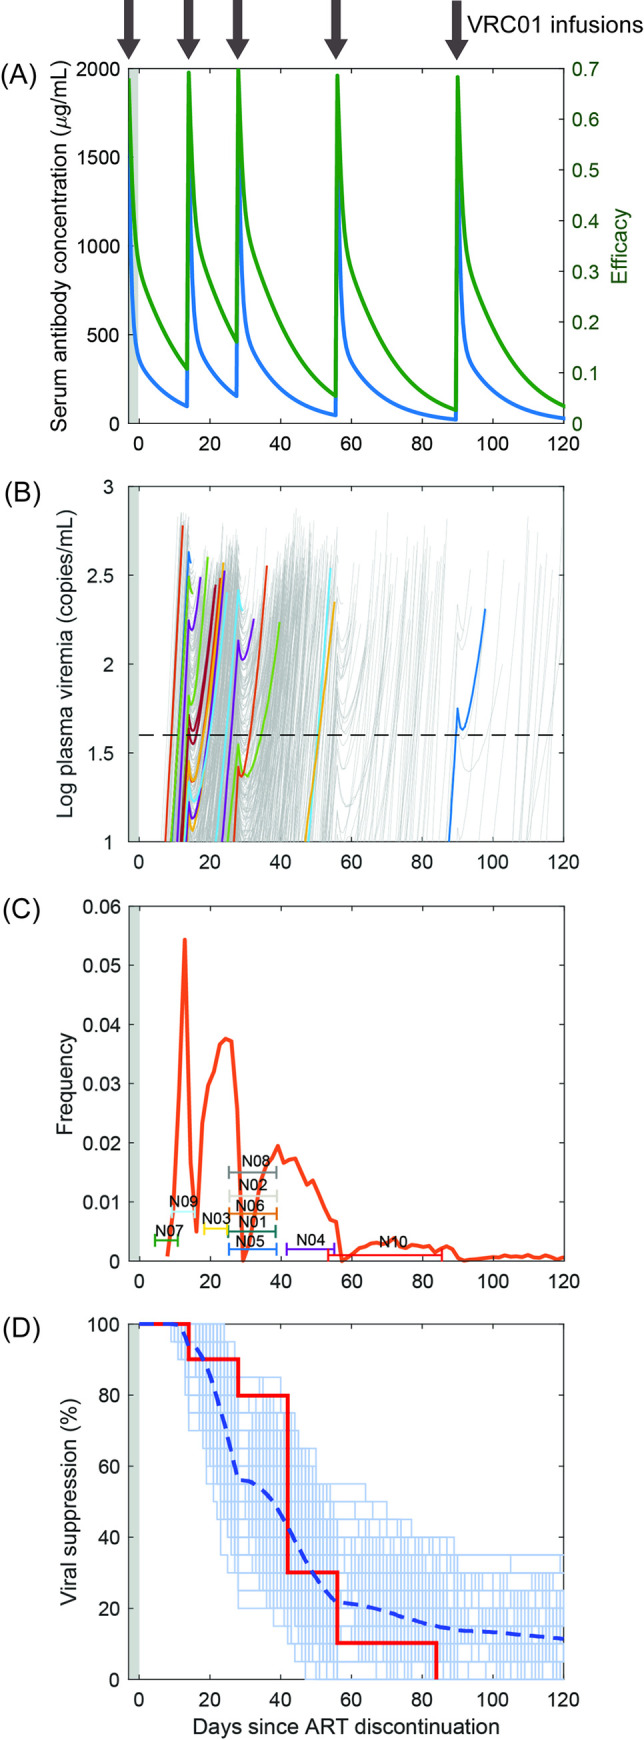
Passive immunization with broadly neutralizing antibodies (bNAbs) of HIV-1 appears a promising strategy for eliciting long-term HIV-1 remission. When administered concomitantly with the cessation of antiretroviral therapy (ART) to patients with established viremic control, bNAb therapy is expected to prolong remission. Surprisingly, in clinical trials on chronic HIV-1 patients, the bNAb VRC01 failed to prolong remission substantially. Identifying the cause of this failure is important for improving VRC01-based therapies and unraveling potential vulnerabilities of other bNAbs. In the trials, viremia resurged rapidly in most patients despite suppressive VRC01 concentrations in circulation, suggesting that VRC01 resistance was the likely cause of failure. ART swiftly halts viral replication, precluding the development of resistance during ART. If resistance were to emerge post ART, virological breakthrough would have taken longer than without VRC01 therapy. We hypothesized therefore that VRC01-resistant strains must have been formed before ART initiation, survived ART in latently infected cells, and been activated during VRC01 therapy, causing treatment failure. Current assays preclude testing this hypothesis experimentally. We developed a mathematical model based on the hypothesis and challenged it with available clinical data. The model integrated within-host HIV-1 evolution, stochastic latency reactivation, and viral dynamics with multiple-dose VRC01 pharmacokinetics. The model predicted that single but not higher VRC01-resistant mutants would pre-exist in the latent reservoir. We constructed a virtual patient population that parsimoniously recapitulated inter-patient variations. Model predictions with this population quantitatively captured data of VRC01 failure from clinical trials, presenting strong evidence supporting the hypothesis. We attributed VRC01 failure to single-mutant VRC01-resistant proviruses in the latent reservoir triggering viral recrudescence, particularly when VRC01 was at trough levels. Pre-existing resistant proviruses in the latent reservoir may similarly compromise other bNAbs. Our study provides a framework for designing bNAb-based therapeutic protocols that would avert such failure and maximize HIV-1 remission.


Conflict of interest statement

The authors declare that no competing interests exist.

Figures

Fig 1
Fig 1. Overview of the model.
(A) Dynamics at the individual patient level. We used a model of within-host HIV-1 evolution to estimate the pre-ART frequencies of wild-type and VRC01-resistant mutants (left), letting them be identical in productively and latently infected cells. ART eliminates the former but not the latter cells (middle). We then used a stochastic model of latent cell reactivation and viral growth to estimate the time of virological failure following VRC01 therapy (right) for a given size of the latent reservoir and the fitness of the VRC01 resistant strain. (B) Dynamics at the patient population level and the outcomes of clinical trials. We created a virtual patient population by sampling the latent cell pool size and mutant viral fitness during VRC01 therapy from defined distributions (left). For each individual, we performed stochastic simulations as in (A) and estimated the time to virological failure (middle), from which we obtained the distribution of breakthrough times and Kaplan-Meier survival plots (right), which we compared with clinical data.
Fig 2
Fig 2. Pre-existing frequencies of mutants.
Frequencies of (A) single mutants, (B) double mutants, and (C) triple mutants resistant to VRC01 estimated by our model (Methods). The frequencies, including of the wild-type and the quadruple mutant, not shown here, are listed in S1 Table.
Fig 3
Fig 3. Dynamics of VRC01 failure due to pre-existing resistance.
Representative trajectories of (A) the latent cell pool harboring resistant proviruses, (B) activated cells, and (C) VRC01-resistant viral load, obtained by our stochastic simulations (Methods). The different colors represent individual trajectories. Black dashed line shows the detection limit, crossing which marks clinical rebound. (D) The distribution of rebound times obtained from 5000 realizations. Here, the initial population of latently infected cells carrying the resistant mutants was set to 2.3×10⁻⁴×L0, where L0 = 106 cells, and the VRC01 efficacy against the mutant to εm = 0.3. Other parameters used are in Tables 1 and 2. Variation of the distribution is shown with (E) initial latent pool, L0 (cells), (F) viral production rate (virions/cell/day), (G) VRC01 efficacy, and (H) mutant fitness.
Fig 4
Fig 4. Recapitulating VRC01 failure in the A5340 trial.
(A) Fits of our model of single-dose plasma VRC01 pharmacokinetics (line) to data [26] (symbols) (Inset). Best-fit parameter estimates are in Table 2. Corresponding multiple dose concentration profiles (blue) and the VRC01 efficacy against a mutant strain with IC50 = 800 μg/mL (green) are shown. Black arrows indicate VRC01 infusions. (B) Stochastic realizations of the dynamics in a virtual population of 10000 patients, manifesting as changes in plasma viremia. Each grey line represents a virtual patient. Some randomly chosen trajectories are colored to aid visualization of the dynamics. Note that ART was continued after the first infusion of VRC01 for 1 week. The detection limit of 20 copies/mL is marked as a red dashed line, crossing which marks clinical viral rebound. (C) The corresponding distribution of rebound times (orange). Rebound times of the participants in the A5340 trial with a 1-week uncertainty period, representing the gap between successive viral load measurements, are also marked. (D) Kaplan-Meier plot for the A5340 trial based on the percentage of patients with viremia ≥200 copies/mL. Each light purple line is a survival curve generated by randomly choosing 20 patients from the virtual population above. The dashed purple line is the mean of all these survival curves. Each light green line is an analogous survival curve if the failure were to occur by the recrudescence of latently infected cells infected by wild-type (VRC01 sensitive) proviruses. (IC50 for the wild-type was 1 μg/mL [25].) The green dashed line represents the average of the latter survival curves. The blue dashed line marks the average survival curve due to resistant strains alone. It is indistinguishable from the purple line until ~100 days, indicating that the predominant mode of failure is via resistance. The data from the trial [17] is shown as a red solid line.
Fig 5
Fig 5. Recapitulating VRC01 failure in the NIH trial.
(A) Multiple dose concentration profiles (blue) and the VRC01 efficacy against a mutant strain with IC50 = 800 μg/mL (green). Black arrows indicate VRC01 infusions. (B) Stochastic realizations of the dynamics in a virtual population of 10000 patients, manifesting as changes in plasma viremia. Each grey line represents a virtual patient. Some randomly chosen trajectories are colored to aid visualization of the dynamics. ART was continued after the first infusion of VRC01 for 3 days (grey shaded region). The detection limit of 40 copies /mL is marked as a black dashed line, crossing which marks clinical viral rebound. (C) The corresponding distribution of rebound times (orange). Rebound times of the participants in the NIH trial are marked along with their uncertainties based on measurement frequencies. (D) Kaplan-Meier plot for the NIH trial. Each light blue line is a survival curve generated by randomly choosing 20 patients from the virtual population above. The dashed blue line is the mean of all these survival curves. The data from the trial is shown as a red solid line.

Similar articles

  • Use of broadly neutralizing antibodies in pediatric HIV for treatment and remission.
    Shapiro RL, Masheto G, Ajibola G. Shapiro RL, et al. Curr Opin HIV AIDS. 2025 May 1;20(3):279-286. doi: 10.1097/COH.0000000000000927. Epub 2025 Mar 3. Curr Opin HIV AIDS. 2025. PMID: 40048578 Review.
  • Effect of HIV Antibody VRC01 on Viral Rebound after Treatment Interruption.
    Bar KJ, Sneller MC, Harrison LJ, Justement JS, Overton ET, Petrone ME, Salantes DB, Seamon CA, Scheinfeld B, Kwan RW, Learn GH, Proschan MA, Kreider EF, Blazkova J, Bardsley M, Refsland EW, Messer M, Clarridge KE, Tustin NB, Madden PJ, Oden K, O'Dell SJ, Jarocki B, Shiakolas AR, Tressler RL, Doria-Rose NA, Bailer RT, Ledgerwood JE, Capparelli EV, Lynch RM, Graham BS, Moir S, Koup RA, Mascola JR, Hoxie JA, Fauci AS, Tebas P, Chun TW. Bar KJ, et al. N Engl J Med. 2016 Nov 24;375(21):2037-2050. doi: 10.1056/NEJMoa1608243. Epub 2016 Nov 9. N Engl J Med. 2016. PMID: 27959728 Free PMC article. Clinical Trial.
  • Virologic effects of broadly neutralizing antibody VRC01 administration during chronic HIV-1 infection.
    Lynch RM, Boritz E, Coates EE, DeZure A, Madden P, Costner P, Enama ME, Plummer S, Holman L, Hendel CS, Gordon I, Casazza J, Conan-Cibotti M, Migueles SA, Tressler R, Bailer RT, McDermott A, Narpala S, O'Dell S, Wolf G, Lifson JD, Freemire BA, Gorelick RJ, Pandey JP, Mohan S, Chomont N, Fromentin R, Chun TW, Fauci AS, Schwartz RM, Koup RA, Douek DC, Hu Z, Capparelli E, Graham BS, Mascola JR, Ledgerwood JE; VRC 601 Study Team. Lynch RM, et al. Sci Transl Med. 2015 Dec 23;7(319):319ra206. doi: 10.1126/scitranslmed.aad5752. Sci Transl Med. 2015. PMID: 26702094 Free PMC article. Clinical Trial.
  • Broadly Neutralizing Antibodies for HIV-1 Prevention.
    Walsh SR, Seaman MS. Walsh SR, et al. Front Immunol. 2021 Jul 20;12:712122. doi: 10.3389/fimmu.2021.712122. eCollection 2021. Front Immunol. 2021. PMID: 34354713 Free PMC article. Review.
  • Clinical trials of broadly neutralizing monoclonal antibodies in people living with HIV - a review.
    Mahomed S, Pillay K, Hassan-Moosa R, Galvão BPGV, Burgers WA, Moore PL, Rose-Abrahams M, Williamson C, Garrett N. Mahomed S, et al. AIDS Res Ther. 2025 Apr 6;22(1):44. doi: 10.1186/s12981-025-00734-8. AIDS Res Ther. 2025. PMID: 40189566 Free PMC article. Review.

Cited by

References

    1. Arts EJ, Hazuda DJ. HIV-1 Antiretroviral drug therapy. Cold Spring Harb Perspect Med. 2012;2:a007161 10.1101/cshperspect.a007161 - DOI - PMC - PubMed
    1. Chun TW, Davey RT, Engel D, Lane HC, Fauci AS. AIDS: Re-emergence of HIV after stopping therapy. Nature. 1999;401:874–875. 10.1038/44755 - DOI - PubMed
    1. Chun TW, Moir S, Fauci AS. HIV reservoirs as obstacles and opportunities for an HIV cure. Nat Immunol. 2015;16:584–589. 10.1038/ni.3152 - DOI - PubMed
    1. Chun TW, Engel D, Berrey MM, Shea T, Corey L, Fauci AS. Early establishment of a pool of latently infected, resting CD4+ T cells during primary HIV-1 infection. Proc Natl Acad Sci U S A. 1998;95:8869–8873. 10.1073/pnas.95.15.8869 - DOI - PMC - PubMed
    1. Hosmane NN, Kwon KJ, Bruner KM, Capoferri AA, Beg S, Rosenbloom DIS, et al. Proliferation of latently infected CD4+ T cells carrying replication-competent HIV-1: Potential role in latent reservoir dynamics. J Exp Med. 2017;214:959–972. 10.1084/jem.20170193 - DOI - PMC - PubMed

Publication types