. 2020 Nov 30;18(11):e3000981.
doi: 10.1371/journal.pbio.3000981. eCollection 2020 Nov.

Acetylation-mediated remodeling of the nucleolus regulates cellular acetyl-CoA responses

Affiliations

Acetylation-mediated remodeling of the nucleolus regulates cellular acetyl-CoA responses

Ryan Houston et al. PLoS Biol. .

Abstract

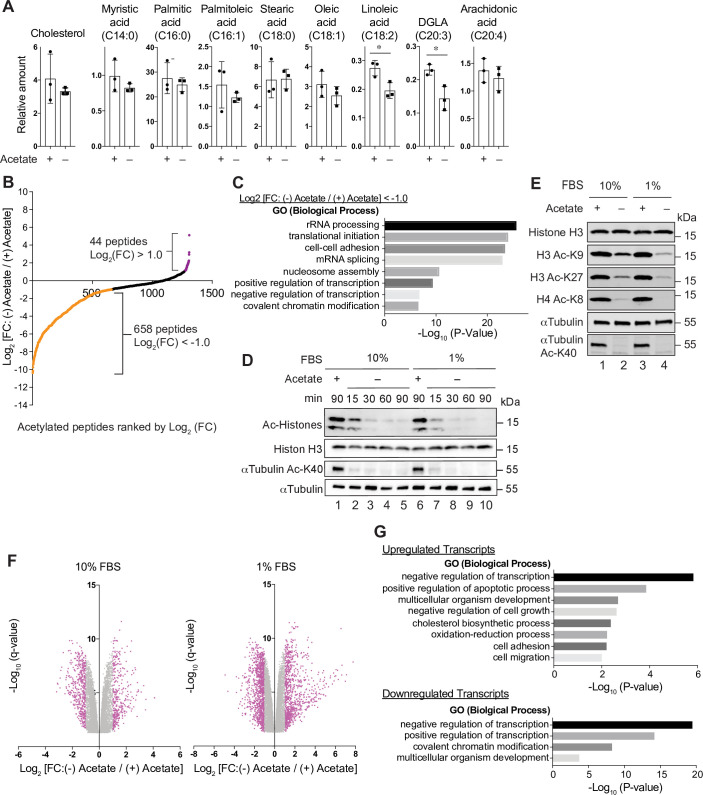
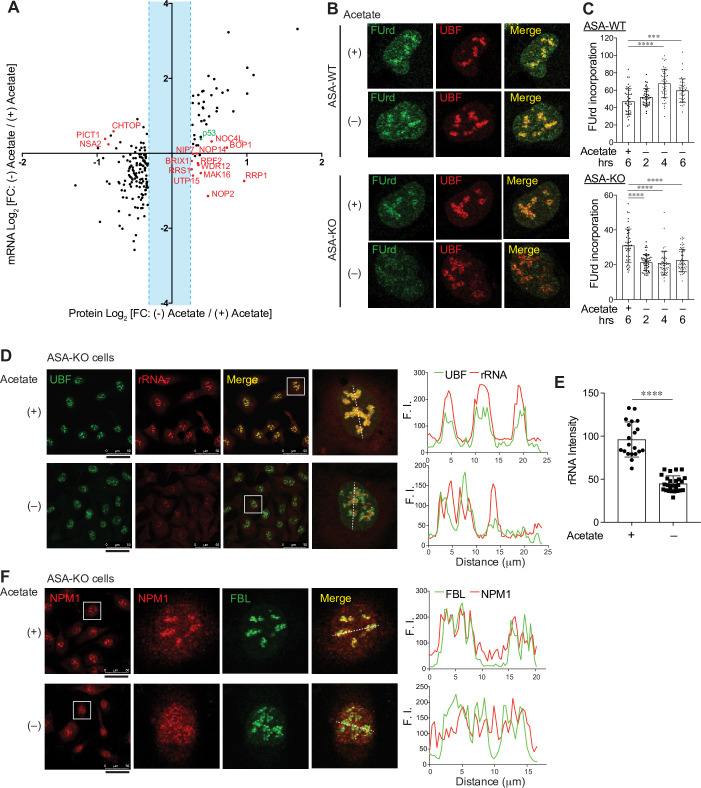
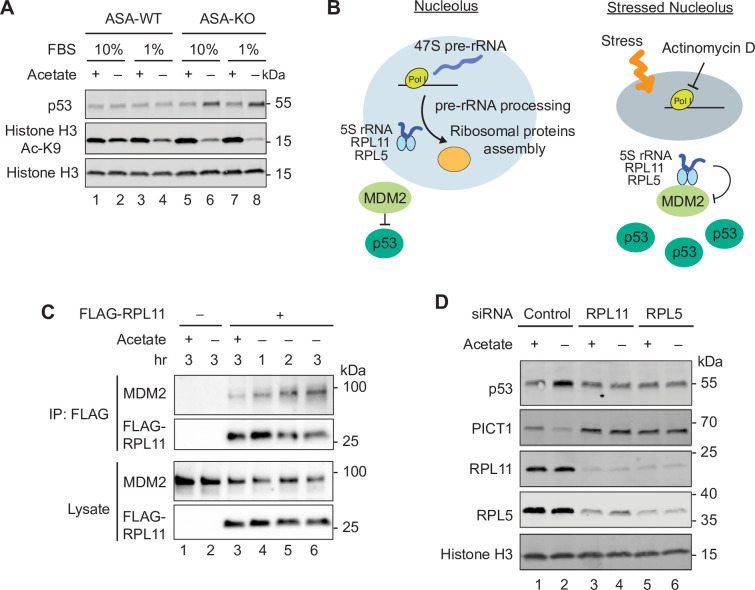
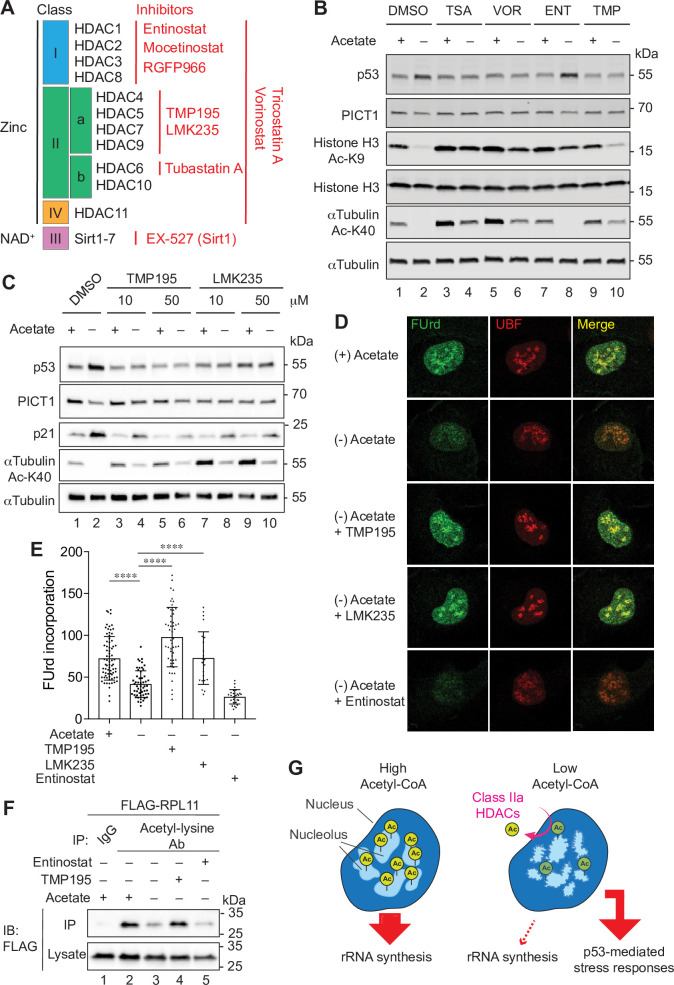
The metabolite acetyl-coenzyme A (acetyl-CoA) serves as an essential element for a wide range of cellular functions including adenosine triphosphate (ATP) production, lipid synthesis, and protein acetylation. Intracellular acetyl-CoA concentrations are associated with nutrient availability, but the mechanisms by which a cell responds to fluctuations in acetyl-CoA levels remain elusive. Here, we generate a cell system to selectively manipulate the nucleo-cytoplasmic levels of acetyl-CoA using clustered regularly interspaced short palindromic repeat (CRISPR)-mediated gene editing and acetate supplementation of the culture media. Using this system and quantitative omics analyses, we demonstrate that acetyl-CoA depletion alters the integrity of the nucleolus, impairing ribosomal RNA synthesis and evoking the ribosomal protein-dependent activation of p53. This nucleolar remodeling appears to be mediated through the class IIa histone deacetylases (HDACs). Our findings highlight acetylation-mediated control of the nucleolus as an important hub linking acetyl-CoA fluctuations to cellular stress responses.


Conflict of interest statement

The authors have declared that no competing interests exist.

Figures

Fig 1
Fig 1. Acetate dependency for acetyl-CoA production in ASA-KO cells.
(A) Schematic representation of the pathways for nucleo-cytoplasmic acetyl-CoA production in mammalian cells (top) and of the acetate-dependent control of acetyl-CoA in ACLY KO cells (bottom). (B) Immunoblotting for ACLY in representative ACLY-targeted cell clones maintained in 20-mM acetate-supplemented media and in parental HT1080 cells. αTubulin is shown as a loading control. (C) Cell viability assay for ASA-WT and KO cells cultured in the presence or absence of 20-mM acetate in the culture media with indicated FBS conditions over 4 days. On day 2, the original medium containing 10% FBS was replaced for 24 hours with media containing either 10% FBS, 1% FBS, or 10% dFBS. Data are shown as mean ± SD (n = 3 independent experiments). *P < 0.05, **P < 0.01, ***P < 0.001 (1-way ANOVA followed by Tukey multiple comparisons test). (D) Cell viability assay for ASA-KO cells with or without exoACLY using the same experimental procedures as in “C.” Data are shown as mean ± SD (n = 3 independent experiments). ***P < 0.001, ****P < 0.0001 (1-way ANOVA followed by Tukey multiple comparisons test). (E) LC-UV quantification of acetyl-CoA and CoA in cell lysate from ASA-WT and ASA-KO cells cultured for 4 hours in media containing 1% FBS with or without 20-mM acetate. Estimated single cell concentrations are shown as mean ± SD (n = 3 biological replicates). *P < 0.05, **P < 0.001 (Unpaired t test). (F) LC-MS quantification of acetyl-CoA and CoA in cell lysate from ASA-KO cells cultured as in “E.” Estimated single cell concentrations are shown as mean ± SD (n = 6 biological replicates). ***P = 0.0001, ****P < 0.0001 (Unpaired t test). The data underlying the graphs in Fig 1 can be found in S1 Data. acetyl-CoA, acetyl-coenzyme A; ACLY, ATP citrate lyase; ACSS2, acyl-CoA synthetase short chain family member 2; ASA-KO, acetate-supplemented ACLY knockout; ASA-WT, acetate-supplemented ACLY wild type; CoA, coenzyme A; CRISPR, clustered regularly interspaced short palindromic repeat; dFBS, dialyzed FBS; exoACLY, exogenous expression of ACLY; FBS, fetal bovine serum; KO, knockout; LC-MS, liquid chromatography-mass spectrometry; LC-UV, liquid chromatography with UV detection; TCA, tricarboxylic acid.
Fig 2
Fig 2. Alterations in lipid synthesis, acetylation, and gene expression following acetyl-CoA depletion.
(A) Quantification of total cholesterol and fatty acids in ASA-KO cells cultured for 4 hours in 1% FBS containing media with or without 20-mM acetate. Data are shown as mean of 3 biological replicates. *P < 0.05 (Unpaired t test). (B) Plot of acetylated peptides ranked by log2 FC 90 minutes after acetate removal in ASA-KO cells. Values are from S1 Table, column B (mean of 2 independent technical replicates). (C) GO analysis for putative deacetylated peptides identified in the acetylome analysis. Enriched representative biological processes are shown. (D) Immunoblotting for the indicated acetylated proteins in ASA-KO cells cultured in 10% or 1% FBS containing media with or without 20-mM acetate for the indicated times. Ac histones were detected using an anti-acetyl-lysine motif antibody. (E) Immunoblotting for the designated acetylated and total protein levels in ASA-KO cells cultured in 10% or 1% FBS containing media with or without acetate for 4 hours. (F) Volcano plots for mRNA expression changes 4 hours after acetate removal in ASA-KO cells cultured in 10% or 1% FBS containing media. Down-regulated transcripts {log2 FC [(−) Acetate / (+) Acetate] < −1.0. q < 0.05}, and up-regulated transcripts {log2 FC [(−) Acetate / (+) Acetate] >1.0. q < 0.05} are shown in pink. Data shown represent the mean of 3 biological replicates. Values are from S2 Table (genes with q < 0.05 are shown). (G) GO analysis for down-regulated transcripts and up-regulated transcripts in the RNA sequencing with the 1% FBS condition. Enriched representative biological processes are shown. The data underlying the graphs in Fig 2 can be found in S1 Data. Ac, acetylated; acetyl-CoA, acetyl-coenzyme A; ASA-KO, acetate-supplemented ACLY knockout; DGLA, Dihomo-γ-linolenic acid; FFBS, fetal bovine serum; FC, fold change; GO, gene ontology; mRNA, messenger RNA; rRNA, ribosomal RNA.
Fig 3
Fig 3. Functional and structural remodeling of the nucleolus by acetyl-CoA depletion.
(A) Scatter plot for log2 FC in proteins (x-axis) and mRNAs (y-axis) 4 hours after acetate removal in ASA-KO cells. Values are from S2 and S3 Tables. Proteins with log2 FC more than 0.264 or less than −0.322 are shown. Proteins that are known to localize in the nucleolus are highlighted in red and p53 is shown in green. (B) FUrd incorporation assay in ASA-WT and ASA-KO cells cultured in 1% FBS containing media with or without 20-mM acetate over 6 hours. Representative nuclear images immunostained for FUrd and UBF are shown. (C) Quantification of the mean fluorescent intensity of the FUrd signal per nucleus. The microscopic images of the FUrd incorporation assay performed as in “B” were utilized for the quantification. Data are shown as mean ± SD (n = 39 to 55 cells per condition). ***P < 0.001, ****P < 0.0001 (1-way ANOVA followed by Tukey multiple comparisons test). (D) Immunostaining for UBF along with rRNA dye staining in ASA-KO cells cultured in 1% FBS containing media with or without acetate for 4 hours. The scale bars under the left images indicate 50 μm. Magnified nuclear images (surrounded by a white square) are shown. Line profiles for indicated FI determined along the white dashed lines are shown to the right. (E) Quantification of the mean fluorescent intensity of the rRNA signal per nucleus in (D). Data are shown as mean ± SD [n = 20 or 27 cells for (+) Acetate or (−) Acetate, respectively]. ****P < 0.0001 (Unpaired t test). (F) Immunostaining for NPM1 and FBL in ASA-KO cells cultured in 1% FBS containing media with or without acetate for 4 hours. Magnified nuclear images (surrounded by a white square) are shown. Line profiles for indicated FI determined along the white dashed lines are shown to the right. The data underlying the graphs in Fig 3 can be found in S1 Data. acetyl-CoA, acetyl-coenzyme A; ASA-KO, acetate-supplemented ACLY knockout; ASA-WT, acetate-supplemented ACLY wild type; FBL, fibrillarin; FBS, fetal bovine serum; FC, fold change; FI, fluorescent intensities; FUrd, 5-Fluorouridine; mRNA, messenger RNA; rRNA, ribosomal RNA; UBF, upstream binding factor.
Fig 4
Fig 4. Ribosomal protein–dependent p53 activation by acetyl-CoA depletion.
(A) Immunoblotting for p53 levels in ASA-WT and ASA-KO cells cultured in 10% or 1% FBS containing media with or without acetate for 4 hours. Ac K9 and total histone H3 are also shown. (B) Schematic representation of the nucleolus as an organelle for ribosome biogenesis (left) and the stressed nucleolus that induces p53 stabilization through the inhibitory interaction between the 5S rRNA-RPL11-RPL5 complex and MDM2. (C) Immunoprecipitation with FLAG-RPL11 and immunoblotting for MDM2 and FLAG-RPL11 in ASA-KO cells cultured in 1% FBS containing media with or without acetate for the indicated hours. (D) Immunoblotting for p53 levels in ASA-KO cells pretreated with indicated siRNAs and cultured in 1% FBS containing media with or without acetate for 4 hours. Histone H3 is shown as a loading control. Ac, acetylated; acetyl-CoA, acetyl-coenzyme A; ASA-KO, acetate-supplemented ACLY knockout; ASA-WT, acetate-supplemented ACLY wild type; FBS, fetal bovine serum; rRNA, ribosomal RNA; siRNA, small interfering RNA.
Fig 5
Fig 5. Class IIa HDAC activity is required for acetyl-CoA–induced nucleolar stress responses.
(A) Schematic representation of mammalian HDAC family members and their inhibitors (red). (B) Immunoblotting for the indicated proteins in ASA-KO cells cultured in 1% FBS containing media with or without acetate, and in the presence or absence of indicated HDAC inhibitors for 4 hours. Following concentrations of HDAC inhibitors were used: 500-nM TSA, 10-μM VOR, 70-μM ENT, and 50-μM TMP. (C) Immunoblotting for the indicated proteins in ASA-KO cells cultured in 1% FBS containing media with or without acetate, and in the presence or absence of indicated class IIa HDAC inhibitors for 4 hours. (D) FUrd incorporation assay in ASA-KO cells cultured in 1% FBS containing media with or without acetate, and in the presence or absence of indicated HDAC inhibitors for 4 hours. Representative nuclear images (surrounded by a white square) immunostained for FUrd and UBF are shown. (E) Quantification of the mean fluorescent intensity of the FUrd signal per nucleus in “D.” Data are shown as mean ± SD (n = 23 to 74 cells per condition). ****P < 0.0001 (1-way ANOVA followed by Tukey multiple comparisons test). (F) Immunoprecipitation with the acetyl-lysine motif antibody and immunoblotting for FLAG-RPL11 in ASA-KO cells cultured in 1% FBS containing media with or without acetate, and in the presence or absence of 50-μM TMP or 50-μM ENT for 90 minutes. (G) Model for the nucleolar responses upon nucleo-cytoplasmic acetyl-CoA fluctuations. See the main text for detail. The data underlying the graphs in Fig 5 can be found in S1 Data. Ab, antibody; acetyl-CoA, acetyl-coenzyme A; ASA-KO, acetate-supplemented ACLY knockout; ENT, Entinostat; FBS, fetal bovine serum; FUrd, 5-Fluorouridine; HDAC, histone deacetylase; IB, immunoblotting; IgG, immunoglobulin G; IP, immunoprecipitation; NAD, nicotinamide adenine dinucleotide; rRNA, ribosomal RNA; TMP, TMP195; TSA, Triconstatin A; UBF, upstream binding factor; VOR; Vorinostat.

References

    1. Efeyan A, Comb WC, Sabatini DM. Nutrient-sensing mechanisms and pathways. Nature. 2015;517(7534):302–10. 10.1038/nature14190 - DOI - PMC - PubMed
    1. Campbell SL, Wellen KE. Metabolic Signaling to the Nucleus in Cancer. Mol Cell. 2018;71(3):398–408. 10.1016/j.molcel.2018.07.015 - DOI - PubMed
    1. Wang YP, Lei QY. Metabolite sensing and signaling in cell metabolism. Signal Transduct Target Ther. 2018;3:30 10.1038/s41392-018-0024-7 - DOI - PMC - PubMed
    1. Pietrocola F, Galluzzi L, Bravo-San Pedro JM, Madeo F, Kroemer G. Acetyl coenzyme A: a central metabolite and second messenger. Cell Metab. 2015;21(6):805–21. 10.1016/j.cmet.2015.05.014 - DOI - PubMed
    1. Shi L, Tu BP. Acetyl-CoA and the regulation of metabolism: mechanisms and consequences. Curr Opin Cell Biol. 2015;33:125–31. 10.1016/j.ceb.2015.02.003 - DOI - PMC - PubMed

Publication types

MeSH terms