. 2020 Nov 30;15(11):e0235998.
doi: 10.1371/journal.pone.0235998. eCollection 2020.

Replication stress and FOXM1 drive radiation induced genomic instability and cell transformation

Affiliations

Replication stress and FOXM1 drive radiation induced genomic instability and cell transformation

Zhentian Li et al. PLoS One. .

Abstract

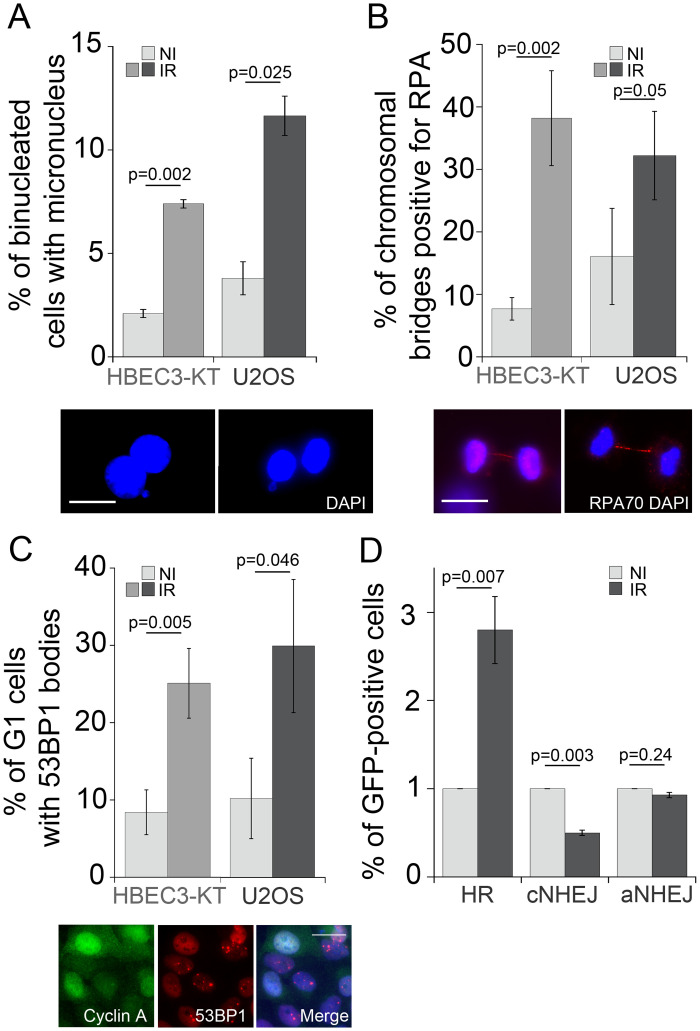
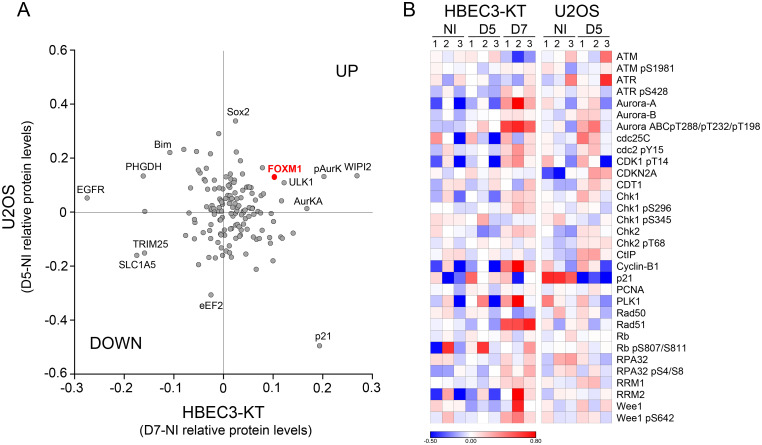
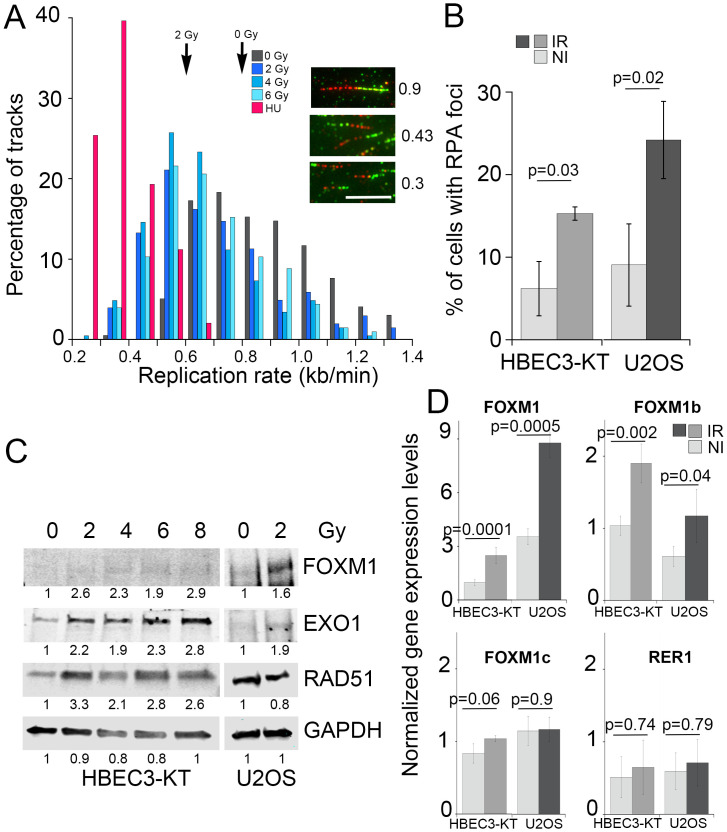
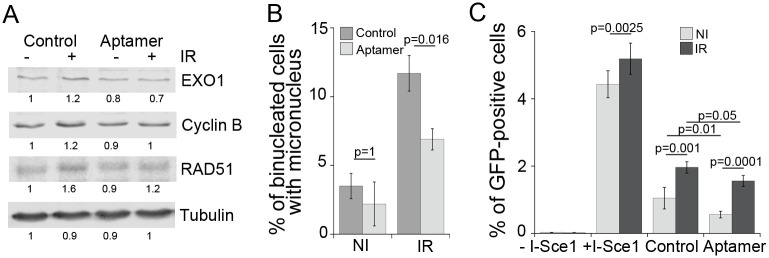
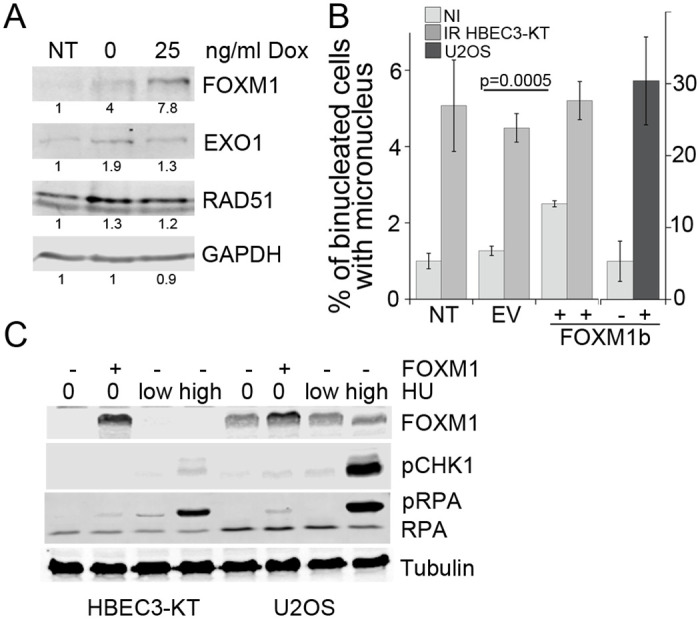
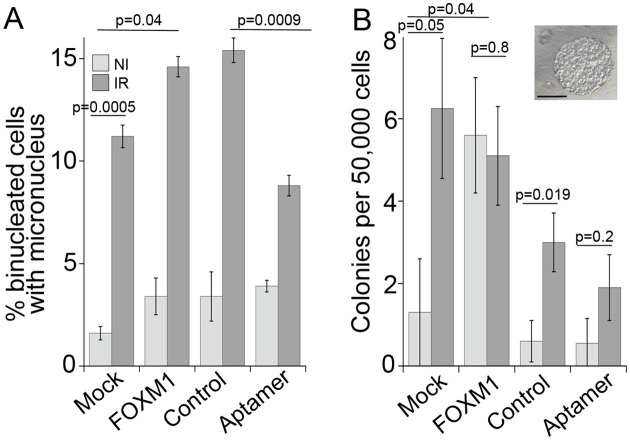
In contrast to the vast majority of research that has focused on the immediate effects of ionizing radiation, this work concentrates on the molecular mechanism driving delayed effects that emerge in the progeny of the exposed cells. We employed functional protein arrays to identify molecular changes induced in a human bronchial epithelial cell line (HBEC3-KT) and osteosarcoma cell line (U2OS) and evaluated their impact on outcomes associated with radiation induced genomic instability (RIGI) at day 5 and 7 post-exposure to a 2Gy X-ray dose, which revealed replication stress in the context of increased FOXM1b expression. Irradiated cells had reduced DNA replication rate detected by the DNA fiber assay and increased DNA resection detected by RPA foci and phosphorylation. Irradiated cells increased utilization of homologous recombination-dependent repair detected by a gene conversion assay and DNA damage at mitosis reflected by RPA positive chromosomal bridges, micronuclei formation and 53BP1 positive bodies in G1, all known outcomes of replication stress. Interference with the function of FOXM1, a transcription factor widely expressed in cancer, employing an aptamer, decreased radiation-induced micronuclei formation and cell transformation while plasmid-driven overexpression of FOXM1b was sufficient to induce replication stress, micronuclei formation and cell transformation.


Conflict of interest statement

The authors have declared that no competing interests exist.

Figures

Fig 1
Fig 1. X-ray irradiated cells have damaged DNA at mitosis and increased usage of the HR pathway.
A) Micronucleus formation rates at day 7 (HBEC3-KT) or day 5 (U2OS) following exposure to 2Gy X-ray. Average of 2 experiments, error bars represent SEM. Student’s t-test. Inserts depict a representative image of binucleated HBEC3-KT cells with a micronucleus or a nuclear bud, respectively. Scale bar = 20μm. B) Increased frequency of RPA-positive chromosomal bridges in irradiated cells. Proliferating cultures of day 7 (HBEC3-KT) or day 5 (U2OS) following exposure to 2Gy X-ray were fixed and stained for RPA 70. An average of 90 mitosis per condition were scored for RPA positive bridges. Error bars represent standard deviation of triplicate samples. Student’s t-test. Insert depicts a representative image of RPA-positive chromosomal bridge in U2OS (left panel) and HBEC3-KT (right panel) cells. Scale bar = 20μm. C) Frequency of nuclei with more than three 53BP1-positive foci per nuclei scored in an average of 100 Cyclin A negative nuclei per sample in HBEC3-KT at day 7 and in U2OS cells at day 5 following a 2Gy X-ray dose. Error bars represent standard deviation of triplicate samples. Student’s t-test. Insert depicts HBEC3-KT cells with Cyclin A positive nuclei without 53BP1 bodies and Cyclin A negative nuclei with 53BP1 bodies. Scale bar = 20μm. D) Relative GFP induction levels in U2OS reporter cell lines for homologous recombination dependent repair (DRG), cNHEJ (EJ5) and aNHEJ (EJ2) at day 7 following exposure to a 2Gy X-ray dose. Average of 2 experiments, error bars represent SEM. Student’s t-test.
Fig 2
Fig 2. Reverse phase protein array analysis of proteins and post-translational modifications altered by exposure to X-ray.
A) Scatterplot representing the relative protein level difference between irradiated and non-irradiated samples. Averages of triplicate samples normalized and transformed to linear values for each condition were subtracted. Each dot represents a protein that yielded a significant difference after irradiation (Student’s t-test, p<0.05) in cell lysates of HBEC3-KT at day 7 and/or U2OS at day 5. B) Heat map for proteins involved in cell cycle regulation and homologous recombination DNA repair pathway. The normalized log2 values for protein levels in each sample were median centered for each protein measured.
Fig 3
Fig 3. Irradiated cells have low levels of replication stress and induce FOXM1 expression.
A) Frequency distribution plot of replication speed measured by the DNA fiber assay in HBEC3-KT cells at day 7 following exposure to the indicated X-ray doses. As a control, HBEC3-KT cells were treated for 48h with 25μM HU to reduce replication speed. Arrows indicate average speed. Inserts show examples of replication tracks of different length. Scale bar = 5μm. B) Quantification of the percentage of cells with RPA70 foci detected by immunofluorescence. Between 50 and 100 cells were scored in replicate samples of non-irradiated and day 7 irradiated HBEC3-KT cells or day 5 irradiated U2OS cells. Error bars represent standard deviation. Student’s t-test. C) Western blot for FOXM1 expression and known transcriptional target proteins in HBEK3-KT at day 7 and in U2OS at day 5 post-exposure to the indicated X-ray dose. Numbers indicate ratio of signal of the lane over non-irradiated. D) Total FOXM1 and isoform b and c identification by Quantitative real time PCR analysis in HBEK3-KT at day 7 and in U2OS at day 5 post-exposure to 2 Gy X-ray dose. Gene expression levels of FOXM1 and a control gene (RER1) were normalized employing PCBP1 control gene. Error bars represent standard error of the mean of two experiments. Student’s t-test.
Fig 4
Fig 4. Interference with FOXM1 transcriptional activity reduces radiation induced phenotypes.
A) Western blot analysis of known transcriptional target proteins for FOXM1 in HBEC3-KT at day 7 following exposure to 2Gy X-ray and transfection at day 3 with 100nM aptamer of random sequence (Control) or of a sequence interfering with FOXM1 transcriptional activity (Aptamer). B) Micronucleus assay in the same cells analyzed in A. Error bars represent standard deviation. 1 of 2 experiments shown. One Way ANOVA followed by Bonferroni post-test. C) Effect of aptamer transfection on the gene conversion assay to report homologous recombination dependent repair. Error bars represent SEM. Average of two experiments. One Way ANOVA followed by Bonferroni post-test.
Fig 5
Fig 5. FOXM1b overexpression is sufficient to induce genomic instability.
A) Western blot for Flag-tagged FOXM1 expression and transcriptional target proteins in stably expressing U2OS cells induced for 48h with the indicated Doxycycline concentration. B) Micronucleus formation in HBEC3-KT and U2OS transiently expressing FOXM1. Empty vector or FOXM1 were transfected 72h prior to the 18h incubation with cytochalasin. U2OS cells were treated with 1μg/ml Dox. Error bars represent SEM. Student’s t-test. C) Western blot analysis for RPA2 and Chk1 phosphorylation in HBEC3-KT and U2OS cells overexpressing FOXM1 or treated with HU 25μM for 48h or 3mM for 4h.
Fig 6
Fig 6. FOXM1 expression promotes cell transformation.
Triplicate flasks of HBEC3-KT cells were exposed to 4Gy X-ray and transfected at day 4 with the indicated construct. At day 6 post-irradiation, the cells were passaged and samples were collected for micronucleus assay shown in (A). After a month of continuous growth, the cells were tested for growth in soft agar shown in (B). Error bars represent SEM. Student’s t-test and One Way ANOVA with Fisher’s LSD post-test for aptamer and radiation samples. Scale bar = 200 μm.

References

    1. Delaney GP, Barton MB. Evidence-based estimates of the demand for radiotherapy. Clin Oncol (R Coll Radiol). 2015;27(2):70–76. - PubMed
    1. Suit H, Goldberg S, Niemierko A, Ancukiewicz M, Hall E, Goitein M, et al. Secondary carcinogenesis in patients treated with radiation: a review of data on radiation-induced cancers in human, non-human primate, canine and rodent subjects. Radiat Res. 2007;167(1):12–42. 10.1667/RR0527.1 - DOI - PubMed
    1. Berrington de Gonzalez A, Curtis RE, Kry SF, Gilbert E, Lamart S, Berg CD, et al. Proportion of second cancers attributable to radiotherapy treatment in adults: a cohort study in the US SEER cancer registries. Lancet Oncol. 2011;12(4):353–360. 10.1016/S1470-2045(11)70061-4 - DOI - PMC - PubMed
    1. Braunstein S, Nakamura JL. Radiotherapy-induced malignancies: review of clinical features, pathobiology, and evolving approaches for mitigating risk. Frontiers in oncology. 2013;3:73 10.3389/fonc.2013.00073 - DOI - PMC - PubMed
    1. Sherborne AL, Davidson PR, Yu K, Nakamura AO, Rashid M, Nakamura JL. Mutational Analysis of Ionizing Radiation Induced Neoplasms. Cell Rep. 2015;12(11):1915–1926. 10.1016/j.celrep.2015.08.015 - DOI - PMC - PubMed

Publication types

MeSH terms

Substances