

Estimated impact of RTS,S/AS01 malaria vaccine allocation strategies in sub-Saharan Africa: A modelling study
- PMID: 33253211
- PMCID: PMC7703928
- DOI: 10.1371/journal.pmed.1003377
Estimated impact of RTS,S/AS01 malaria vaccine allocation strategies in sub-Saharan Africa: A modelling study
Abstract
Background: The RTS,S/AS01 vaccine against Plasmodium falciparum malaria infection completed phase III trials in 2014 and demonstrated efficacy against clinical malaria of approximately 36% over 4 years for a 4-dose schedule in children aged 5-17 months. Pilot vaccine implementation has recently begun in 3 African countries. If the pilots demonstrate both a positive health impact and resolve remaining safety concerns, wider roll-out could be recommended from 2021 onwards. Vaccine demand may, however, outstrip initial supply. We sought to identify where vaccine introduction should be prioritised to maximise public health impact under a range of supply constraints using mathematical modelling.
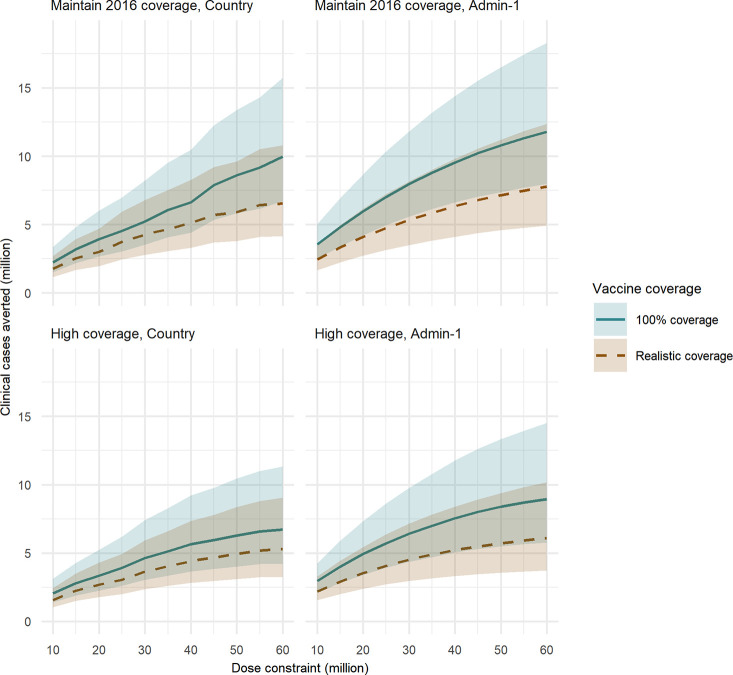
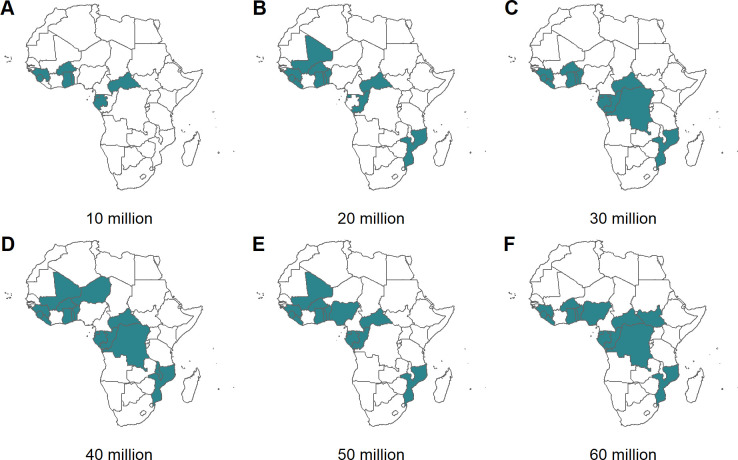
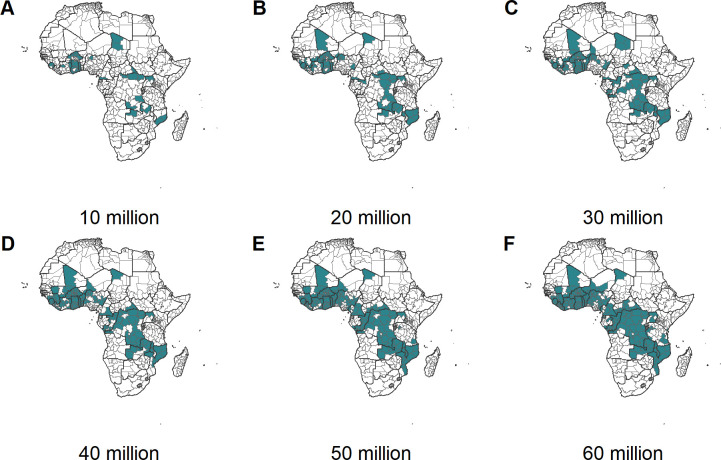
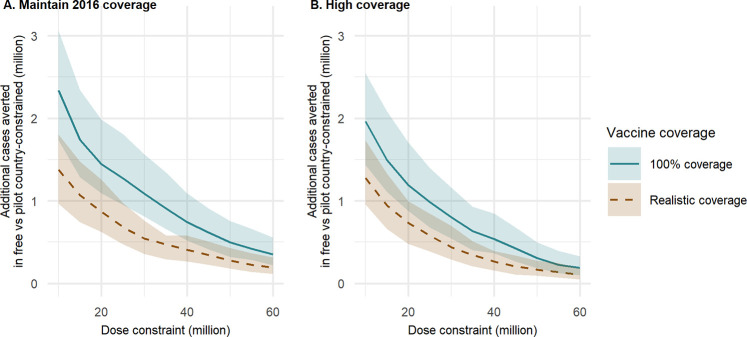
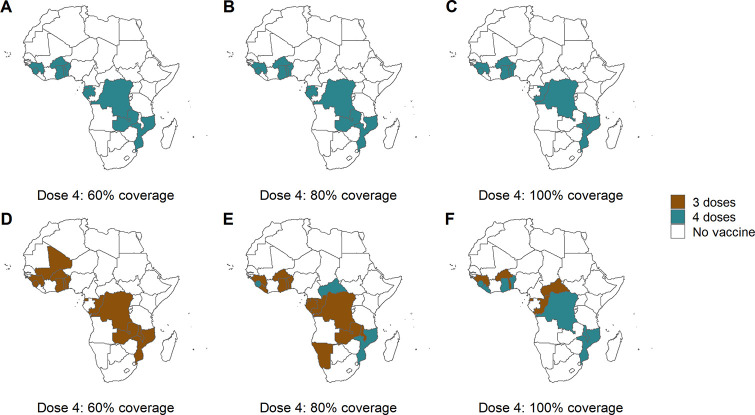
Methods and findings: Using a mathematical model of P. falciparum malaria transmission and RTS,S vaccine impact, we estimated the clinical cases and deaths averted in children aged 0-5 years in sub-Saharan Africa under 2 scenarios for vaccine coverage (100% and realistic) and 2 scenarios for other interventions (current coverage and World Health Organization [WHO] Global Technical Strategy targets). We used a prioritisation algorithm to identify potential allocative efficiency gains from prioritising vaccine allocation among countries or administrative units to maximise cases or deaths averted. If malaria burden at introduction is similar to current levels-assuming realistic vaccine coverage and country-level prioritisation in areas with parasite prevalence >10%-we estimate that 4.3 million malaria cases (95% credible interval [CrI] 2.8-6.8 million) and 22,000 deaths (95% CrI 11,000-35,000) in children younger than 5 years could be averted annually at a dose constraint of 30 million. This decreases to 3.0 million cases (95% CrI 2.0-4.7 million) and 14,000 deaths (95% CrI 7,000-23,000) at a dose constraint of 20 million, and increases to 6.6 million cases (95% CrI 4.2-10.8 million) and 38,000 deaths (95% CrI 18,000-61,000) at a dose constraint of 60 million. At 100% vaccine coverage, these impact estimates increase to 5.2 million cases (95% CrI 3.5-8.2 million) and 27,000 deaths (95% CrI 14,000-43,000), 3.9 million cases (95% CrI 2.7-6.0 million) and 19,000 deaths (95% CrI 10,000-30,000), and 10.0 million cases (95% CrI 6.7-15.7 million) and 51,000 deaths (95% CrI 25,000-82,000), respectively. Under realistic vaccine coverage, if the vaccine is prioritised sub-nationally, 5.3 million cases (95% CrI 3.5-8.2 million) and 24,000 deaths (95% CrI 12,000-38,000) could be averted at a dose constraint of 30 million. Furthermore, sub-national prioritisation would allow introduction in almost double the number of countries compared to national prioritisation (21 versus 11). If vaccine introduction is prioritised in the 3 pilot countries (Ghana, Kenya, and Malawi), health impact would be reduced, but this effect becomes less substantial (change of <5%) if 50 million or more doses are available. We did not account for within-country variation in vaccine coverage, and the optimisation was based on a single outcome measure, therefore this study should be used to understand overall trends rather than guide country-specific allocation.
Conclusions: These results suggest that the impact of constraints in vaccine supply on the public health impact of the RTS,S malaria vaccine could be reduced by introducing the vaccine at the sub-national level and prioritising countries with the highest malaria incidence.
Conflict of interest statement
I have read the journal’s policy and the authors of this manuscript have the following competing interests: PW discloses consultancy services to the Global Fund to support investment case and allocation modelling and country planning support. ACG discloses financial consultancy services to the Global Fund to support investment case and allocation modelling and country planning support and unrestricted research grants from a range of funders, including BMGF, UK Medical Research Council, The Wellcome Trust, NIH, Medicines for Malaria Venture, Integrated Vector Control Consortium, and Gavi. ACG is also a member of the WHO Malaria Policy Advisory Committee and of the Gavi Vaccine Investment Strategy Scientific Committee. ABH declares no competing interests.
Figures
Similar articles
-
Feasibility, safety, and impact of the RTS,S/AS01E malaria vaccine when implemented through national immunisation programmes: evaluation of cluster-randomised introduction of the vaccine in Ghana, Kenya, and Malawi.Lancet. 2024 Apr 27;403(10437):1660-1670. doi: 10.1016/S0140-6736(24)00004-7. Epub 2024 Apr 4. Lancet. 2024. PMID: 38583454 Free PMC article. Clinical Trial.
-
Public health impact and cost-effectiveness of the RTS,S/AS01 malaria vaccine: a systematic comparison of predictions from four mathematical models.Lancet. 2016 Jan 23;387(10016):367-375. doi: 10.1016/S0140-6736(15)00725-4. Epub 2015 Nov 6. Lancet. 2016. PMID: 26549466 Free PMC article.
-
Subnational introduction of the RTS,S/AS01E malaria vaccine into routine immunization: experience and lessons from the three pilot countries.Malar J. 2025 Jul 28;24(1):244. doi: 10.1186/s12936-025-05484-6. Malar J. 2025. PMID: 40721790 Free PMC article.
-
Policy uptake and implementation of the RTS,S/AS01 malaria vaccine in sub-Saharan African countries: status 2 years following the WHO recommendation.BMJ Glob Health. 2024 Apr 30;9(4):e014719. doi: 10.1136/bmjgh-2023-014719. BMJ Glob Health. 2024. PMID: 38688566 Free PMC article. Review.
-
[The RTS,S/AS01 malaria vaccine in children aged 5-17 months at first vaccination].Pan Afr Med J. 2018 Jun 19;30:142. doi: 10.11604/pamj.2018.30.142.13152. eCollection 2018. Pan Afr Med J. 2018. PMID: 30374388 Free PMC article. Review. French.
Cited by
-
RTS,S/AS01 malaria vaccine pilot implementation in western Kenya: a qualitative longitudinal study to understand immunisation barriers and optimise uptake.BMC Public Health. 2023 Nov 18;23(1):2283. doi: 10.1186/s12889-023-17194-2. BMC Public Health. 2023. PMID: 37980467 Free PMC article.
-
Comparison of health-oriented cross-regional allocation strategies for the COVID-19 vaccine: a mathematical modelling study.Ann Med. 2022 Dec;54(1):941-952. doi: 10.1080/07853890.2022.2060522. Ann Med. 2022. PMID: 35393922 Free PMC article.
-
Barriers and facilitators to nationwide implementation of the malaria vaccine in Ghana.Health Policy Plan. 2023 Jan 6;38(1):28-37. doi: 10.1093/heapol/czac077. Health Policy Plan. 2023. PMID: 36083007 Free PMC article.
-
Malaria in 2022: Increasing challenges, cautious optimism.Nat Commun. 2022 May 13;13(1):2678. doi: 10.1038/s41467-022-30133-w. Nat Commun. 2022. PMID: 35562368 Free PMC article.
-
Malaria vaccine-related adverse events among children under 5 in sub-Saharan Africa: systematic review and meta-analysis protocol.BMJ Open. 2023 Oct 4;13(10):e076985. doi: 10.1136/bmjopen-2023-076985. BMJ Open. 2023. PMID: 37793915 Free PMC article.
References
-
- Gavi The Vaccine Alliance. Facts and figures. 2019. [cited 2019 Apr 28]. Available from: https://www.gavi.org/about/mission/facts-and-figures/
-
- Gavi The Vaccine Alliance. Key figures: donor contributions & pledges. 2019. [cited 2019 Apr 28]. Available from: https://www.gavi.org/investing/funding/donor-contributions-pledges/
Publication types
MeSH terms
Substances
Grants and funding
LinkOut - more resources
Full Text Sources
Medical
