. 2020 Nov 30;15(11):e0242695.
doi: 10.1371/journal.pone.0242695. eCollection 2020.

Enhanced mitophagy in bronchial fibroblasts from severe asthmatic patients

Affiliations

Enhanced mitophagy in bronchial fibroblasts from severe asthmatic patients

Rakhee K Ramakrishnan et al. PLoS One. .

Abstract

Background: Sub-epithelial fibrosis is a characteristic feature of airway remodeling in asthma which correlates with disease severity. Current asthma medications are ineffective in treating fibrosis. In this study, we aimed to investigate the mitochondrial phenotype in fibroblasts isolated from airway biopsies of non-asthmatic and severe asthmatic subjects by examining mitophagy as a mechanism contributing to fibroblast persistence and thereby, fibrosis in severe asthma.

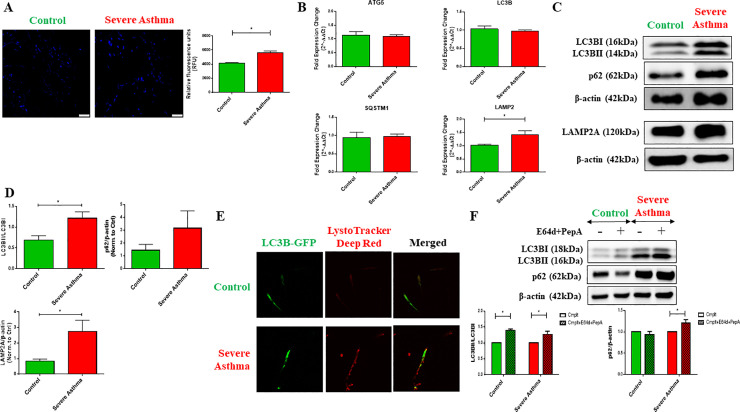
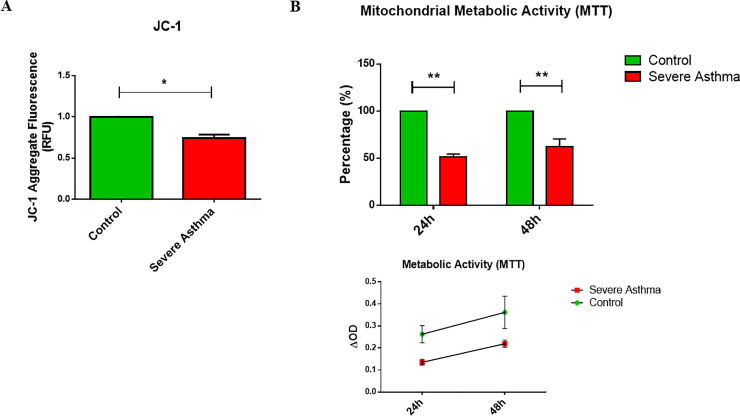
Methods: Bioinformatics analysis of publicly available transcriptomic data was performed to identify the top enriched pathways in asthmatic fibroblasts. Endogenous expression of mitophagy markers in severe asthmatic and non-asthmatic fibroblasts was determined using qRT-PCR, western blot and immunofluorescence. Mitophagy flux was examined by using lysosomal protease inhibitors, E64d and pepstatin A. Mitochondrial membrane potential and metabolic activity were also evaluated using JC-1 assay and MTT assay, respectively.

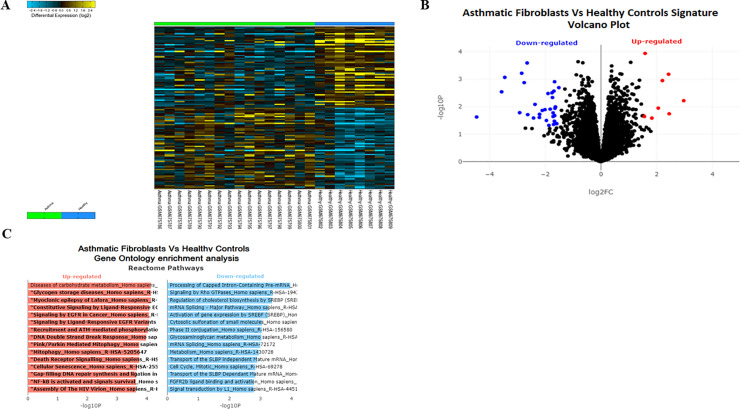
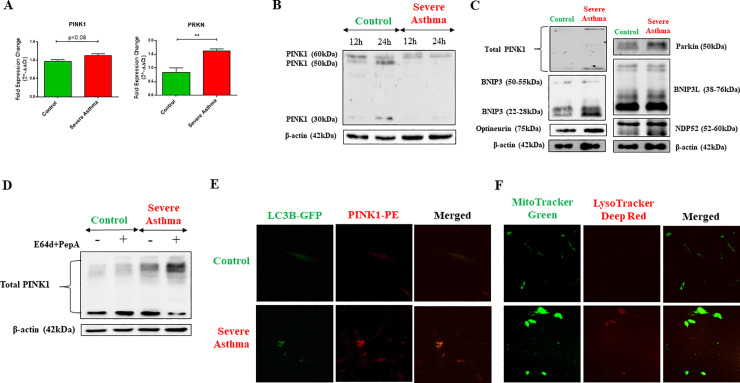
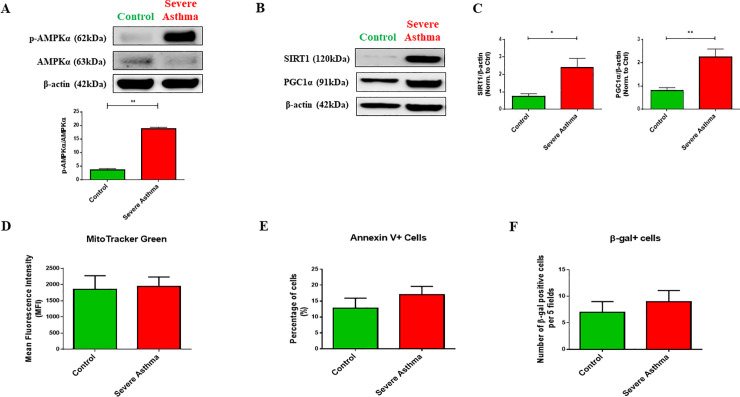
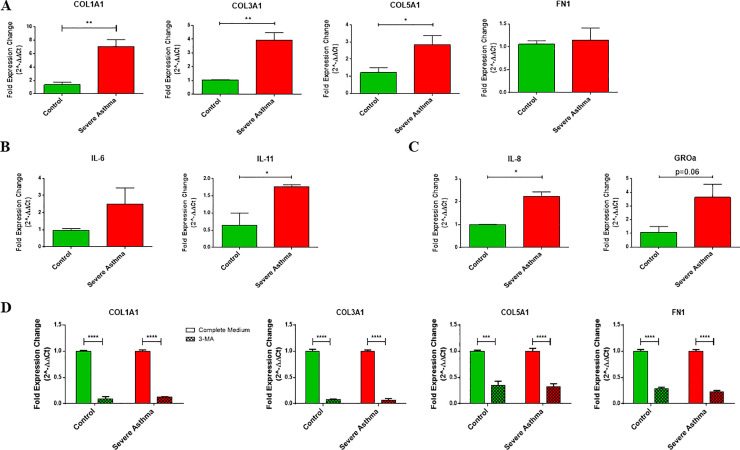
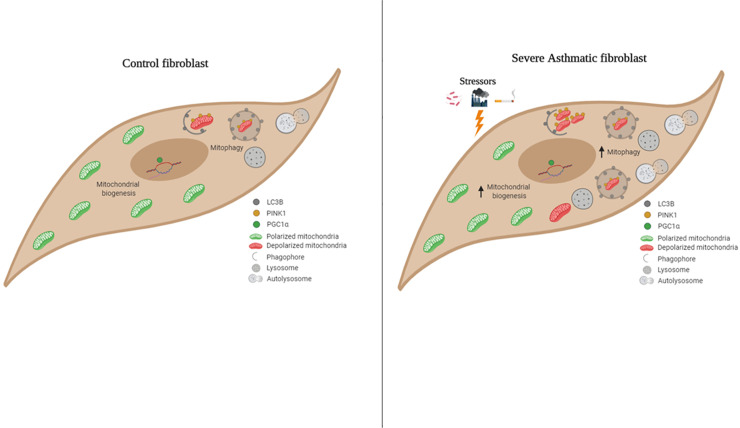
Results: Bioinformatics analysis revealed the enrichment of Pink/Parkin-mediated mitophagy in asthmatic fibroblasts compared to healthy controls. In severe asthmatic fibroblasts, the differential expression of mitophagy genes, PINK1 and PRKN, was accompanied by the accumulation of PINK1, Parkin and other mitophagy proteins at baseline. The further accumulation of endogenous LC3BII, p62 and PINK1 in the presence of E64d and pepstatin A in severe asthmatic fibroblasts reinforced their enhanced mitophagy flux. Significantly reduced mitochondrial membrane potential and metabolic activity were also demonstrated at baseline confirming the impairment in mitochondrial function in severe asthmatic fibroblasts. Interestingly, these fibroblasts displayed neither an apoptotic nor senescent phenotype but a pro-fibrotic phenotype with an adaptive survival mechanism triggered by increased AMPKα phosphorylation and mitochondrial biogenesis.

Conclusions: Our results demonstrated a role for mitophagy in the pathogenesis of severe asthma where the enhanced turnover of damaged mitochondria may contribute to fibrosis in severe asthma by promoting the persistence and pro-fibrotic phenotype of fibroblasts.


Conflict of interest statement

The authors have declared that no competing interests exist.

Figures

Fig 1
Fig 1. PINK/Parkin mediated mitophagy is among the top enriched pathways in asthmatic fibroblasts.
(A) Heatmap of differentially expressed genes (DEG) between asthmatic and healthy fibroblasts. (B) The log2-fold change and statistical significance of each gene was calculated by performing differential gene expression analysis. Each point in the plot represents a gene. Red points indicate significantly up-regulated genes and blue points indicate significantly down-regulated genes (logFC threshold = 1.5 and p-value threshold = 0.05). (C) Gene Ontology enrichment analysis was generated using Enrichr tool. The x-axis indicates the -log10(p-value) for each term. Significant terms are highlighted in bold. Only pathways with False Discovery Rate (FDR) less than 0.05 were selected.
Fig 2
Fig 2. Increase in basal autophagy in severe asthmatic fibroblasts.
The control and severe asthmatic (S-As) fibroblasts were cultured in DMEM complete medium for 4 hours post serum-starvation to measure autophagy at baseline. (A) To measure autophagosomal levels, the fibroblasts were stained with Autophagosome Detection Reagent for 30 minutes at 37°C in the dark and fluorescent readings were taken using a fluorescence microscope and plate reader. Representative images showing fluorescent staining of autophagosomal vacuoles (blue) in control and S-As fibroblasts (left panel). Quantitative representation of autophagosomal levels in relative fluorescence units (RFU) (right panel). (B) Under basal conditions, mRNA expression of autophagy markers, ATG5, LC3B, SQSTM1/p62 and LAMP2, in control and S-As fibroblasts was analysed by qRT-PCR and expressed as fold expression change relative to control fibroblasts post normalization to housekeeping gene 18s rRNA. (C) Representative immunoblots depicting protein levels of LC3B, p62 and LAMP2A in control and S-As fibroblasts. β-actin was used as loading control. (D) Densitometric analysis of LC3B lipidation represented as the ratio of LC3BII to LC3BI, p62 and LAMP2A levels in control and S-As fibroblasts. (E) The fibroblasts were cultured in DMEM complete medium for 48 hours post serum-starvation for immunofluorescence measurements at baseline. Representative images depicting fluorescent staining of autophagosomes using LC3B-GFP (green) and lysosomes using LysoTracker Deep Red (red). (F) The fibroblasts were cultured in the presence of lysosomal protease inhibitors, E64d and pepstatin A, for 6 hours post serum-starvation. Cell lysates were subjected to immunoblot analysis of autophagy proteins LC3B and p62. β-actin was used as loading control (top panel). Densitometric analysis of LC3B lipidation represented as the ratio of LC3BII to LC3BI and p62 levels in control and S-As fibroblasts upon treatment with E64d and pepstatin A (bottom panel). Graphical data are represented as mean ± SEM from 2–4 independent experiments with at least 3 unique donors in each group. *p < 0.05, determined by unpaired two-tailed Student t-test (Control vs Severe Asthma) or unpaired t-test with multiple comparisons using the Holm-Sidak method (Cmplt vs Cmplt+E64d+PepA).
Fig 3
Fig 3. Stabilization of PINK1 in severe asthmatic fibroblasts.
(A) The fibroblasts were cultured in DMEM complete medium for 4 hours post serum-starvation. Under basal conditions, mRNA expression of mitophagy markers, PINK1 and PRKN, in control and S-As fibroblasts was analysed by qRT-PCR and expressed as fold expression change relative to control fibroblasts post normalization to housekeeping gene 18s rRNA. (B) The fibroblasts were cultured in complete medium for the indicated time points post serum-starvation. Whole cell lysates were subjected to immunoblot analysis of PINK1 protein. β-actin was used as loading control. (C) Representative immunoblots depicting mitophagy related proteins, PINK1, Parkin, BNIP3, BNIP3L, NDP52, and optineurin in control and S-As fibroblasts. β-actin was used as loading control. (D) The fibroblasts were cultured in the presence of lysosomal protease inhibitors, E64d and pepstatin A, for 6 hours post serum-starvation. Cell lysates were subjected to immunoblot analysis of PINK1. β-actin was used as loading control. (E) The fibroblasts were cultured in DMEM complete medium for 48 hours post serum-starvation for immunofluorescence measurements at baseline. Representative images depicting control and S-As fibroblasts transduced with LC3B-GFP (green) and immunostained with PINK1-PE (red). (F) Representative images depicting fluorescent staining of mitochondria using MitoTracker Green (green) and lysosomes using LysoTracker Deep Red (red). Graphical data are represented as mean ± SEM from 3–4 independent experiments with at least 3 unique donors in each group. *p < 0.05, **p < 0.01, determined by unpaired two-tailed Student t-test.
Fig 4
Fig 4. Mitochondrial function is impeded in severe asthmatic fibroblasts.
(A) The control and S-As fibroblasts were labelled with JC-1 dye for 10 minutes and cultured thereafter for 4 hours. (B) The control and S-As fibroblasts were cultured in complete medium for up to 48 hours post serum-starvation. MTT reagent was added at the indicated time points and spectrophotometric readings were taken after 3 hours of incubation. Graphical data are represented as mean ± SEM relative to the control and representative of two independent experiments with each condition performed in triplicate. *p < 0.05, **p < 0.01, determined using unpaired two-tailed Student t-test.
Fig 5
Fig 5. Adaptive fibroblast persistence through AMPKα phosphorylation, SIRT1 and PGC1α expression in severe asthmatic fibroblasts.
(A) The fibroblasts were cultured in complete medium for 24 hours post serum-starvation. Whole cell lysates were subjected to immunoblot analysis of AMPKα and p-AMPKα (top panel). Densitometric analysis of AMPKα phosphorylation represented as the ratio of p-AMPKα to AMPKα (bottom panel). (B) Representative immunoblots depicting protein levels of SIRT1 and PGC1α in control and S-As fibroblasts. β-actin was used as loading control. (C) Densitometric analysis of SIRT1 and PGC1α in control and S-As fibroblasts. (D) The fibroblasts were cultured in complete medium for 48 hours post serum-starvation. Quantitative representation of MitoTracker Green fluorescence showing mitochondrial content in mean fluorescent intensity (MFI). (E) The levels of Annexin-V positive cells and (F) the levels of β-gal positive cells in control and S-As fibroblasts. Graphical data are represented as mean ± SEM from 2–4 independent experiments with at least 3 unique donors in each group. *p < 0.05, **p < 0.01, determined by unpaired two-tailed Student t-test.
Fig 6
Fig 6. Pro-fibrotic and pro-inflammatory signaling is increased in severe asthmatic fibroblasts.
The fibroblasts were cultured in DMEM complete medium for 2 hours post serum-starvation. Under basal conditions, mRNA expression of (A) ECM components COL1A1, COL3A1, COL5A1 and FN1, (B) cytokines IL-6 and IL-11, and (C) chemokines IL-8 and GROα, in control and S-As fibroblasts was analysed by qRT-PCR and expressed as fold expression change relative to control fibroblasts post normalization to housekeeping gene 18s rRNA. (D) The fibroblasts were treated with autophagy inhibitor, 3-MA (1mM), for 48 hours, and the mRNA expression of ECM components COL1A1, COL3A1, COL5A1 and FN1, in control and S-As fibroblasts was analysed by qRT-PCR and expressed as fold expression change relative to control fibroblasts post normalization to housekeeping gene 18s rRNA. Data are represented as mean ± SEM from at least 2 independent experiments. *p < 0.05, **p < 0.01, ***p < 0.001, ****p < 0.0001, determined by unpaired two-tailed Student t-test (Control vs Severe Asthma) or unpaired t-test with multiple comparisons using the Holm-Sidak method (Complete Medium vs 3-MA).
Fig 7
Fig 7. Graphical abstract–schematic representation of mitochondrial homeostasis in control and severe asthmatic bronchial fibroblasts.
In control fibroblasts, mitochondrial homeostasis is ensured by basal levels of mitophagy and mitochondrial biogenesis. With exposure of hyperresponsive airways in severe asthma to stressors such as allergens, pollutants or cigarette smoke, the mitochondria are increasingly prone to damage in S-As fibroblasts. The damaged mitochondria are effectively recycled by increased mitophagy and biogenesis. The new mitochondria eventually become vulnerable to the mitochondrial stressors reflecting a vicious pathological cycle ensuring the increased persistence of S-As fibroblasts.

References

    1. Elias JA, Zhu Z, Chupp G, Homer RJ. Airway remodeling in asthma. The Journal of clinical investigation. 1999;104(8):1001–6. 10.1172/JCI8124 - DOI - PMC - PubMed
    1. Boulet LP, Laviolette M, Turcotte H, Cartier A, Dugas M, Malo JL, et al. Bronchial subepithelial fibrosis correlates with airway responsiveness to methacholine. Chest. 1997;112(1):45–52. 10.1378/chest.112.1.45 - DOI - PubMed
    1. Westergren-Thorsson G, Larsen K, Nihlberg K, Andersson-Sjoland A, Hallgren O, Marko-Varga G, et al. Pathological airway remodelling in inflammation. The clinical respiratory journal. 2010;4 Suppl 1:1–8. 10.1111/j.1752-699X.2010.00190.x - DOI - PubMed
    1. Alkhouri H, Poppinga WJ, Tania NP, Ammit A, Schuliga M. Regulation of pulmonary inflammation by mesenchymal cells. Pulmonary pharmacology & therapeutics. 2014;29(2):156–65. 10.1016/j.pupt.2014.03.001 - DOI - PubMed
    1. Bergeron C, Tulic MK, Hamid Q. Airway remodelling in asthma: from benchside to clinical practice. Canadian respiratory journal. 2010;17(4):e85–93. 10.1155/2010/318029 - DOI - PMC - PubMed

Publication types