

Forecasting COVID-19 in Pakistan
- PMID: 33253248
- PMCID: PMC7703963
- DOI: 10.1371/journal.pone.0242762
Forecasting COVID-19 in Pakistan
Abstract
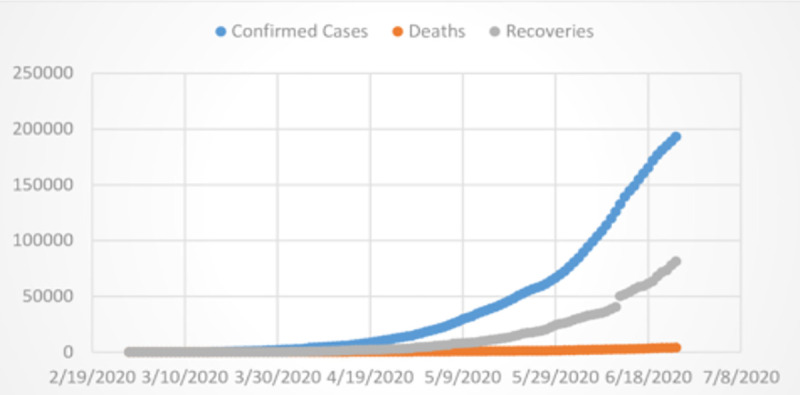
Objectives: Forecasting epidemics like COVID-19 is of crucial importance, it will not only help the governments but also, the medical practitioners to know the future trajectory of the spread, which might help them with the best possible treatments, precautionary measures and protections. In this study, the popular autoregressive integrated moving average (ARIMA) will be used to forecast the cumulative number of confirmed, recovered cases, and the number of deaths in Pakistan from COVID-19 spanning June 25, 2020 to July 04, 2020 (10 days ahead forecast).
Methods: To meet the desire objectives, data for this study have been taken from the Ministry of National Health Service of Pakistan's website from February 27, 2020 to June 24, 2020. Two different ARIMA models will be used to obtain the next 10 days ahead point and 95% interval forecast of the cumulative confirmed cases, recovered cases, and deaths. Statistical software, RStudio, with "forecast", "ggplot2", "tseries", and "seasonal" packages have been used for data analysis.
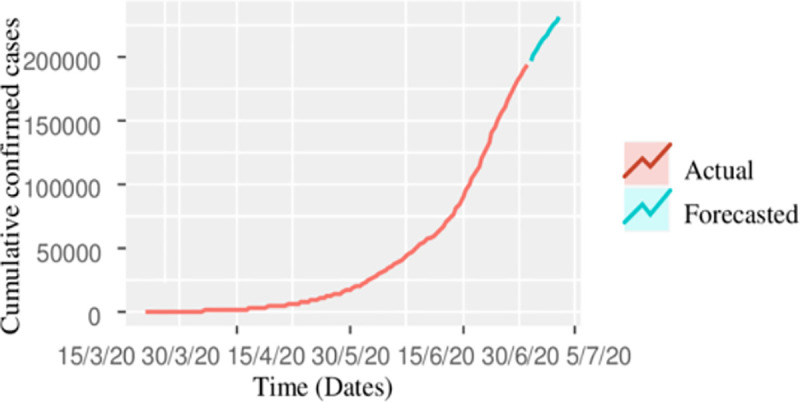
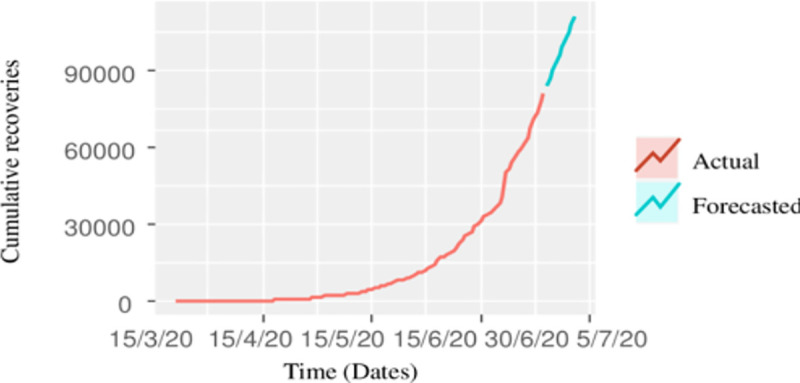
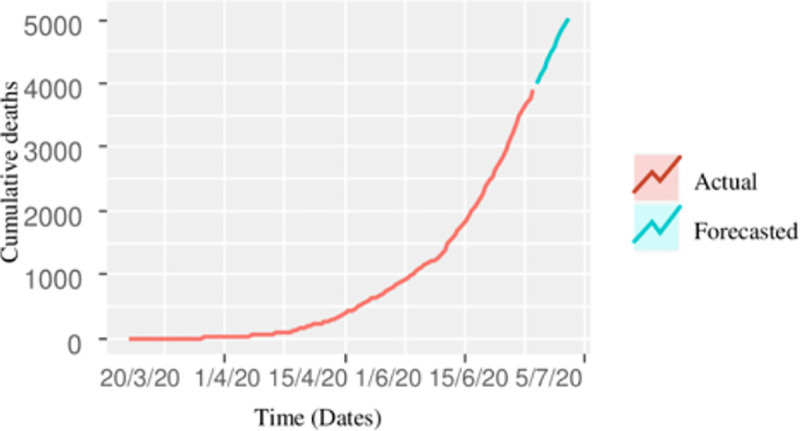
Results: The forecasted cumulative confirmed cases, recovered, and the number of deaths up to July 04, 2020 are 231239 with a 95% prediction interval of (219648, 242832), 111616 with a prediction interval of (101063, 122168), and 5043 with a 95% prediction interval of (4791, 5295) respectively. Statistical measures i.e. root mean square error (RMSE) and mean absolute error (MAE) are used for model accuracy. It is evident from the analysis results that the ARIMA and seasonal ARIMA model is better than the other time series models in terms of forecasting accuracy and hence recommended to be used for forecasting epidemics like COVID-19.
Conclusion: It is concluded from this study that the forecasting accuracy of ARIMA models in terms of RMSE, and MAE are better than the other time series models, and therefore could be considered a good forecasting tool in forecasting the spread, recoveries, and deaths from the current outbreak of COVID-19. Besides, this study can also help the decision-makers in developing short-term strategies with regards to the current number of disease occurrences until an appropriate medication is developed.
Conflict of interest statement
The authors have declared that no competing interests exist.
Figures
References
-
- World Health Organization. “Coronavirus disease 2019 (COVID-19): situation report, 156”. (2020).
-
- Papastefanopoulos V; Linardatos P and Kotsiantis S. (2020), COVID-19: A Comparison of Time Series Methods to Forecast Percentage of Active Cases per Population; Appl. Sci.,10, 3880; 10.3390/app10113880 - DOI
MeSH terms
LinkOut - more resources
Full Text Sources
Medical
