. 2020 Nov 30;16(11):e1009079.
doi: 10.1371/journal.ppat.1009079. eCollection 2020 Nov.

Global discovery of human-infective RNA viruses: A modelling analysis

Affiliations

Global discovery of human-infective RNA viruses: A modelling analysis

Feifei Zhang et al. PLoS Pathog. .

Abstract

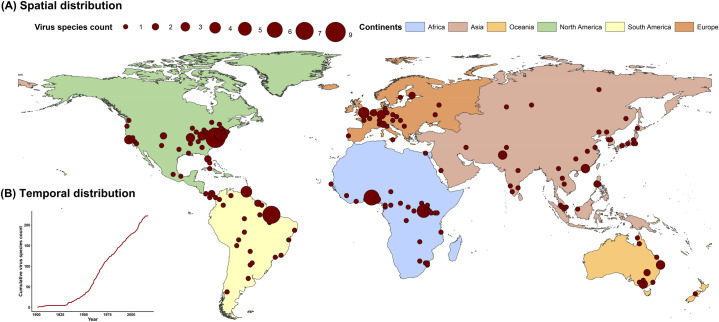
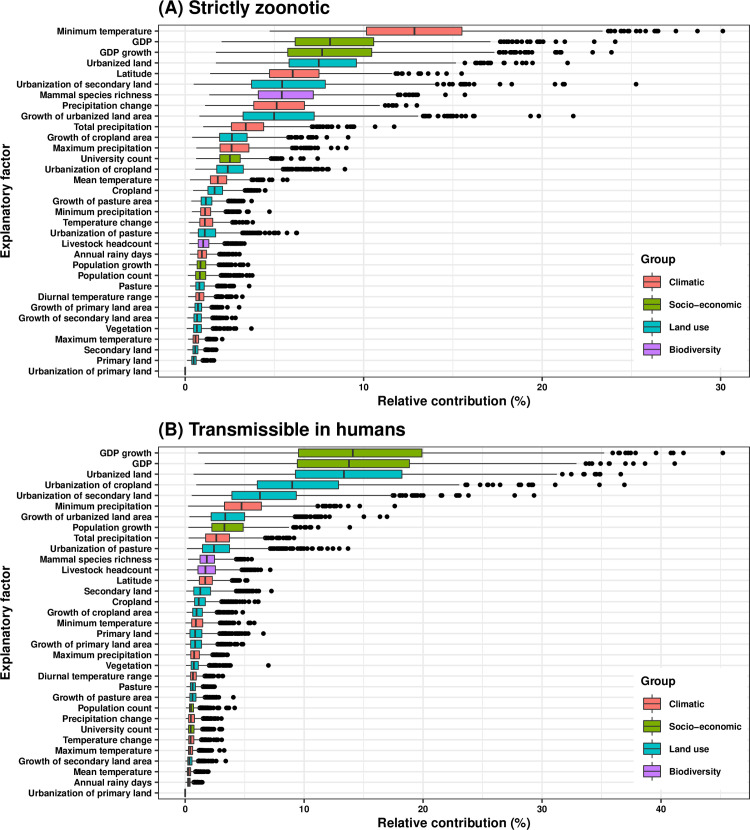
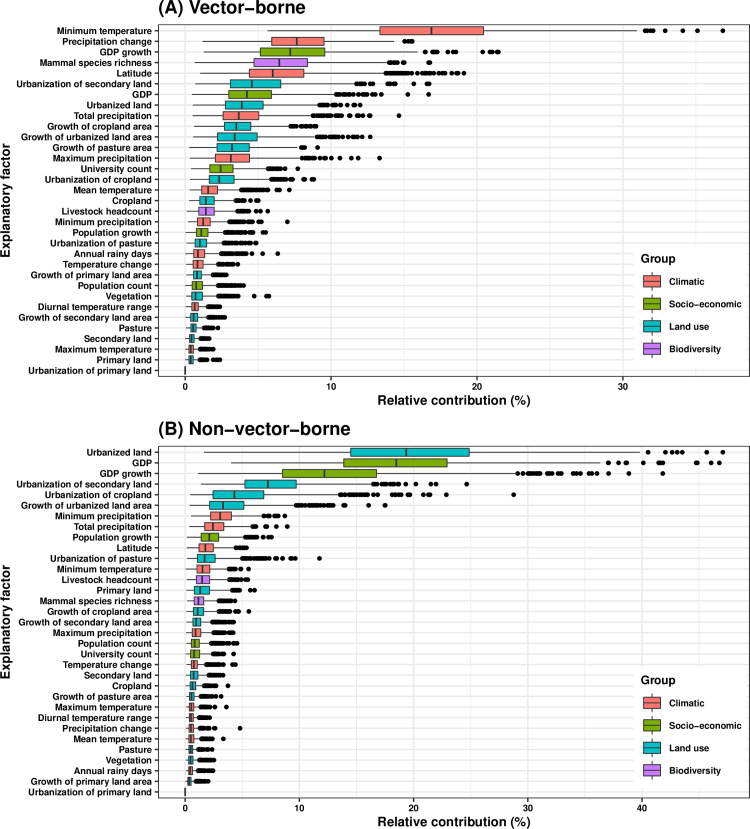
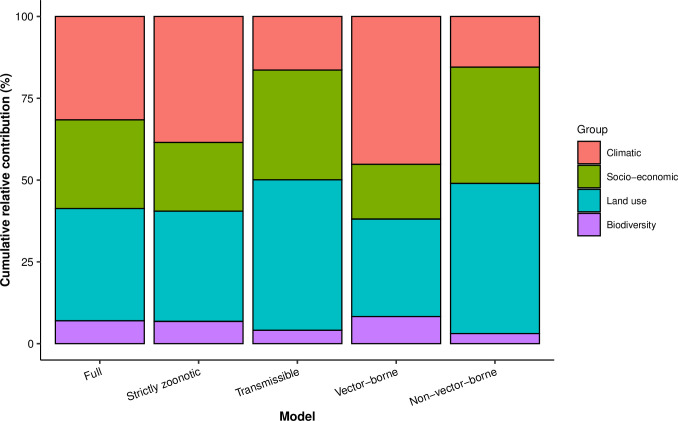
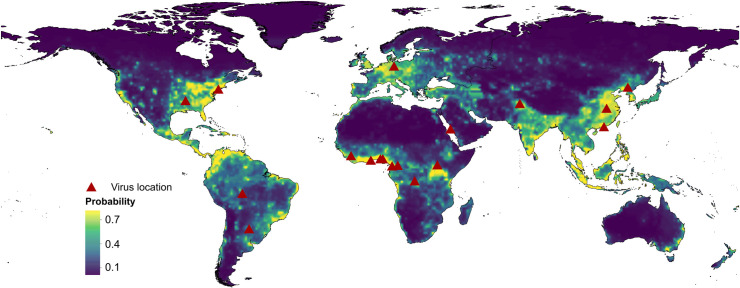
RNA viruses are a leading cause of human infectious diseases and the prediction of where new RNA viruses are likely to be discovered is a significant public health concern. Here, we geocoded the first peer-reviewed reports of 223 human RNA viruses. Using a boosted regression tree model, we matched these virus data with 33 explanatory factors related to natural virus distribution and research effort to predict the probability of virus discovery across the globe in 2010-2019. Stratified analyses by virus transmissibility and transmission mode were also performed. The historical discovery of human RNA viruses has been concentrated in eastern North America, Europe, central Africa, eastern Australia, and north-eastern South America. The virus discovery can be predicted by a combination of socio-economic, land use, climate, and biodiversity variables. Remarkably, vector-borne viruses and strictly zoonotic viruses are more associated with climate and biodiversity whereas non-vector-borne viruses and human transmissible viruses are more associated with GDP and urbanization. The areas with the highest predicted probability for 2010-2019 include three new regions including East and Southeast Asia, India, and Central America, which likely reflect both increasing surveillance and diversity of their virome. Our findings can inform priority regions for investment in surveillance systems for new human RNA viruses.


Conflict of interest statement

The authors disclose no conflicts of interest.

Figures

Fig 1
Fig 1. Spatiotemporal distribution of human RNA virus discovery count from 1901 to 2018.
(A) Spatial distribution. The red spots indicate discovery points or centroids of polygons (administrative regions)–depending on the preciseness of the location provided by the original paper, with the size representing the cumulative virus species count. Centroid is the coordinate of the centre of mass in a spatial object. (B) Temporal distribution. The red curve indicates the cumulative virus species discovery count over time.
Fig 2
Fig 2. Relative contribution of explanatory factors to human RNA virus discovery in the full model.
The boxplots show the median (black bar) and interquartile range (box) of the relative contribution across 1000 replicate models, with whiskers indicating minimum and maximum and black dots indicating outliers.
Fig 3
Fig 3. Relative contribution of explanatory factors to human RNA virus discovery in the stratified model by transmissibility.
(A) Strictly zoonotic, (B) Transmissible in humans. The boxplots show the median (black bar) and interquartile range (box) of the relative contribution across 1000 replicate models, with whiskers indicating minimum and maximum and black dots indicating outliers.
Fig 4
Fig 4. Relative contribution of explanatory factors to human RNA virus discovery in the stratified model by transmission mode.
(A) Vector-borne, (B) Non-vector-borne. The boxplots show the median (black bar) and interquartile range (box) of the relative contribution across 1000 replicate models, with whiskers indicating minimum and maximum and black dots indicating outliers.
Fig 5
Fig 5. Cumulative relative contribution of explanatory factors to human RNA virus discovery by group in each model.
The relative contributions of all explanatory factors sum to 100% in each model, and each colour represents the cumulative relative contribution of all explanatory factors within each group. The relative contribution of different groups to virus discovery varies across each model.
Fig 6
Fig 6. Predicted probability of human RNA virus discovery in 2010–2019.
The triangles represented the actual discovery sites from 2010 to 2018, and the background colour represented the predicted discovery probability.

Similar articles

Cited by

References

    1. Woolhouse MEJ, Brierley L. Epidemiological characteristics of human-infective RNA viruses. Scientific data. 2018;5:180017 10.1038/sdata.2018.17 - DOI - PMC - PubMed
    1. Tang JW, Lam TT, Zaraket H, Lipkin WI, Drews SJ, Hatchette TF, et al. Global epidemiology of non-influenza RNA respiratory viruses: data gaps and a growing need for surveillance. The Lancet Infectious diseases. 2017;17(10):e320–e6. 10.1016/S1473-3099(17)30238-4 - DOI - PMC - PubMed
    1. Clark LE, Mahmutovic S, Raymond DD, Dilanyan T, Koma T, Manning JT, et al. Vaccine-elicited receptor-binding site antibodies neutralize two New World hemorrhagic fever arenaviruses. Nature communications. 2018;9(1):1884 10.1038/s41467-018-04271-z - DOI - PMC - PubMed
    1. Lopman BA, Steele D, Kirkwood CD, Parashar UD. The Vast and Varied Global Burden of Norovirus: Prospects for Prevention and Control. PLoS medicine. 2016;13(4):e1001999 10.1371/journal.pmed.1001999 - DOI - PMC - PubMed
    1. WHO. HIV/AIDS report 2018 Geneva: World Health Organization; Available from: https://www.who.int/en/news-room/fact-sheets/detail/hiv-aids (accessed 19 July 2018).

Publication types