. 2020 Dec 1;143(12):3629-3652.
doi: 10.1093/brain/awaa343.

Brain cancer induces systemic immunosuppression through release of non-steroid soluble mediators

Affiliations

Brain cancer induces systemic immunosuppression through release of non-steroid soluble mediators

Katayoun Ayasoufi et al. Brain. .

Abstract

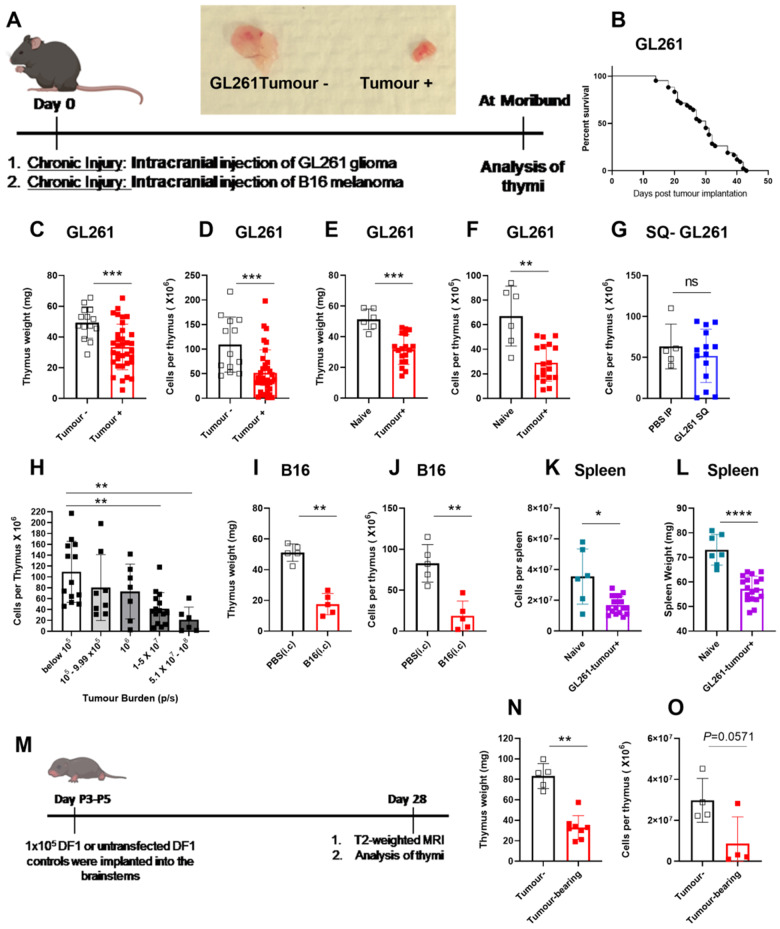
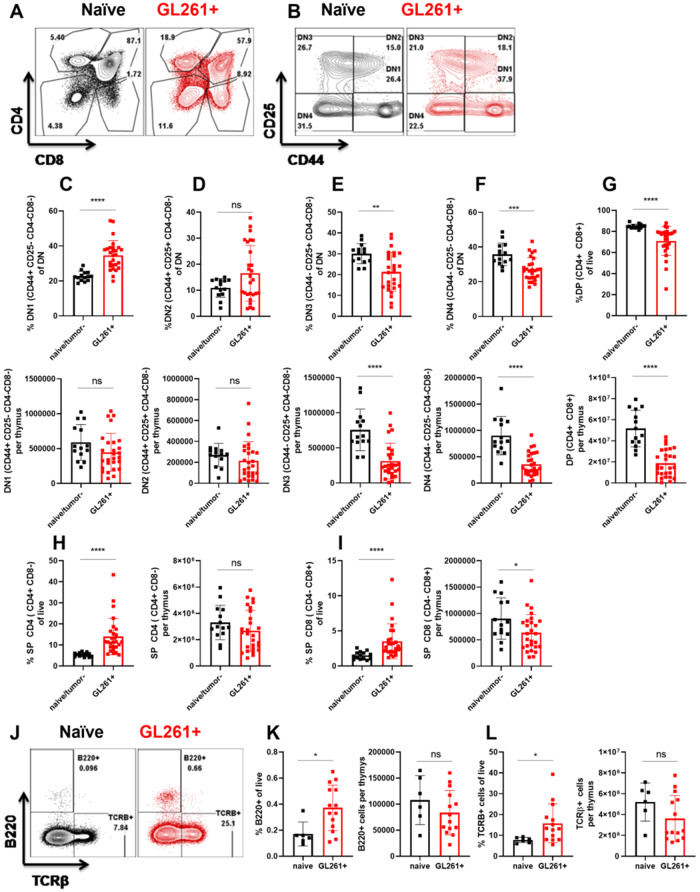
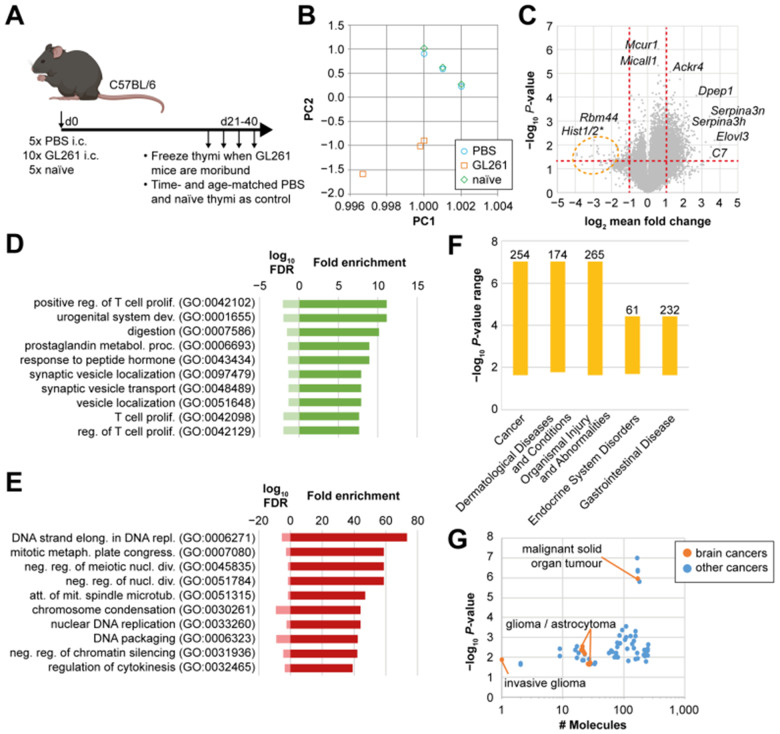
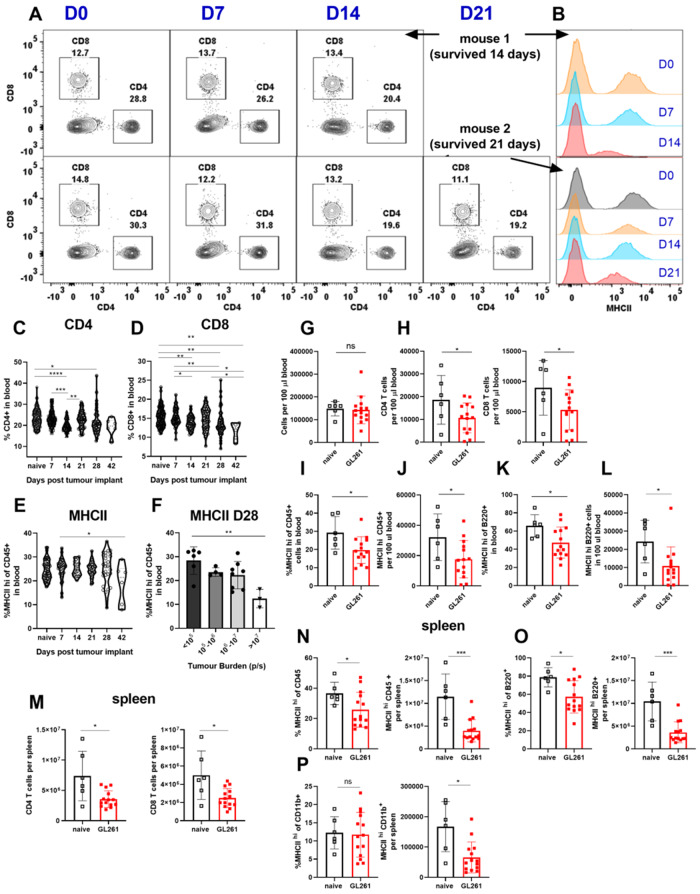
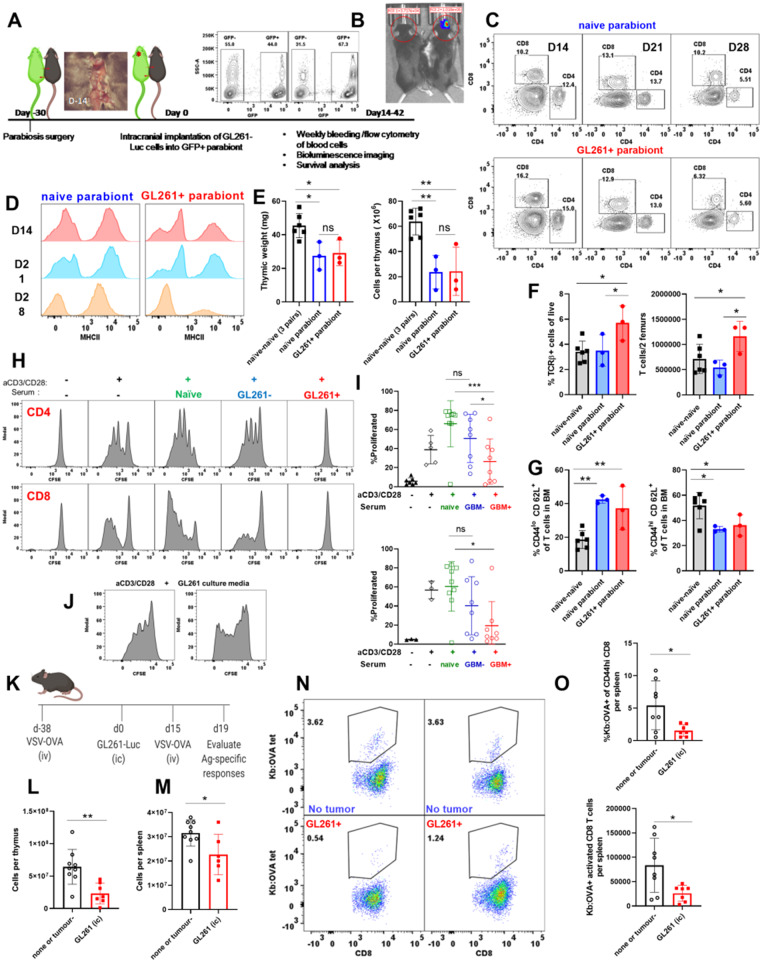
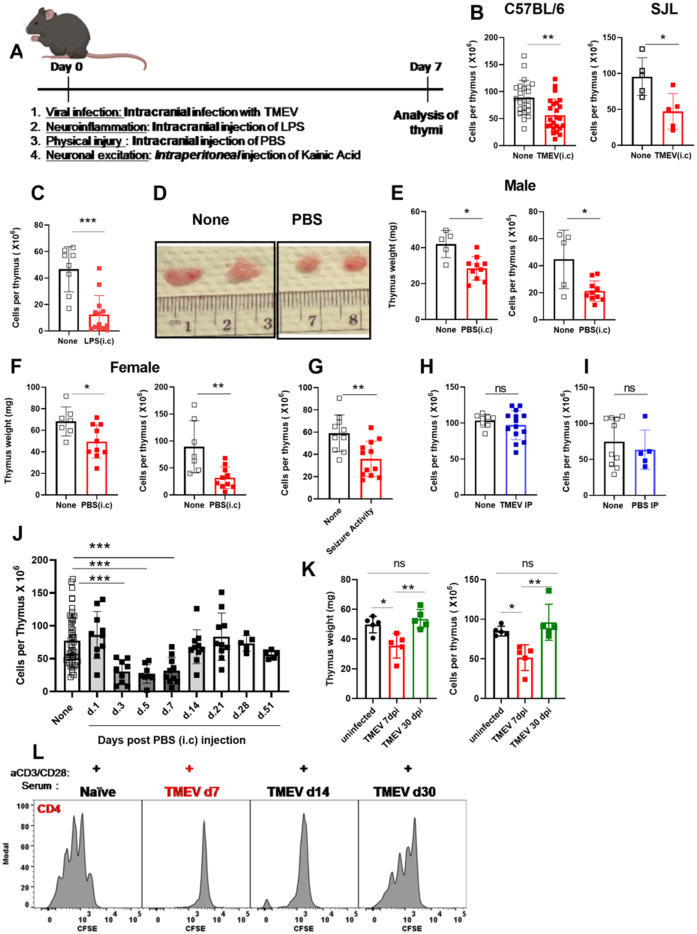
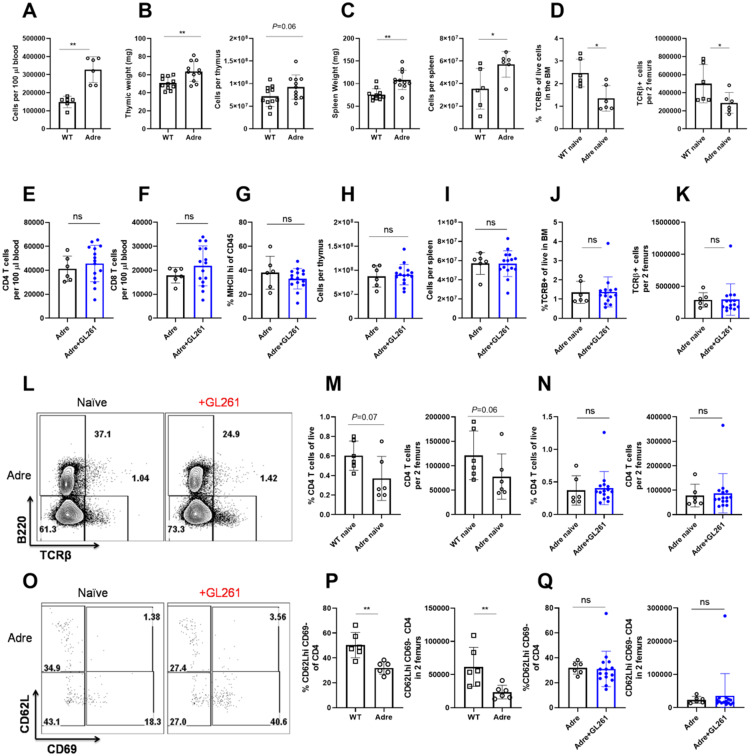
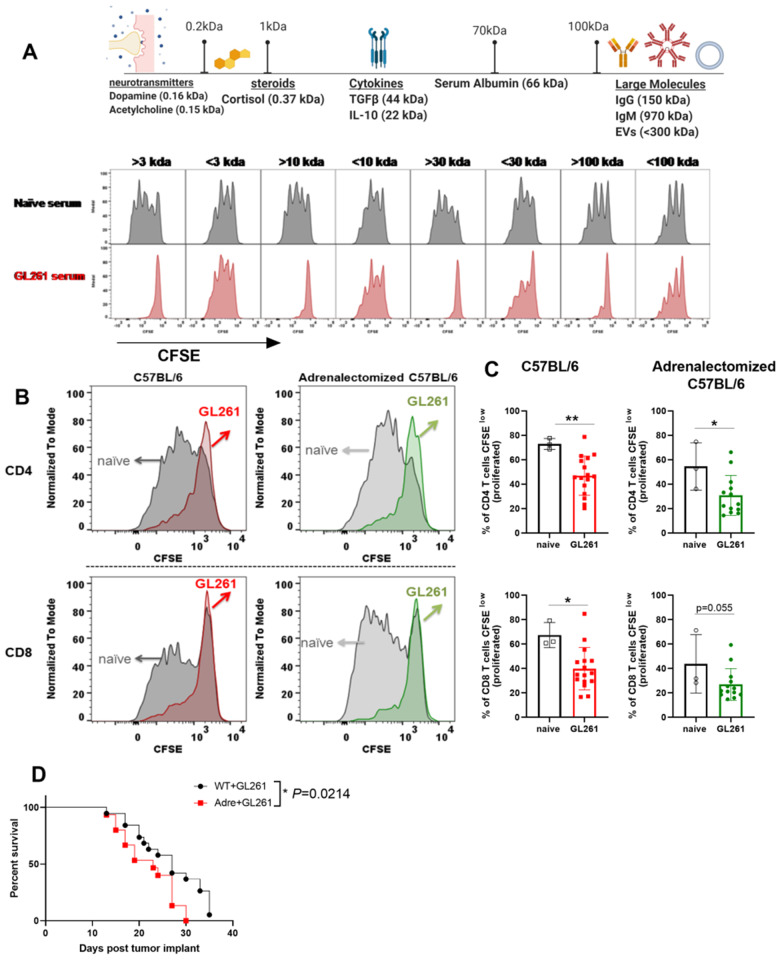
Immunosuppression of unknown aetiology is a hallmark feature of glioblastoma and is characterized by decreased CD4 T-cell counts and downregulation of major histocompatibility complex class II expression on peripheral blood monocytes in patients. This immunosuppression is a critical barrier to the successful development of immunotherapies for glioblastoma. We recapitulated the immunosuppression observed in glioblastoma patients in the C57BL/6 mouse and investigated the aetiology of low CD4 T-cell counts. We determined that thymic involution was a hallmark feature of immunosuppression in three distinct models of brain cancer, including mice harbouring GL261 glioma, B16 melanoma, and in a spontaneous model of diffuse intrinsic pontine glioma. In addition to thymic involution, we determined that tumour growth in the brain induced significant splenic involution, reductions in peripheral T cells, reduced MHC II expression on blood leucocytes, and a modest increase in bone marrow resident CD4 T cells. Using parabiosis we report that thymic involution, declines in peripheral T-cell counts, and reduced major histocompatibility complex class II expression levels were mediated through circulating blood-derived factors. Conversely, T-cell sequestration in the bone marrow was not governed through circulating factors. Serum isolated from glioma-bearing mice potently inhibited proliferation and functions of T cells both in vitro and in vivo. Interestingly, the factor responsible for immunosuppression in serum is non-steroidal and of high molecular weight. Through further analysis of neurological disease models, we determined that the immunosuppression was not unique to cancer itself, but rather occurs in response to brain injury. Non-cancerous acute neurological insults also induced significant thymic involution and rendered serum immunosuppressive. Both thymic involution and serum-derived immunosuppression were reversible upon clearance of brain insults. These findings demonstrate that brain cancers cause multifaceted immunosuppression and pinpoint circulating factors as a target of intervention to restore immunity.

Keywords: T cells; glioblastoma; immunosuppression; neuroimmunology; thymus; .


Figures

Figure 1
Figure 1
Experimental models of brain cancer induce sustained thymic involution. (A) Experimental design is shown. Mice are implanted with 60 000 luciferase-bearing GL261 cells or 10 000 B16-F1 melanoma cells in the frontal lobe of the brain 3-mm deep. Gross analysis of thymi taken from a GL261 tumour- bearing mouse compared to a tumour-negative mouse. Thymi were analysed at the time glioma-bearing mice become moribund. (B) Survival of GL261 tumour-bearing mice is shown. Tumour take is 70–90% rendering the remaining 10–30% tumour-negative. Survival plot only shows tumour-bearing mice. (C) Thymic weight (D) and cellularity is compared between GL261 tumour-bearing and tumour-negative mice at the time glioma-bearing mice become moribund. Tumour-negative and tumour-bearing mice are age-matched. Similarly (E and F) GL261- bearing mice have significantly smaller thymi as measured by thymic weight and cellularity compared to naïve unmanipulated mice. (G) Subcutaneous implantation of GL261-Luc cells did not result in thymic involution. (H) Thymic cellularity was inversely correlated with tumour burden in GL261-Luc tumour-bearing mice. Mice were binned based on bioluminescence imaging at the time of euthanasia and thymic cellularity was plotted against tumour burden (as measured by bioluminescence intensity). Bioluminescence intensity (photon/s) was calculated by placing a circular region of interest over the head. Mice with bioluminescence intensities above 105 (photon/s) were considered to be tumour-bearing whereas those below 105 (photon/s) were considered to be tumour-negative. (I) Thymic weight and (J) cellularity are compared between PBS-injected and B16-F1 melanoma implanted mice on Day 11 when B16-F1 implanted mice became moribund. (K and L) Similar to the thymus, spleens of glioma-bearing mice (GL261-Luc implanted) are significantly reduced in size when compared to naïve unmanipulated controls (K, weight; L, cellularity). (M) Experimental design for implantation and analysis of RCAS-bearing spontaneous gliomas is shown. Briefly, DF1 chicken fibroblasts cultured in DMEM with 10% FBS at 39°C and 5% CO2 were transfected with RCAS vectors (PDGFb, H3.3K27M, and Cre recombinase). After 2–3 weeks of passaging, 105 DF1 cells with a 1:1:1 vector ratio or untransfected DF1controls were implanted into the brainstems of postnatal Day P3-P5 Nestin Tv-a, p53fl/fl pups. In this model, 3–5-day-old mice were intracranially injected with cells that can induce spontaneous glioma growth in the brainstem. After 28 days, all mice underwent T2-weighted MRI to assess tumour volumes. Mice with detectable tumours and non-tumour-bearing control mice were euthanized for assessment of the thymus. (N) Thymic weight and (O) cellularity in tumour-negative versus RCAS tumour-bearing is shown. n =4–8 for RCAS experiments. n =13–34 in GL261 experiment pooled from three to four independent experiments. n =5 in B16-F1 experiment. All B16 implanted mice developed detectable tumours. Data are shown as individual mice with mean. Error bars represent standard deviation. Mann-Whitney U-test was used to assess statistical significance. ns: P 0.05, *P =0.01 to 0.05, **P =0.001 to 0.01, ***P =0.0001 to 0.001, ****P <0.0001.
Figure 2
Figure 2
Brain tumours induce changes within the thymus that dysregulate T-cell development. (A and B) Gating strategy is shown using representative naïve and glioma-bearing mice. (A) Following gating on singlets, live, and CD45+ cells, we used CD4 and CD8 parameters to determine double-negative (DN), double-positive (DP), SP4 (single-positive CD4), and SP8 (single-positive CD8) T cells. (B) We then focused on the double-negative gate to define DN1–4 populations. DN1 is defined as CD44+CD25, DN2 is defined as CD44+CD25+, DN3 is defined as CD44CD25+, and DN4 is defined as CD44CD25 populations within the double-negative gate. (CG) Frequencies (top) and numbers (bottom) of DN1–DN4 and double-positive cells are quantified between naïve or tumour (−), and glioma-bearing mice. (H and I) Frequencies and numbers of single-positive CD4 and CD8 T cells are quantified. n = 14–27. Data are shown as individual mice with mean. Data are pooled from two independent experiments. This experiment was repeated five times and similar results were obtained. Error bars represent standard deviation. Mann-Whitney U-test was used to assess statistical significance. ns: P 0.05, *P = 0.01 to 0.05, **P = 0.001 to 0.01, ***P = 0.0001 to 0.001, ****P < 0.0001. (J) Post selection TCRβ+ cells and B220+ B cells within the thymus are increased in glioma-bearing mice compared to controls. (K) Frequencies and numbers of thymic B cells are quantified. (L) Frequencies and numbers of TCRβ+ cells in the thymus are quantified. n = 6–14. Data are shown as individual mice with mean. Error bars represent standard deviation. Mann-Whitney U-test was used to assess statistical significance. ns: P 0.05, *P = 0.01 to 0.05, **P = 0.001 to 0.01, ***P = 0.0001 to 0.001, ****P < 0.0001.
Figure 3
Figure 3
Thymic homeostasis is uniquely affected by a brain tumour. (A) Experimental design for RNA-seq experiment. (B) Principal component analysis of RNA-seq data from three thymi each of PBS-injected, GL261-bearing or naïve mice. (C) Differential gene expression between GL261-bearing and naïve thymi. Vertical red dotted lines indicate 2-fold change in expression. Horizontal red dotted line indicates threshold for statistical significance. Highly differentially expressed genes are indicated with gene symbols. Orange circle indicates a cluster of histone 1 and 2 genes. Significance was determined by one-way ANOVA and post t-test. (D and E) Panther Slim-gene onthology pathway analysis of genes up- (D) or downregulated (E) at least 2-fold in GL261 against naïve samples are shown. Fold enrichment indicates the number of genes detected in each pathway. FDR = false discovery rate. (F) Ingenuity pathway analysis of top diseases associated with our dataset. Bars indicate P-value range of diseases. Numbers on top indicate the number of molecules detected for each disease. (G) Individual number of molecules and P-values for different types of cancers from ingenuity pathway analysis. Orange dots indicate brain tumours, blue dots are other forms of cancer.
Figure 4
Figure 4
Mice harbouring GL261 gliomas exhibit peripheral immunosuppression consistent with patients with GBM. (A) CD4 and CD8 T-cell levels are tracked through weekly bleeding in individual mice. (B) MHCII expression on all CD45+ cells in blood is tracked weekly in individual mice. (C and D) Two representative mice are shown. (C) Frequencies of CD4 and (D) CD8 and (E) MHCII expression on CD45+ cells in blood are tracked across GL261 implanted mice through weekly bleeding (n =6–124). Data are pooled from four to five independent experiments. (I) Variability in MHCII expression on blood CD45+ cells on Day 28 is plotted as a function of tumour burden as measured by bioluminescence intensity (n =3–8) data are pooled from two independent experiments. (G) Total cells per 100 µl of blood do not change between naïve and glioma bearing mice. Blood comparisons in GL are made at times when GL261-bearing mice became moribund. (H) Reduction in frequency of CD4 and CD8 T cells translates into a reduction in total counts of CD4 and CD8 T cells in blood. (I) Frequency and (J) number of CD45+ cells in blood with high expression of MHCII is quantified. Similarly, (K) frequency and (L) numbers of B cells with high levels of MHCII expression in blood are decreased in glioma-bearing mice compared to controls. (M) Numbers of CD4, and CD8 T cells, and (N) frequencies and numbers of MHCIIhi CD45+, (O) MHCIIhi B cells, and (P) counts of MHCIIhi CD11b+ cells are compared between glioma-bearing and naïve mice in the spleen. For T-cell gating: we gated on singlets, live, CD45+, TCRβ+ B220, CD4+ or CD8+ cells. For B-cell gating, we used singlets, live, CD45+, or TCRβB220+ cells. For CD11b gating, we used singlets, live, CD45+, TCRβB220, or CD11b+ cells. Data are shown as individual mice with mean. Error bars represent standard deviation. One-way ANOVA with Tukey's multiple comparisons test was used to assess statistical significance for CF. Mann-Whitney U-test was used to assess statistical significance in GP. ns: P 0.05, *P = 0.01 to 0.05, **P = 0.001 to 0.01, ***P = 0.0001 to 0.001, ****P < 0.0001.
Figure 5
Figure 5
Multifaceted systemic immunosuppression in glioma-bearing mice involves release of immunosuppressive soluble factors. (A) Schematic of parabiosis and verification of sharing of vasculature and GFP+ cells are shown. (B) Tumour burden is shown in the tumour-bearing parabiont compared to the tumour-free partner. (C) A representative flow plot of blood CD4 and CD8 frequencies is shown in both parabionts from three consecutive weeks post tumour implant. (D) MHCII expression on CD45+ cells in the blood is shown from three consecutive bleeds. (E) Thymi from naïve and glioma-bearing parabionts are compared to naïve-to-naïve parabionts. (E,left) Thymic weight and (E,right) cellularity is compared between naïve-to-naïve and naïve-to-tumour-bearing parabionts. (F) Parabiosis of a tumour-bearing to a non-tumour-bearing mouse revealed that T-cell sequestration in the bone marrow only occurs in the GL261+ parabiont and not in the attached tumour-free parabiont. (G) However, phenotype of bone marrow resident T cells changes in both tumour-bearing and tumour-free parabionts when compared to naïve-naïve counterparts. Exposure to the circulation of tumour-bearing mouse is sufficient to induce enrichment in naïve L selectin+ bone marrow resident T cells in the attached animal with no glioma in the brain. (H) Representative histograms depict CD4 (top) and CD8 (bottom) T-cell proliferation with and without anti-CD3/CD28 Dynabeads in the presence and absence of serum from naïve, tumour (−) and GL261 glioma-bearing mice. To do this assay, T cells from spleens and lymph nodes (inguinal, brachial, and axial lymph nodes) of naïve unmanipulated C57BL/6 mice were isolated and labelled with CFSE. Cells were plated either at 700 000 cells/well in a 96-well plate, or at 1.6 × 106 cells/well in a 24-well plate. Anti-CD3/CD28 beads were added at either 19 µl/well for 96-well plates or at 75 µl/well for 24-well plates. Total volume was 1 ml in 24-well plates and 250 µl in 96-well plates. To these cultures, we added 12.5µl of serum isolated from experimental mice to 96-well plates or 50 µl of serum in 24-well plates. CFSE dilution was assessed using flow cytometry 72 h later. CFSE dilution is shown. (I) Per cent cells with CFSE dilution is quantified as a measure of proliferation for each condition. (I,top) shows quantification for CD4 T-cells and (I,bottom) indicates CD8 quantification. (J) GL261 cell culture media is shown to not prevent T-cell proliferation. (K) Experimental design is shown for evaluation of memory responses generated against VSV-OVA during glioma progression. (L) Thymic and splenic (M) cellularity decreased in glioma-bearing mice previously infected with VSV-OVA compared to mice with no brain injury or tumour (−) controls. (N and O) Frequencies and numbers of Kb:OVA tetramer + CD8 T cells are quantified in spleens of glioma-bearing and control mice 4 days post VSV-OVA rechallenge. One-way ANOVA with Tukey's multiple comparisons test was used to assess statistical significance for groups larger than two. For comparisons between two groups, Mann-Whitney U-test was used. For F and G, one-way ANOVA was performed and then an uncorrected Fisher’s LSD test was used to compare selected pairs. ns: P 0.05, *P = 0.01 to 0.05, **P = 0.001 to 0.01, ***P = 0.0001 to 0.001, ****P < 0.0001. BM = bone marrow.
Figure 6
Figure 6
Acute neurological insults with various origins that are delivered to the CNS result in similar thymic involution. (A) Experimental design is shown. (B) Thymi were analysed on Day 7 post neurological insults. (B) Thymic cellularity is quantified in C57BL/6 (left) and in SJL mice (right) 7 days post TMEV (intracranial, i.c) infection. (C) Thymic cellularity is significantly decreased post LPS (i.c.) injection compared to naïve controls. (D) Gross comparison of thymi from sham control (PBS i.c) and naïve unmanipulated mice. (E,left, and F,left) Thymic weight and cellularity are both significantly reduced in mice injected with PBS (i.c) (E and F). The decrease in thymic cellularity post PBS injection is reproduced in both male (E) and female (F) mice. (G) Mice injected with KA that had an acute seizure activity measured by Racine’s modified scoring system, had a similar thymic involution. In male mice, seizure was induced by injecting 17.5 mg/kg of KA per mouse. In female mice, seizure was induced using 15.5 mg/kg of KA. All mice received valproic acid to stop seizure activity at 90 min post KA injection. Mice injected with KA were scored using a modified Racine score. Mice with scores of 0 were excluded from the study. Fifty per cent of males experienced a stage 4/5 seizure and died within the first hour post KA injection, thus only the remaining mice were used for analysis. Female mice that did not have any seizure activity by 50 min were injected with an extra 3 mg/kg of KA and their seizure activity was monitored. (H) TMEV infection or (I) PBS injection intraperitoneally (IP) do not induce thymic involution. (J) Thymic involution due to intracranial injection of PBS is reversible. (J) Thymi were harvested at time points post intracranial injection and cellularity was evaluated. (K) Thymic involution following the clearance of TMEV is also reversible. (K,left) Thymic involution as measured by a reduction in thymic cellularity and (K,right) thymic weight is observed on Day 7 post intracranial TMEV infection, but not on Day 30. (L) T-cell proliferation is shown in the presence of serum isolated from TMEV (i.c) infected mice on Days 7, 14 and 30 post infection. n = 5–23 based on the experiment. Graphs show pooled data from two to five independent experiments. Data are shown as individual mice with mean. Error bars represent standard deviation. Mann-Whitney U-test or a one-way ANOVA with Tukey’s multiple comparison test was used to assess statistical significance. ns: P 0.05, *P = 0.01 to 0.05, **P = 0.001 to 0.01, ***P = 0.0001 to 0.001, ****P < 0.0001.
Figure 7
Figure 7
Hormones produced by the adrenal gland control immune organ size and cellularity at baseline. (A) Cellularity of blood per equal volume is increased in naïve adrenalectomized mice compared to naïve wild-type (WT) mice. (B) Thymic weight and cellularity is increased in naïve adrenalectomized mice compared to naïve wild-type mice. (C) Spleen weight and cellularity is increased in naïve adrenalectomized mice compared to naïve wild-type mice. (D) Bone marrow of naïve wild-type mice harbour an increased frequency and numbers of T cells when compared to adrenalectomized controls. (E) CD4, (F) CD8 and (G) frequency of MHCII expression on CD45+ cells in blood is equivalent between naïve and glioma-bearing adrenalectomized mice. (H) Similarly, cellularity of the thymus and (I) spleen does not change in glioma-bearing adrenalectomized mice compared to controls. (J) Frequency and (K) numbers of bone marrow resident T cells do not increase in glioma-bearing adrenalectomized mice compared to naïve adrenalectomized controls. (L) Representative flow plot of T cells within the bone marrow of naïve and glioma-bearing adrenalectomized mice is shown. (M) Fewer bone marrow resident CD4 T cells are found in naïve adrenalectomized mice compared to naïve wild-type mice. (N) Frequencies and numbers of bone marrow resident CD4 T cells do not increase in glioma-bearing adrenalectomized mice when compared to adrenalectomized naïve controls. (O) Phenotype of bone marrow resident CD4 T cells in naïve and glioma-bearing mice reveals enrichment in CD62L+ cells. (P) This population is significantly decreased at baseline in naïve adrenalectomized mice when compared to wild-type mice. (Q) In contrast to wild-type mice, no increase in CD62L+CD69CD4+ T cells occurs in the bone marrow of glioma-bearing adrenalectomized mice. n = 6–14. Individual data are shown. Error bars represent standard deviation. Mann-Whitney U-test was used. ns: P 0.05, *P = 0.01 to 0.05, **P = 0.001 to 0.01, ***P = 0.0001 to 0.001, ****P < 0.0001.
Figure 8
Figure 8
Serum of glioma-bearing mice harbours a novel immunosuppressive factor with molecular weight >100 kD. (A) Sera obtained from naïve or glioma-bearing mice were isolated and passed through column-filters with a molecular weight cut-off of 3, 10, 30, or 100 kDa. Both top and bottom fractions were collected and their ability to inhibit T-cell proliferation was tested. T cells obtained from naïve mice were labelled with CFSE and cultured with anti CD3/CD28 Dynabeads in the presence of individual fractions isolated from serum of naïve or glioma-bearing mice. Proliferation was measured 72 h later using flow cytometry. Serum fractions with high molecular weights (>3, >10, >30, >100 kDa) were deemed immunosuppressive as they potently inhibited T-cell proliferation in vitro. These data argue against cortisol or other small molecules related to stress hormone pathways playing a role as the immunosuppressive factor produced by the brain during neurological injuries. The molecular weight of the immunosuppressive factor released into serum during neurological injuries is >100 kDa. (B and C) Consistent with this, we tested the serum obtained from glioma-bearing wild-type (WT) or adrenalectomized mice. Serum isolated from glioma-bearing wild-type and adrenalectomized mice inhibited T-cell proliferation in vitro. (D) Glioma-bearing adrenalectomized mice did not have a survival benefit over wild-type mice despite lacking several facets of immunosuppression. For A, sera obtained from 10 GL261-bearing mice were pooled for analysis. For B and C, n = 3–10. Data are shown as individual mice with mean. Error bars represent standard deviation. Mann-Whitney U-test was used to assess statistical significance. ns: P 0.05, *P = 0.01 to 0.05, **P = 0.001 to 0.01, ***P = 0.0001 to 0.001, **** P < 0.0001.

References

    1. Andaloussi AE, Han Y, Lesniak MS.. Progression of intracranial glioma disrupts thymic homeostasis and induces T-cell apoptosis in vivo. Cancer Immunol Immunother 2008; 57: 1807–16. - PMC - PubMed
    1. Antonica A, Magni F, Mearini L, Paolocci N.. Vegal control of lymphocyte release from rat thymus. J Auton Nervous Syst 1994; 48: 187–97. - PubMed
    1. Ayasoufi K, Fan R, Valujskikh A.. Depletion-resistant CD4 T cells enhance thymopoiesis during lymphopenia. Am J Transplant 2017; 17: 2008–19. - PMC - PubMed
    1. Ayasoufi K, Pfaller CK, Khadka RH, Jin F, Johnson AJ.. Brain-Thymus communication is a novel immunosuppressive feature of neurological insults. J Immunol 2019; 202(1 Supplement):183.19.
    1. Baral P, Umans BD, Li L, Wallrapp A, Bist M, Kirschbaum T, et al. Nociceptor sensory neurons suppress neutrophil and gammadelta T cell responses in bacterial lung infections and lethal pneumonia. Nat Med 2018; 24: 417–26. - PMC - PubMed

Publication types

MeSH terms

Substances