

Retinal asymmetry in multiple sclerosis
- PMID: 33253371
- PMCID: PMC7880665
- DOI: 10.1093/brain/awaa361
Retinal asymmetry in multiple sclerosis
Abstract
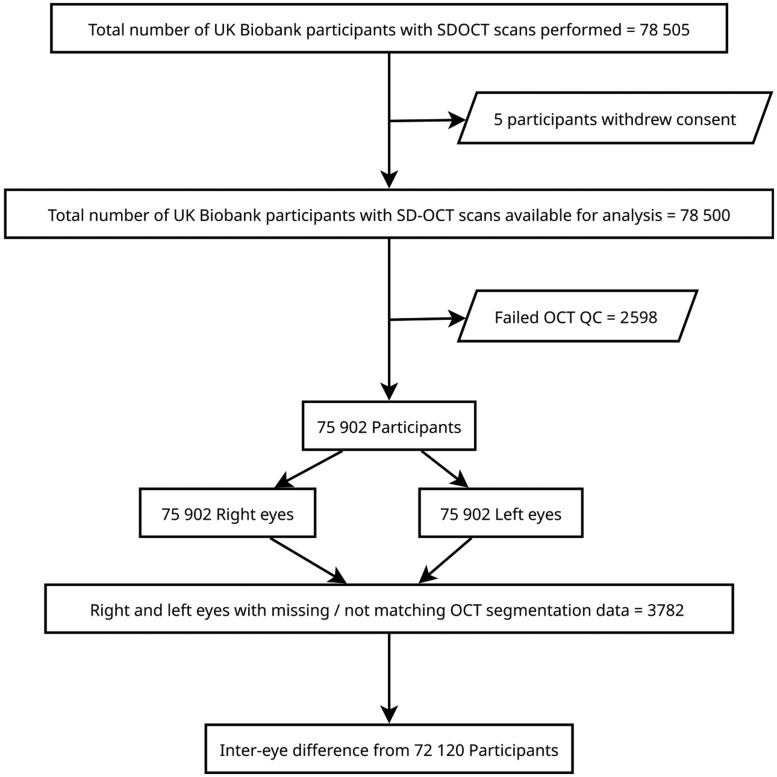
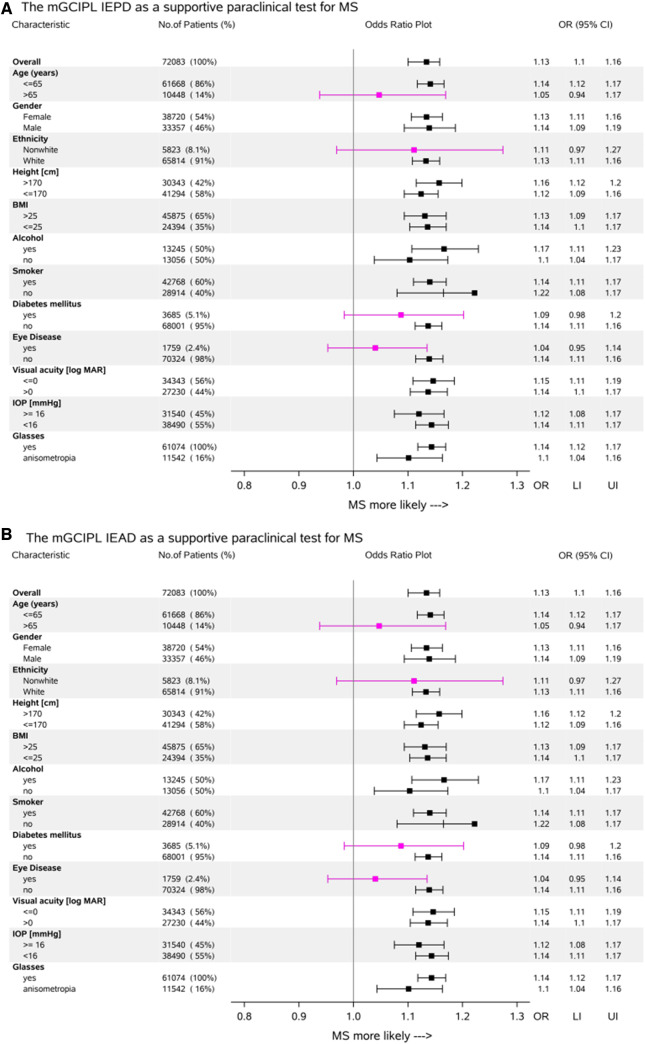
The diagnosis of multiple sclerosis is based on a combination of clinical and paraclinical tests. The potential contribution of retinal optical coherence tomography (OCT) has been recognized. We tested the feasibility of OCT measures of retinal asymmetry as a diagnostic test for multiple sclerosis at the community level. In this community-based study of 72 120 subjects, we examined the diagnostic potential of the inter-eye difference of inner retinal OCT data for multiple sclerosis using the UK Biobank data collected at 22 sites between 2007 and 2010. OCT reporting and quality control guidelines were followed. The inter-eye percentage difference (IEPD) and inter-eye absolute difference (IEAD) were calculated for the macular retinal nerve fibre layer (RNFL), ganglion cell inner plexiform layer (GCIPL) complex and ganglion cell complex. Area under the receiver operating characteristic curve (AUROC) comparisons were followed by univariate and multivariable comparisons accounting for a large range of diseases and co-morbidities. Cut-off levels were optimized by ROC and the Youden index. The prevalence of multiple sclerosis was 0.0023 [95% confidence interval (CI) 0.00229-0.00231]. Overall the discriminatory power of diagnosing multiple sclerosis with the IEPD AUROC curve (0.71, 95% CI 0.67-0.76) and IEAD (0.71, 95% CI 0.67-0.75) for the macular GCIPL complex were significantly higher if compared to the macular ganglion cell complex IEPD AUROC curve (0.64, 95% CI 0.59-0.69, P = 0.0017); IEAD AUROC curve (0.63, 95% CI 0.58-0.68, P < 0.0001) and macular RNFL IEPD AUROC curve (0.59, 95% CI 0.54-0.63, P < 0.0001); IEAD AUROC curve (0.55, 95% CI 0.50-0.59, P < 0.0001). Screening sensitivity levels for the macular GCIPL complex IEPD (4% cut-off) were 51.7% and for the IEAD (4 μm cut-off) 43.5%. Specificity levels were 82.8% and 86.8%, respectively. The number of co-morbidities was important. There was a stepwise decrease of the AUROC curve from 0.72 in control subjects to 0.66 in more than nine co-morbidities or presence of neuromyelitis optica spectrum disease. In the multivariable analyses greater age, diabetes mellitus, other eye disease and a non-white ethnic background were relevant confounders. For most interactions, the effect sizes were large (partial ω2 > 0.14) with narrow confidence intervals. In conclusion, the OCT macular GCIPL complex IEPD and IEAD may be considered as supportive measurements for multiple sclerosis diagnostic criteria in a young patient without relevant co-morbidity. The metric does not allow separation of multiple sclerosis from neuromyelitis optica. Retinal OCT imaging is accurate, rapid, non-invasive, widely available and may therefore help to reduce need for invasive and more costly procedures. To be viable, higher sensitivity and specificity levels are needed.
Keywords: biomarkers; demyelination; imaging; multiple sclerosis; optic neuritis.
© The Author(s) (2020). Published by Oxford University Press on behalf of the Guarantors of Brain.
Figures

References
-
- Albers C, Lakens D.. When power analyses based on pilot data are biased: inaccurate effect size estimators and follow-up bias. J Exp Soc Psychol 2018; 74: 187–95.
-
- Aly L, Havla J, Lepennetier G, Andlauer TFM, Sie C, Strauß E-M, et al.Inner retinal layer thinning in radiologically isolated syndrome predicts conversion to multiple sclerosis. Eur J Neurol 2020. doi: 10.1111/ene.14416. - PubMed
-
- Balk L, Tewarie P, Killestein J, Polman C, Uitdehaag B, Petzold A.. Disease course heterogeneity and OCT in multiple sclerosis. Mult Scler 2014; 20: 1198–206. - PubMed
-
- Behbehani R, Ali A, Al-Omairah H, Rousseff RT.. Optimization of spectral domain optical coherence tomography and visual evoked potentials to identify unilateral optic neuritis. Mult Scler Relat Disord 2020; 41: 101988. - PubMed
-
- Cameron JR, Megaw RD, Tatham AJ, McGrory S, MacGillivray TJ, Doubal FN, et al.Lateral thinking - Interocular symmetry and asymmetry in neurovascular patterning, in health and disease. Prog Retin Eye Res 2017; 59: 131–57. - PubMed
Publication types
MeSH terms
Grants and funding
LinkOut - more resources
Full Text Sources
Medical
