

Patterns of Load-to-Strength Ratios Along the Spine in a Population-Based Cohort to Evaluate the Contribution of Spinal Loading to Vertebral Fractures
- PMID: 33253414
- PMCID: PMC8383210
- DOI: 10.1002/jbmr.4222
Patterns of Load-to-Strength Ratios Along the Spine in a Population-Based Cohort to Evaluate the Contribution of Spinal Loading to Vertebral Fractures
Abstract
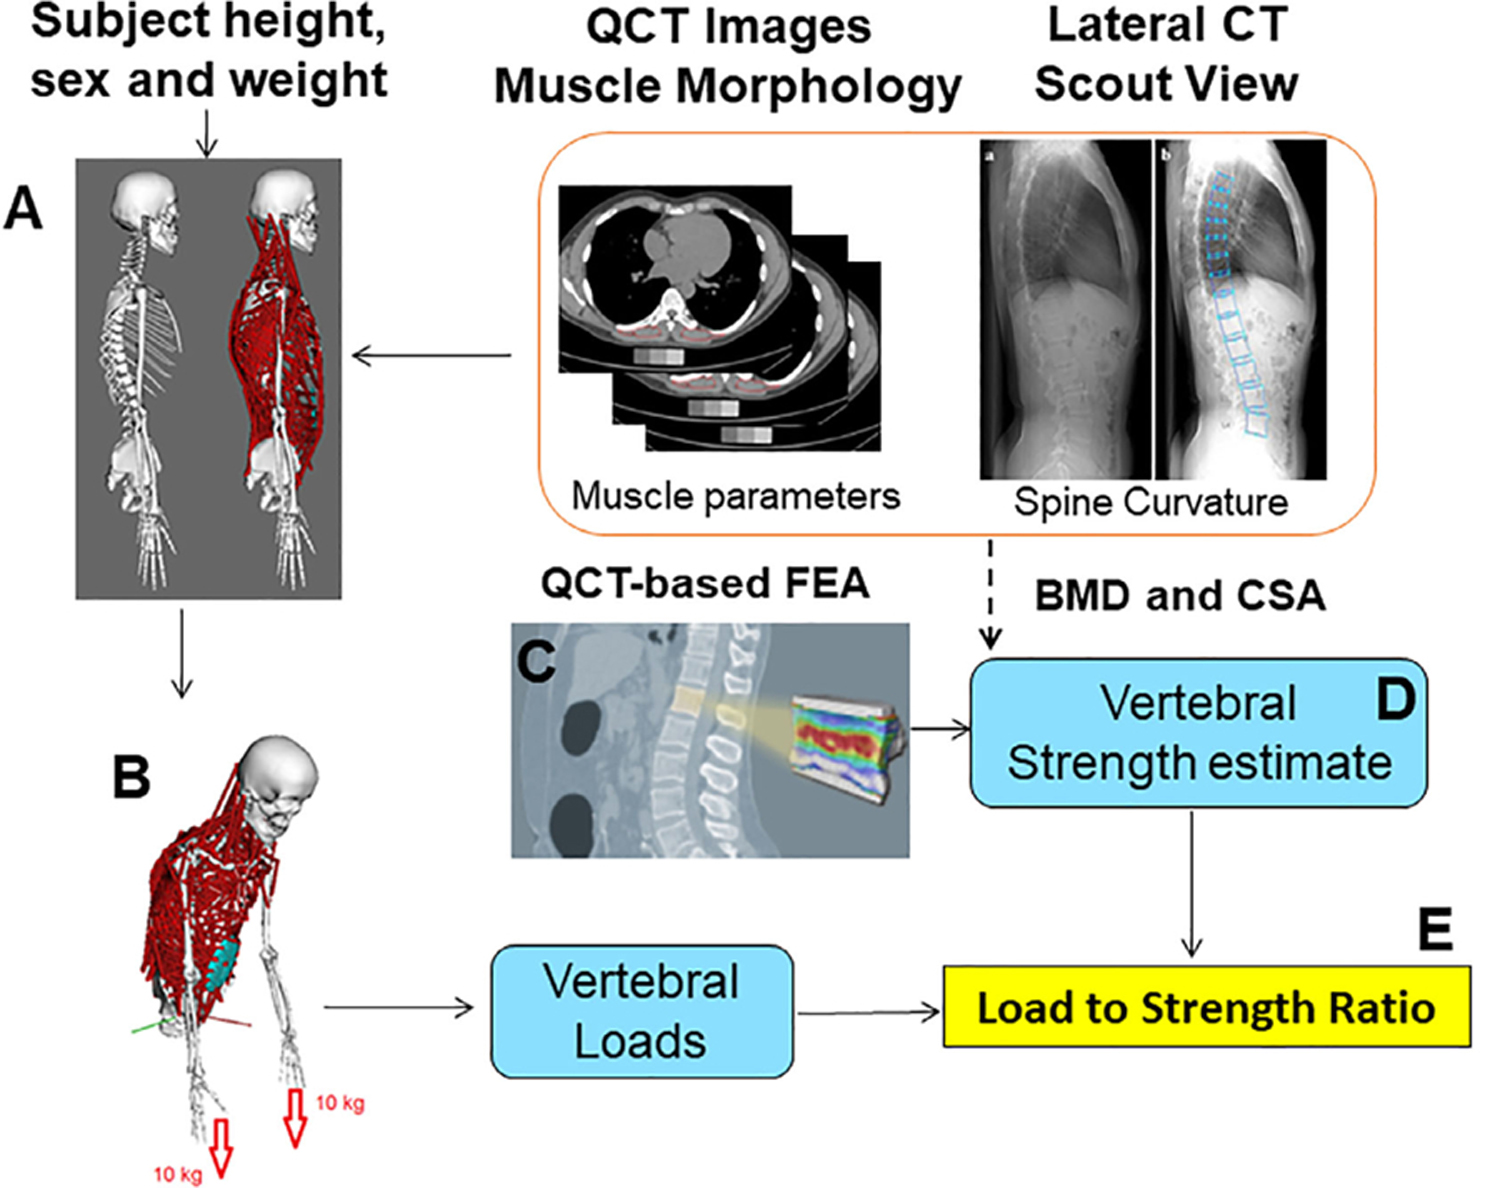
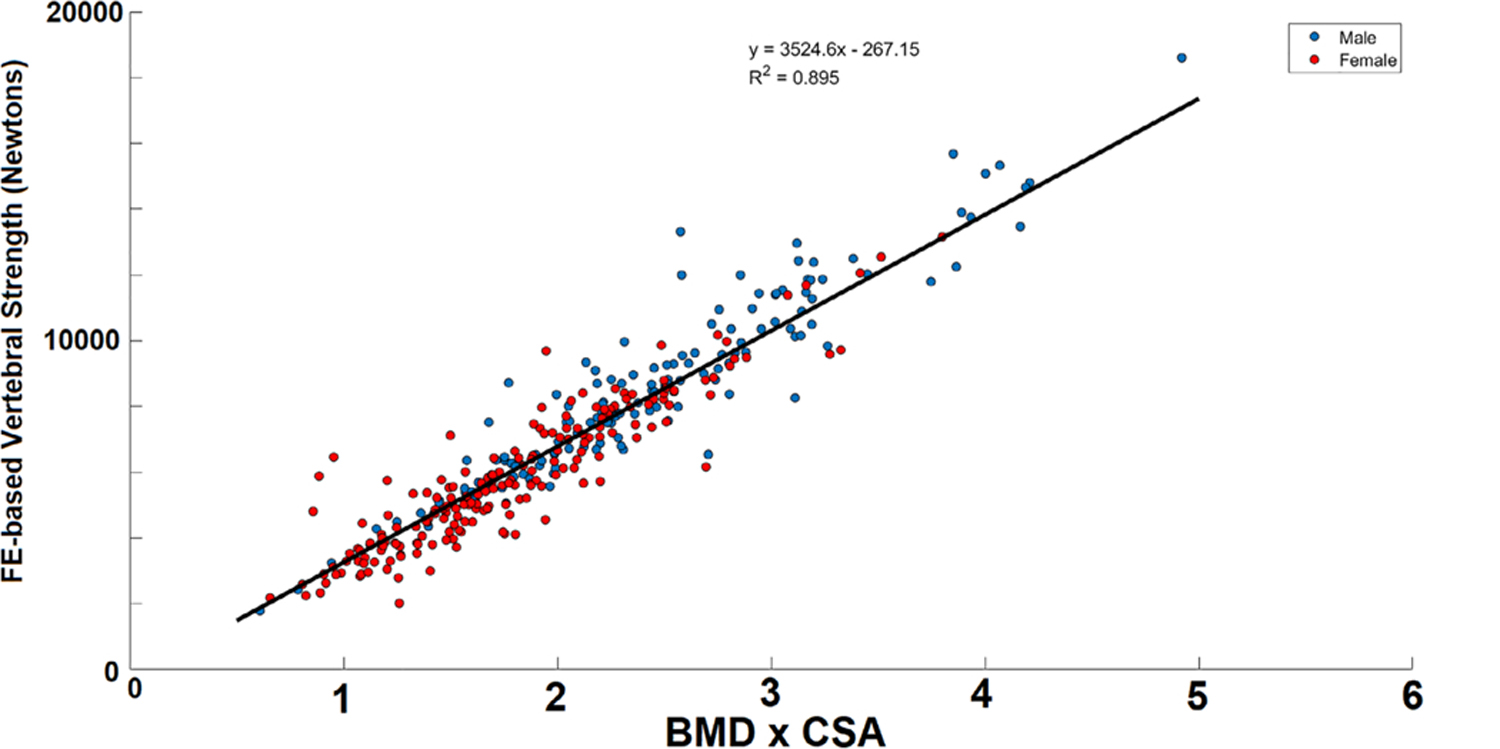
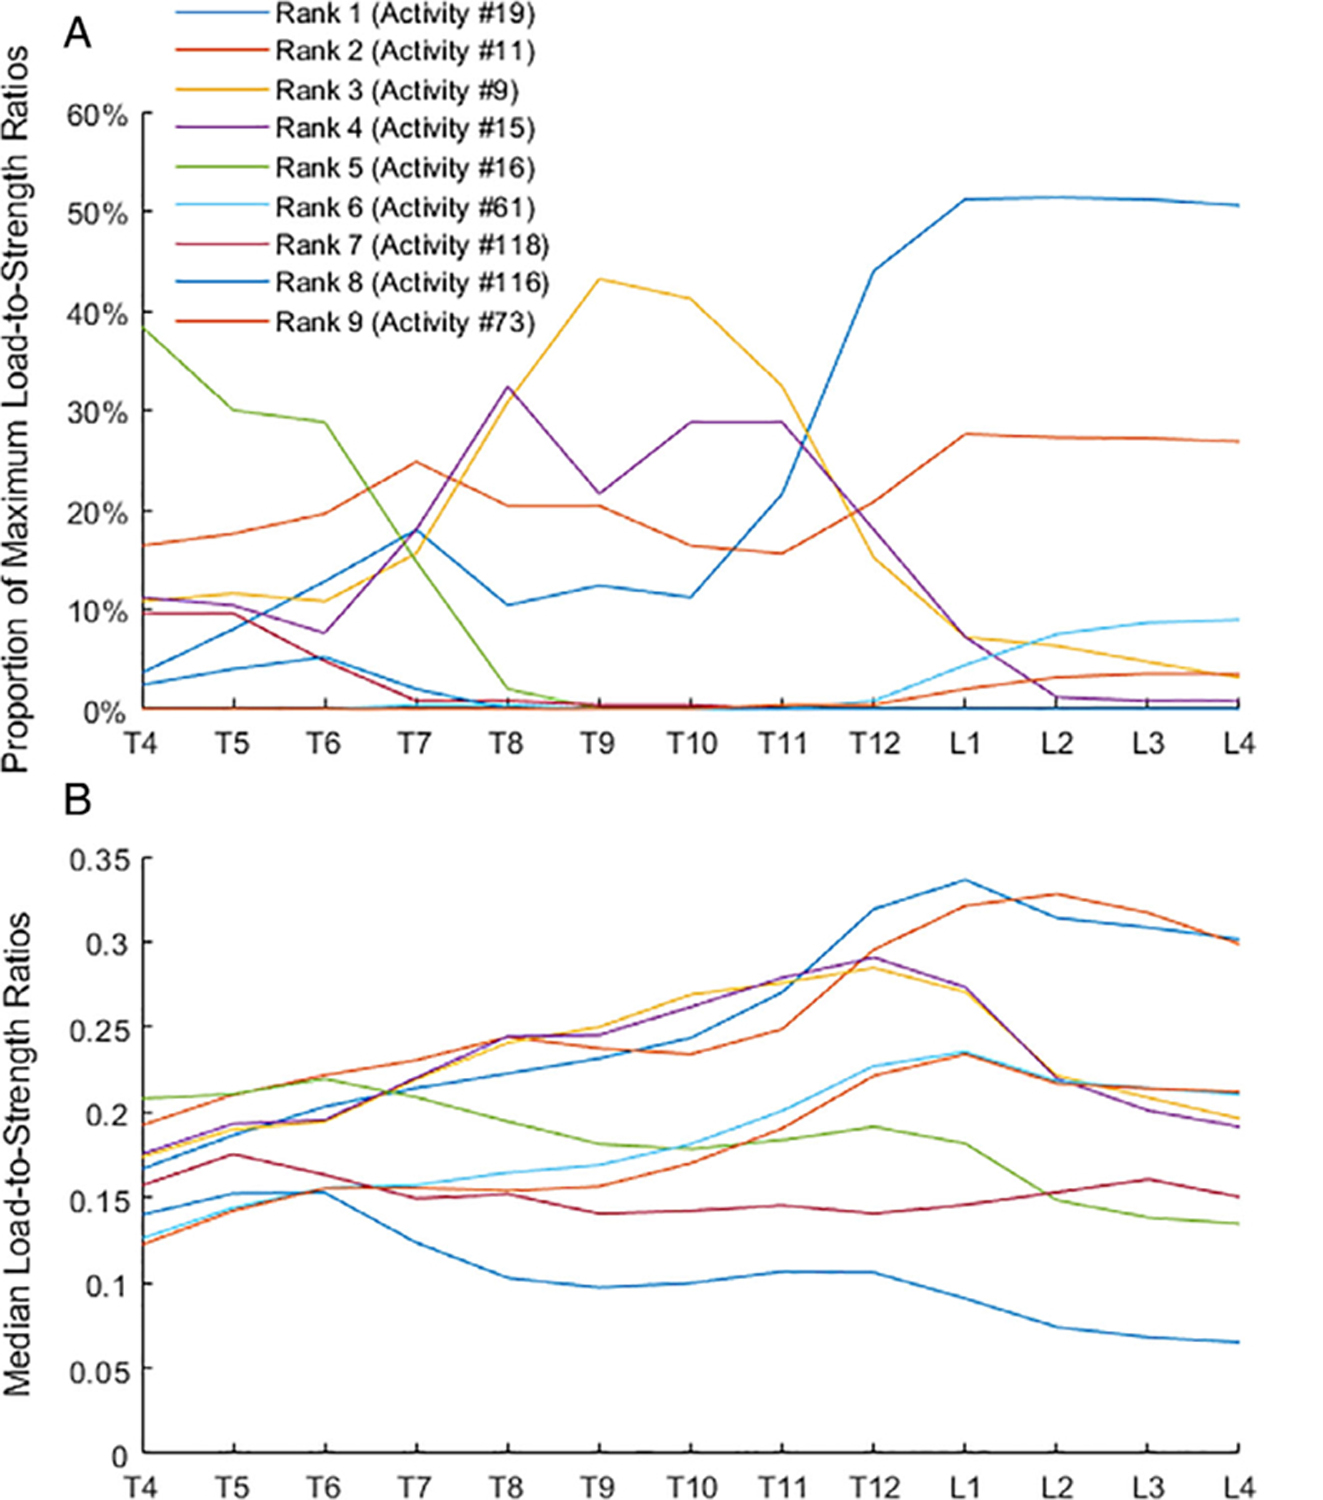
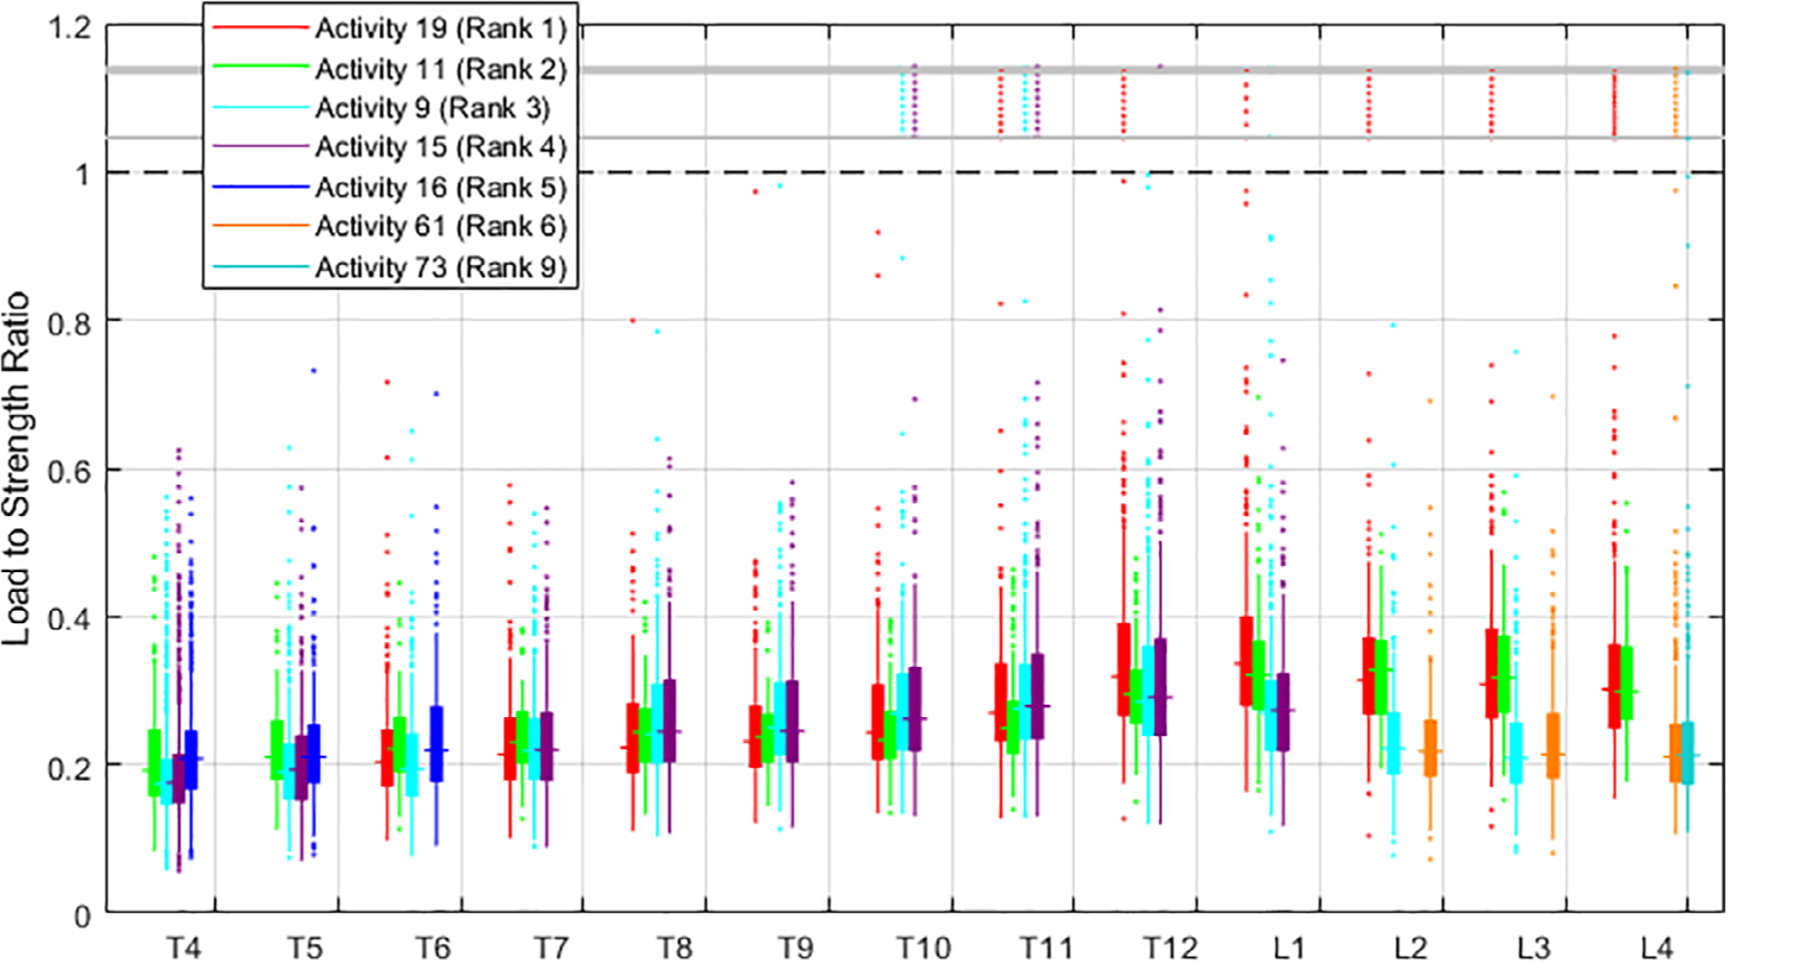
Vertebral fractures (VFx) are common among older adults. Epidemiological studies report high occurrence of VFx at mid-thoracic and thoracolumbar regions of the spine; however, reasons for this observation remain poorly understood. Prior reports of high ratios of spinal loading to vertebral strength in the thoracolumbar region suggest a possible biomechanical explanation. However, no studies have evaluated load-to-strength ratios (LSRs) throughout the spine for a large number of activities in a sizeable cohort. Thus, we performed a cross-sectional study in a sample of adult men and women from a population-based cohort to: 1) determine which activities cause the largest vertebral LSRs, and 2) examine patterns of LSRs along the spine for these high-load activities. We used subject-specific musculoskeletal models of the trunk to determine vertebral compressive loads for 109 activities in 250 individuals (aged 41 to 90 years, 50% women) from the Framingham Heart Study. Vertebral compressive strengths from T4 to L4 were calculated from computed tomography-based vertebral size and bone density measurements. We determined which activities caused maximum LSRs at each of these spinal levels. We identified nine activities that accounted for >95% of the maximum LSRs overall and at least 89.6% at each spinal level. The activity with the highest LSR varied by spinal level, and three distinct spinal regions could be identified by the activity producing maximum LSRs: lateral bending with a weight in one hand (upper thoracic), holding weights with elbows flexed (lower thoracic), and forward flexion with weight (lumbar). This study highlights the need to consider a range of lifting, holding, and non-symmetric activities when evaluating vertebral LSRs. Moreover, we identified key activities that produce higher loading in multiple regions of the spine. These results provide the first guidance on what activities to consider when evaluating vertebral load-to-strength ratios in future studies, including those examining dynamic motions and the biomechanics of VFx. © 2020 American Society for Bone and Mineral Research (ASBMR).
Keywords: BIOMECHANICS; BONE QCT; FRACTURE PREVENTION; FRACTURE RISK ASSESSMENT; OSTEOPOROSIS.
© 2020 American Society for Bone and Mineral Research (ASBMR).
Conflict of interest statement
Disclosures
All authors state that they have no conflicts of interest.
Figures
References
-
- Mokhtarzadeh H, Anderson DE. The role of trunk musculature in osteoporotic vertebral fractures: implications for prediction, prevention, and management. Curr Osteoporos Rep. 2016;14(3):67–76. - PubMed
Publication types
MeSH terms
Grants and funding
LinkOut - more resources
Full Text Sources
Medical
