

Patterns of repeated diagnostic testing for COVID-19 in relation to patient characteristics and outcomes
- PMID: 33253457
- PMCID: PMC7753604
- DOI: 10.1111/joim.13213
Patterns of repeated diagnostic testing for COVID-19 in relation to patient characteristics and outcomes
Abstract
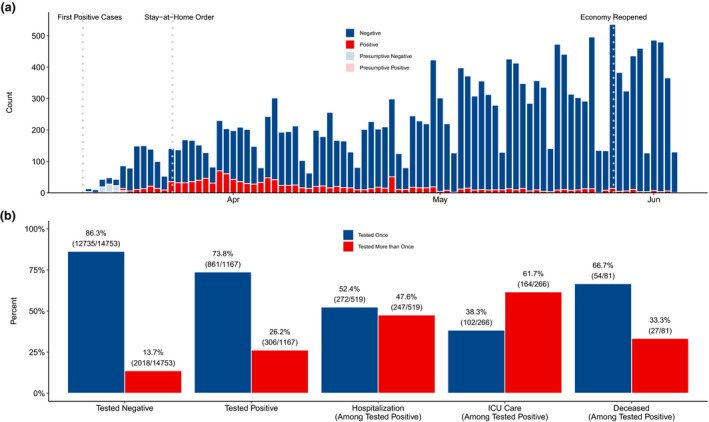
Background: Whilst the COVID-19 diagnostic test has a high false-negative rate, not everyone initially negative is re-tested. Michigan Medicine, a primary regional centre, provided an ideal setting for studying testing patterns during the first wave of the pandemic.
Objectives: To identify the characteristics of patients who underwent repeated testing for COVID-19 and determine if repeated testing was associated with downstream outcomes amongst positive cases.
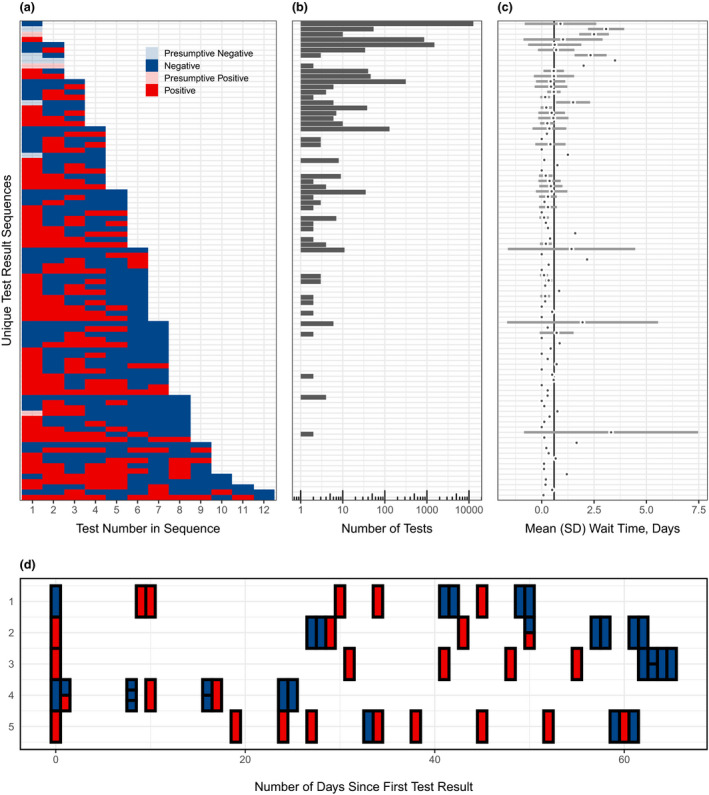
Methods: Characteristics, test results, and health outcomes for patients presenting for a COVID-19 diagnostic test were collected. We examined whether patient characteristics differed with repeated testing and estimated a false-negative rate for the test. We then studied repeated testing patterns in patients with severe COVID-19-related outcomes.
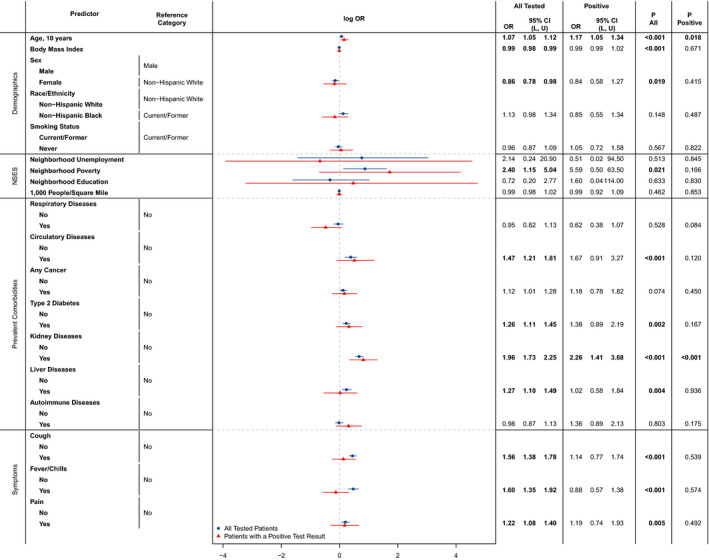
Results: Patient age, sex, body mass index, neighbourhood poverty levels, pre-existing type 2 diabetes, circulatory, kidney, and liver diseases, and cough, fever/chills, and pain symptoms 14 days prior to a first test were associated with repeated testing. Amongst patients with a positive result, age (OR: 1.17; 95% CI: (1.05, 1.34)) and pre-existing kidney diseases (OR: 2.26; 95% CI: (1.41, 3.68)) remained significant. Hospitalization (OR: 7.88; 95% CI: (5.15, 12.26)) and ICU-level care (OR: 6.93; 95% CI: (4.44, 10.92)) were associated with repeated testing. The estimated false-negative rate was 23.8% (95% CI: (19.5%, 28.5%)).
Conclusions: Whilst most patients were tested once and received a negative result, a meaningful subset underwent multiple rounds of testing. These results shed light on testing patterns and have important implications for understanding the variation of repeated testing results within and between patients.
Keywords: COVID-19; diagnostic testing; false-negative rate.
© 2020 The Association for the Publication of the Journal of Internal Medicine.
Conflict of interest statement
All authors have declared no competing interest. All authors have completed the ICMJE uniform disclosure form at
Figures
Update of
-
Understanding the patterns of repeated testing for COVID-19: Association with patient characteristics and outcomes.medRxiv [Preprint]. 2020 Jul 29:2020.07.26.20162453. doi: 10.1101/2020.07.26.20162453. medRxiv. 2020. Update in: J Intern Med. 2021 May;289(5):726-737. doi: 10.1111/joim.13213. PMID: 32793922 Free PMC article. Updated. Preprint.
Similar articles
-
Understanding the patterns of repeated testing for COVID-19: Association with patient characteristics and outcomes.medRxiv [Preprint]. 2020 Jul 29:2020.07.26.20162453. doi: 10.1101/2020.07.26.20162453. medRxiv. 2020. Update in: J Intern Med. 2021 May;289(5):726-737. doi: 10.1111/joim.13213. PMID: 32793922 Free PMC article. Updated. Preprint.
-
Characteristics Associated With Racial/Ethnic Disparities in COVID-19 Outcomes in an Academic Health Care System.JAMA Netw Open. 2020 Oct 1;3(10):e2025197. doi: 10.1001/jamanetworkopen.2020.25197. JAMA Netw Open. 2020. PMID: 33084902 Free PMC article.
-
Clinical Characteristics and Outcomes of 905 COVID-19 Patients Admitted to Imam Khomeini Hospital Complex in the Capital City of Tehran, Iran.Arch Iran Med. 2020 Nov 1;23(11):766-775. doi: 10.34172/aim.2020.102. Arch Iran Med. 2020. PMID: 33220695
-
Universal screening for SARS-CoV-2 infection: a rapid review.Cochrane Database Syst Rev. 2020 Sep 15;9(9):CD013718. doi: 10.1002/14651858.CD013718. Cochrane Database Syst Rev. 2020. PMID: 33502003 Free PMC article.
-
Clinical Characteristics and Morbidity Associated With Coronavirus Disease 2019 in a Series of Patients in Metropolitan Detroit.JAMA Netw Open. 2020 Jun 1;3(6):e2012270. doi: 10.1001/jamanetworkopen.2020.12270. JAMA Netw Open. 2020. PMID: 32543702 Free PMC article. Review.
Cited by
-
Spectrum of COVID-19 cases in Arkhangelsk, Northwest Russia: Findings from a population-based study linking serosurvey, registry data, and self-reports of symptoms.PLoS One. 2024 Oct 11;19(10):e0311287. doi: 10.1371/journal.pone.0311287. eCollection 2024. PLoS One. 2024. PMID: 39392813 Free PMC article.
-
Determinants of COVID-19 testing among late middle-aged and older adults: Applying the health belief model.Aging Health Res. 2022 Jun;2(2):100066. doi: 10.1016/j.ahr.2022.100066. Epub 2022 Mar 25. Aging Health Res. 2022. PMID: 35350777 Free PMC article.
-
Point of tangency between coronavirus disease and endothelial injury.Int J Emerg Med. 2021 Dec 20;14(1):76. doi: 10.1186/s12245-021-00403-3. Int J Emerg Med. 2021. PMID: 34930108 Free PMC article. No abstract available.
-
Understanding the Patterns of Serological Testing for COVID-19 Pre- and Post-Vaccination Rollout in Michigan.J Clin Med. 2021 Sep 24;10(19):4341. doi: 10.3390/jcm10194341. J Clin Med. 2021. PMID: 34640359 Free PMC article.
-
Use of machine learning to assess the prognostic utility of radiomic features for in-hospital COVID-19 mortality.Sci Rep. 2023 May 5;13(1):7318. doi: 10.1038/s41598-023-34559-0. Sci Rep. 2023. PMID: 37147440 Free PMC article.
References
-
- Office of the Governor of Michigan . Executive Order 2020–04 (COVID‐19) ‐ Declaration of State of Emergency. Published online March 10, 2020. https://www.michigan.gov/whitmer/0,9309,7‐387‐90499_90705‐521576–,00.html.
-
- Office of the Governor of Michigan . Executive Order 2020–21 (COVID‐19). Published online March 23, 2020. https://www.michigan.gov/whitmer/0,9309,7‐387‐90499_90705‐522626–,00.html.
-
- State of Michigan . Governor Whitmer Reopens Auto Dealerships and Retail Businesses by Appointment, Authorizes Nonessential Medical, Dental and Veterinary Procedures. Published online May 21, 2020. https://www.michigan.gov/coronavirus/0,9753,7‐406‐98158‐529861–,00.html.
