Comparative Study
. 2021 Apr:224:332-342.
doi: 10.1016/j.ajo.2020.11.005. Epub 2020 Nov 27.

Comparison of Methods for Measuring Cyclodeviation

Affiliations
Comparative Study

Comparison of Methods for Measuring Cyclodeviation

Laura Liebermann et al. Am J Ophthalmol. 2021 Apr.

Abstract

Purpose: To compare the double-Maddox rod test with other methods of measuring cyclodeviation DESIGN: Retrospective cohort study.

Methods: We retrospectively identified 153 adults in a clinical practice with cyclodeviation assessed using double-Maddox rods, of whom 105 were also assessed using fusible synoptophore targets, 73 using nonfusible synoptophore targets, 118 using single-Maddox rod, and 43 using fundus photography. Relationships between double-Maddox rod and other tests were evaluated by calculating mean differences with 95% confidence intervals (CI), intraclass correlation coefficients (ICC), and Bland-Altman plots with linear regression.

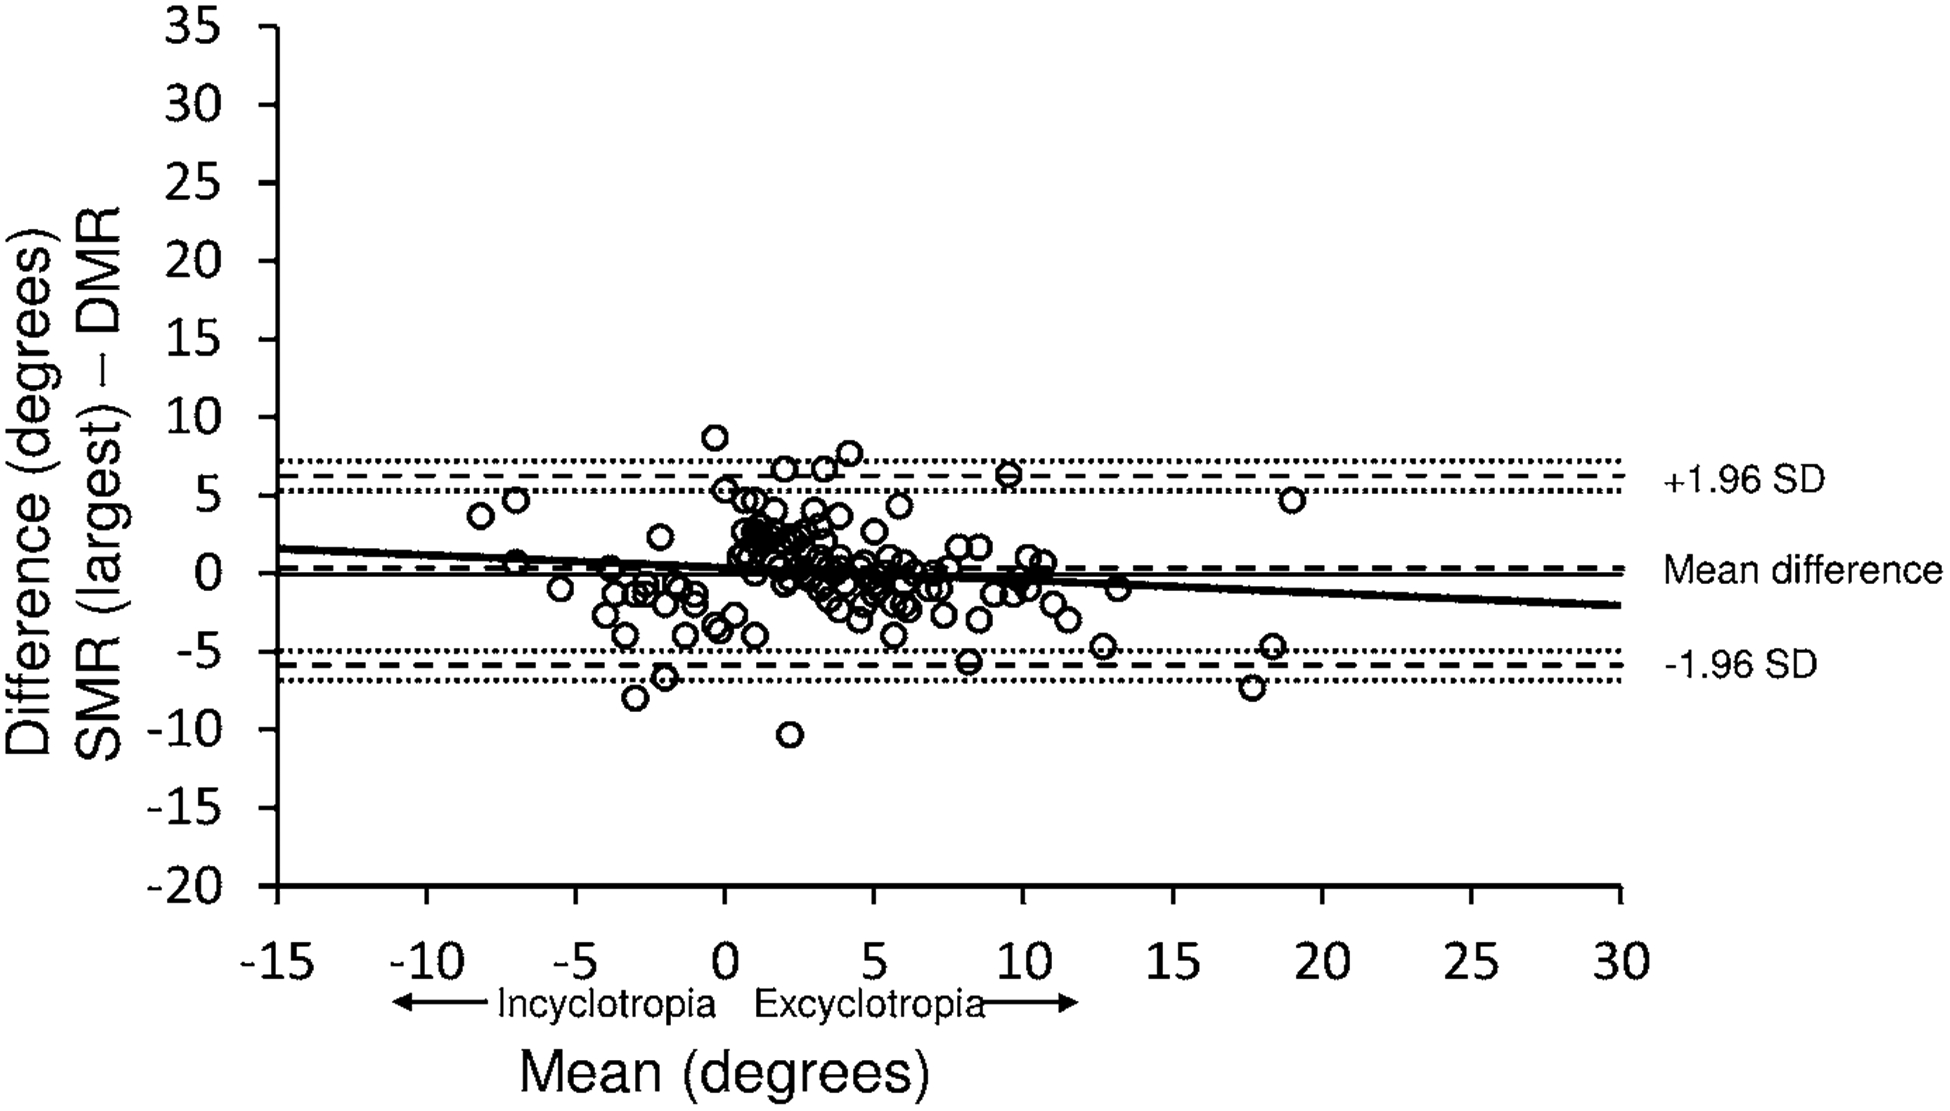
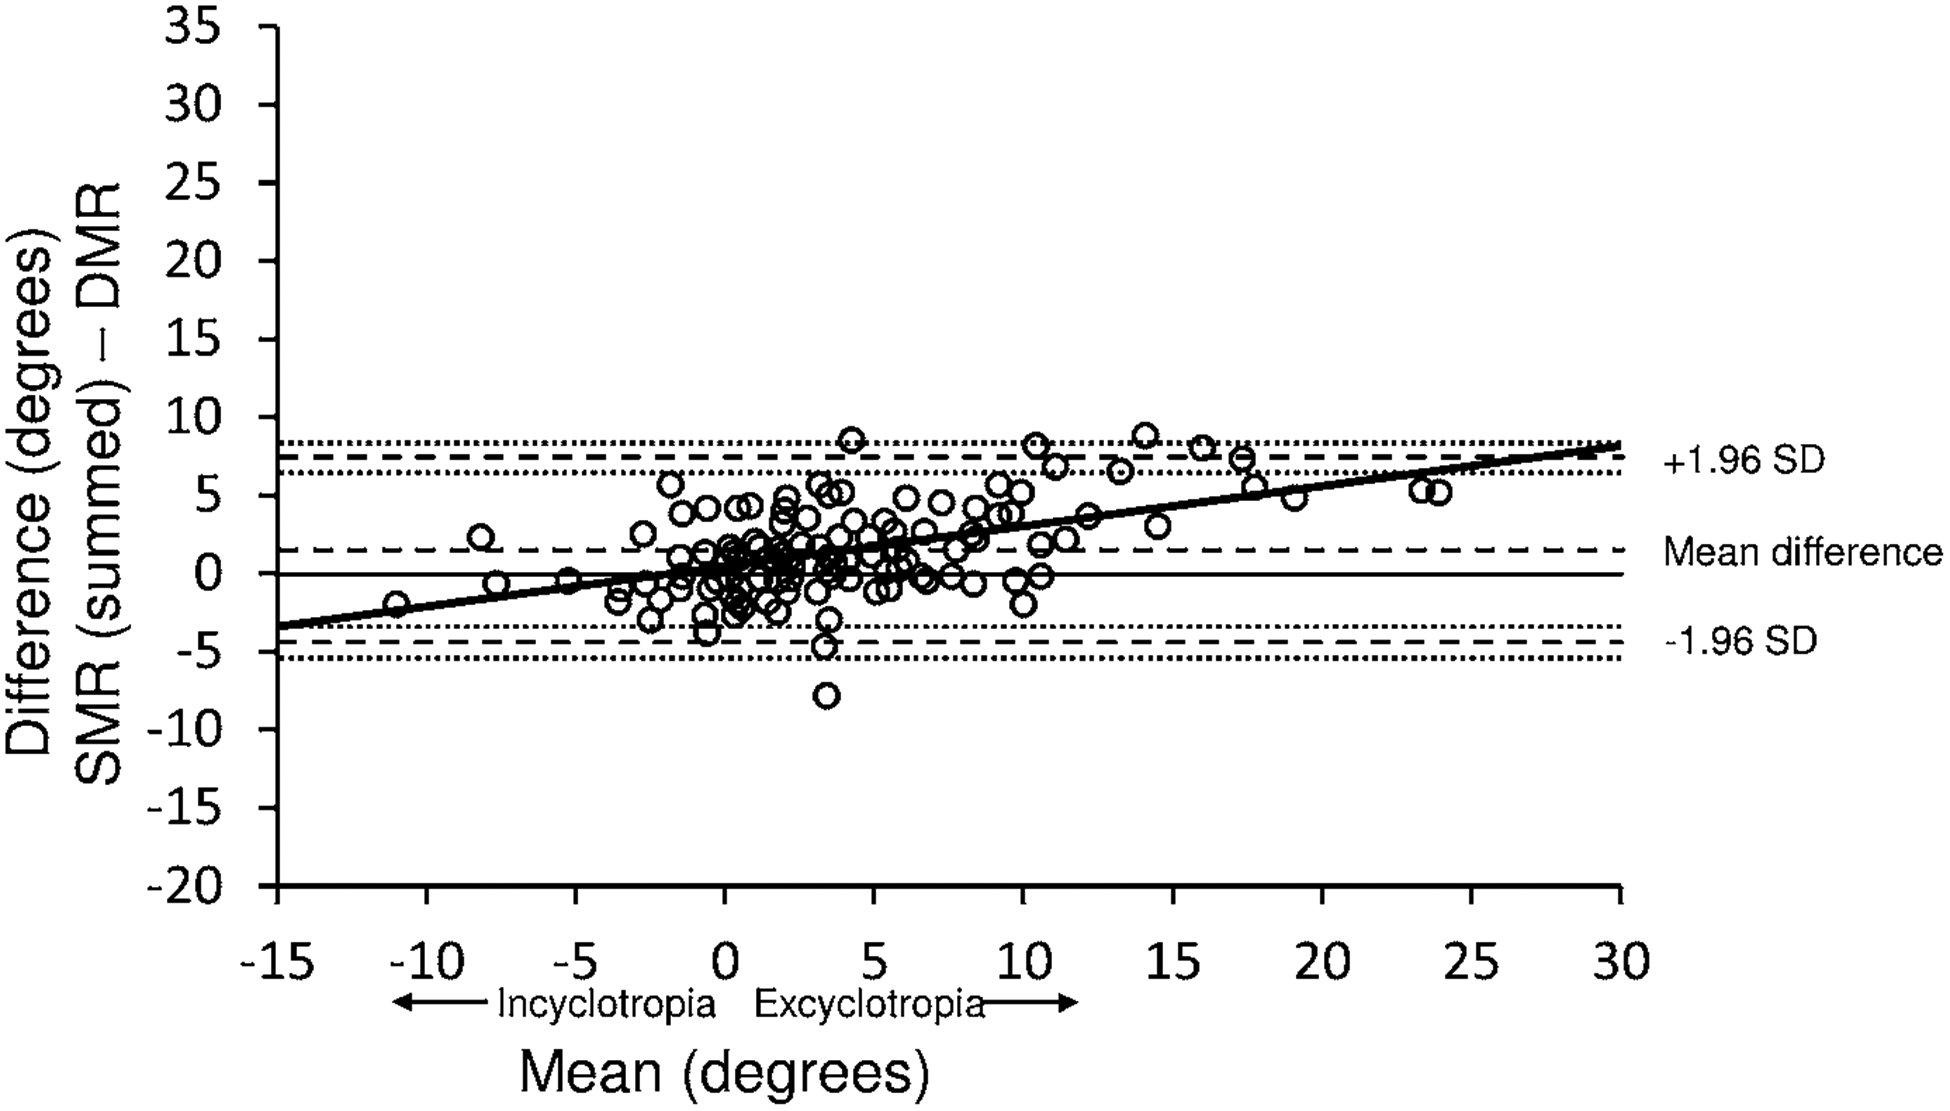
Results: Synoptophore cross-in-circle targets and the largest (of right or left) single-Maddox rod values were similar to double-Maddox values (mean differences: -1.2° and 0.1°, respectively; ICC: 0.79 and 0.82, respectively). Synoptophore house targets measured less excyclodeviation (mean difference: -2.7°; ICC: 0.71). Mean summed single-Maddox rod values were somewhat similar to double-Maddox values (mean difference: 1.5°; ICC: 0.85), but differences increased with greater cyclodeviation (r2 = 0.2678; P < .001). Fundus photographs showed large, uncorrelated differences compared with double-Maddox rod test, when summing right and left eyes and when using the largest of right or left (mean differences: 12.2° and 6.2°; ICC: -0.02 and 0.21, respectively), and differences increased with greater cyclodeviation (r2 = 0.4094; P < .001 and r2 = .1143; P= .03, respectively).

Conclusions: There was good agreement between double-Maddox and the largest single- Maddox test values and synoptophore cross-in-circle targets but poorer agreement with other tests. Further study is needed to understand which measurements best reflect true cyclodeviation and relationships with symptoms.


Figures

Figure 1.
Figure 1.
Bland-Altman plot showing the 95% limits of agreement for the differences between the double Maddox rod and the synoptophore cross in circle target. The mean of the differences was −1.2 degrees (middle dotted line) and the half-width of the 95% limits of agreement was 6.9 degrees. Linear regression showed no relationship between magnitude of differences and average of the two methods: r-square = 0.0032, P=0.63. Fine-dotted lines indicate 95% confidence intervals on limits of agreement.
Figure 2.
Figure 2.
Bland-Altman plot showing the 95% limits of agreement for the differences between the double Maddox rod and the synoptophore house target. The mean of the differences was −2.7 degrees (middle dotted line) and the half-width of the 95% limits of agreement was 7.0 degrees. Linear regression showed no relationship between magnitude of differences and average of the two methods: r-square = 0.0030, P=0.58. Fine-dotted lines indicate 95% confidence intervals on limits of agreement.
Figure 3.
Figure 3.
Bland-Altman plot showing the 95% limits of agreement for the differences between the double Maddox rod and single Maddox rod (largest of right- and left- eye values). The mean of the differences was 0.1 degrees (middle dotted line) and the half-width of the 95% limits of agreement was 6.1 degrees. Linear regression showed no relationship between magnitude of differences and average of the two methods: r-square = 0.0154, P=.18. Fine-dotted lines indicate 95% confidence intervals on limits of agreement.
Figure 4.
Figure 4.
Bland-Altman plot showing the 95% limits of agreement for the differences between the double Maddox rod and single Maddox rod (right- and left- eye values summed). The mean of the differences was 1.5 degrees (middle dotted line) and the half-width of the 95% limits of agreement was 5.7 degrees. Linear regression showed progressively greater differences with increasing cyclodeviation: r-square = 0.2596, P<.001. Fine-dotted lines indicate 95% confidence intervals on limits of agreement.
Figure 5.
Figure 5.
Bland-Altman plot showing the 95% limits of agreement for the differences between the double Maddox rod and fundus photographs (right- and left- eye values summed). The mean of the differences was 12.1 degrees (middle dotted line) and the half-width of the 95% limits of agreement was 16.4 degrees. Linear regression showed progressively greater differences with increasing cyclodeviation: r-square = 0.4094, P<.001. Fine-dotted lines indicate 95% confidence intervals on limits of agreement.
Figure 6.
Figure 6.
Bland-Altman plot showing the 95% limits of agreement for the differences between the double Maddox rod and fundus photographs (largest of right- and left- eye values). The mean of the differences was 6.1 degrees (middle dotted line) and the half-width of the 95% limits of agreement was 13.7 degrees. Linear regression showed progressively greater differences with increasing cyclodeviation: r-square = 0.1132, P=.03. Fine-dotted lines indicate 95% confidence intervals on limits of agreement.
Figure 7.
Figure 7.
Bland-Altman plot showing the 95% limits of agreement for the differences between the double Maddox rod and fundus photographs (right- and left- eye values summed) in 13 patients with strabismus onset within the past 5 years. The mean of the differences was 11.3 degrees (middle dotted line) and the half-width of the 95% limits of agreement was 12.2 degrees. Linear regression showed progressively greater differences with increasing cyclodeviation: r-square = 0.3893, P=.02. Fine-dotted lines indicate 95% confidence intervals on limits of agreement.
Figure 8.
Figure 8.
Bland-Altman plot showing the 95% limits of agreement for the differences between the double Maddox rod and fundus photographs (largest of right- and left- eye values) in 13 patients with strabismus onset within the past 5 years. The mean of the differences was 5.2 degrees (middle dotted line) and the half-width of the 95% limits of agreement was 9.9 degrees. Linear regression no change in differences with increasing cyclodeviation: r-square = 0.0060, P=.80. Fine-dotted lines indicate 95% confidence intervals on limits of agreement.

References

    1. Kushner BJ, Hariharan L. Observations about objective and subjective ocular torsion. Ophthalmology 2009;116(10):2001–2010. - PubMed
    1. Guyton DL. Clinical assessment of ocular torsion. Am Orthopt J 1983;33:7–15.
    1. Flodin S, Karlsson P, Andersson Gronlund M. Cyclotorsion Measured in a Patient Population Using Three Different Methods: A Comparative Study. Strabismus 2016;24(1):28–36. - PubMed
    1. Flodin S, Pansell T, Rydberg A, Andersson Gronlund M. Clinical measurements of normative subjective cyclotorsion and cyclofusion in a healthy adult population. Acta Ophthalmol Suppl 2020;98(2):177–181. - PubMed
    1. Paris V. Microdeviations and macrosymptoms: what to do? In: Liaňo RGd, editor. 33rd Meeting of the European Strabismological Association. Belgrade, Serbia, 2009:133–135.

Publication types

LinkOut - more resources