. 2020 Nov 24;9(12):1630.
doi: 10.3390/plants9121630.

Exogenous ACC Deaminase Is Key to Improving the Performance of Pasture Legume-Rhizobial Symbioses in the Presence of a High Manganese Concentration

Affiliations

Exogenous ACC Deaminase Is Key to Improving the Performance of Pasture Legume-Rhizobial Symbioses in the Presence of a High Manganese Concentration

Ana Paço et al. Plants (Basel). .

Abstract

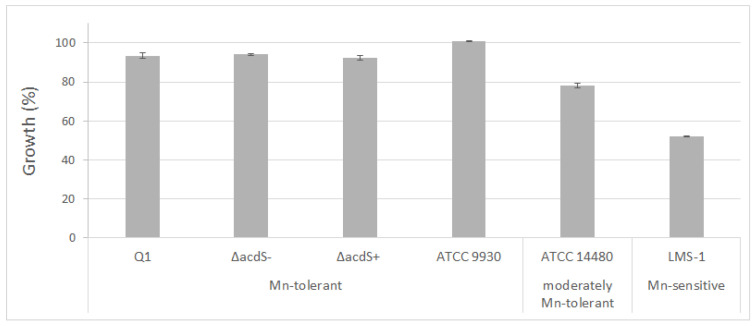
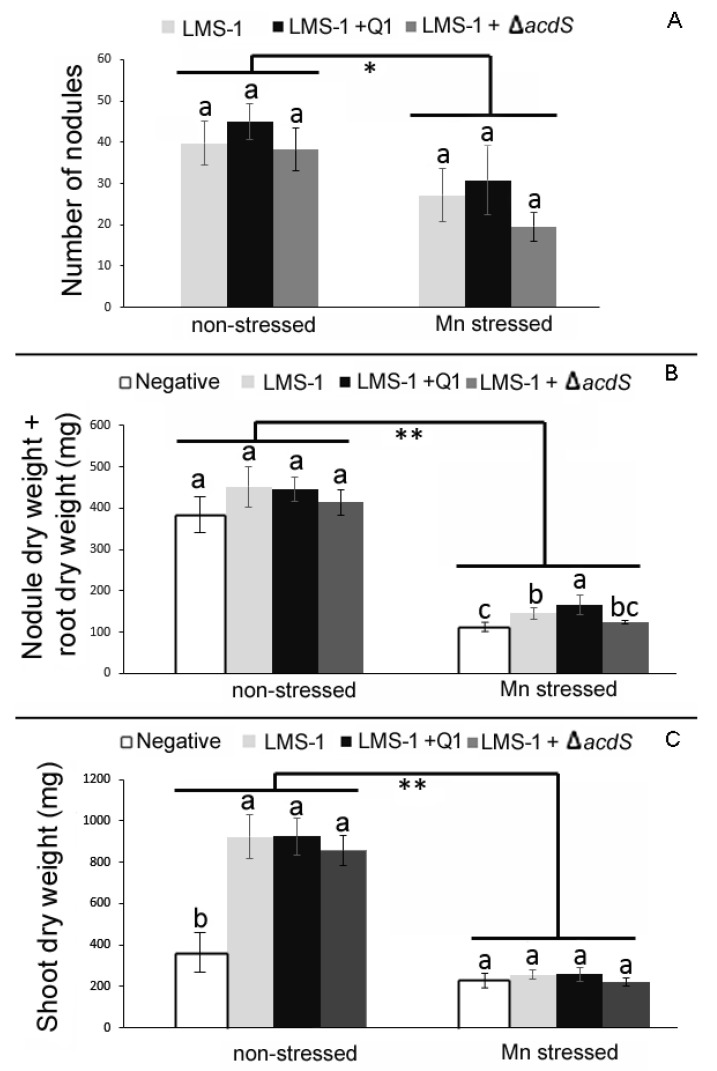
Manganese (Mn) toxicity is a very common soil stress around the world, which is responsible for low soil fertility. This manuscript evaluates the effect of the endophytic bacterium Pseudomonas sp. Q1 on different rhizobial-legume symbioses in the absence and presence of Mn toxicity. Three legume species, Cicer arietinum (chickpea), Trifolium subterraneum (subterranean clover), and Medicago polymorpha (burr medic) were used. To evaluate the role of 1-aminocyclopropane-1-carboxylate (ACC) deaminase produced by strain Q1 in these interactions, an ACC deaminase knockout mutant of this strain was constructed and used in those trials. The Q1 strain only promoted the symbiotic performance of Rhizobium leguminosarum bv. trifolii ATCC 14480T and Ensifer meliloti ATCC 9930T, leading to an increase of the growth of their hosts in both conditions. Notably, the acdS gene disruption of strain Q1 abolished the beneficial effect of this bacterium as well as causing this mutant strain to act deleteriously in those specific symbioses. This study suggests that the addition of non-rhizobia with functional ACC deaminase may be a strategy to improve the pasture legume-rhizobial symbioses, particularly when the use of rhizobial strains alone does not yield the expected results due to their difficulty in competing with native strains or in adapting to inhibitory soil conditions.

Keywords: abiotic stress; acidity; endophytes; nodulation; plant growth promotion; plant growth-promoting traits; plant–bacteria interactions.


Conflict of interest statement

The authors declare no conflict of interest. The funders had no role in the design of the study; in the collection, analyses, or interpretation of data; in the writing of the manuscript, or in the decision to publish the results.

Figures

Figure 1
Figure 1
Alignment of AcdS protein amino-acid sequences from bacteria belonging to genus Pseudomonas. The conserved residues between all sequences are indicated by dots. The pyridoxal 5′-phosphate binding sites are indicated in light gray, and the catalytic residue is indicated in dark gray. The underlined amino acids correspond to the deletion fragment in Pseudomonas sp. Q1. Pseudomonas palleroniana accession WP_090372028, Pseudomonas fuscovaginae accession WP_019361456, Pseudomonas kilonensis WP_053178893, Pseudomonas thivervalensis accession WP_053183836, Pseudomonas sp. US4 accession WP_015096487.1 and Pseudomonas migulae accession WP_084321532.
Figure 2
Figure 2
Growth of Pseudomonas sp. Q1 and its derivatives strains (∆acdS mutant and ∆acdS+) and rhizobial strains (M. ciceri LMS-1, R. leguminosarum ATCC 14480T, E. meliloti ATCC 9930T) under Mn conditions (2 mM MnSO4). Percentages were calculated considering the control condition (without addition of MnSO4) as 100% growth. Bars indicate standard deviation.
Figure 3
Figure 3
Effects of single inoculation (M. ciceri LMS-1 (LMS-1)) and co-inoculation (M. ciceri LMS-1 and Pseudomonas sp. Q1 (LMS-1 + Q1) or M. ciceri LMS-1 and Pseudomonas sp. Q1 ∆acdS mutant (LMS-1 + ΔacdS)) on chickpea plants grown in a vermiculite pot assay for 54 days. (A) Number of nodules of plants. (B) Nodule plus root dry weight of plants. (C) Shoot dry weight of plants. Each point represents the mean and standard error values of five plants per treatment. Different letters (a–c) correspond to statistically significant differences (p < 0.05) within each group (non-stressed and Mn stressed). * denotes statistically significant differences between the treatments means in the presence and absence of high Mn concentration (* p < 0.01; ** p < 0.001).
Figure 4
Figure 4
Nodulation kinetics by a hydroponic assay of chickpea plants single inoculated (M. ciceri LMS-1 (LMS-1)) and co-inoculated (M. ciceri LMS-1 and Pseudomonas sp. Q1 (LMS-1 + Q1) or M. ciceri LMS-1 and Pseudomonas sp. Q1 ∆acdS mutant (LMS-1 + ΔacdS)). (A) Nodulation kinetics of chickpea plants during 26 days at non-stressed conditions. Each point represents the mean and standard error values of eight plants per treatment. The asterisks correspond to significant differences between the LMS-1 + Q1 ∆acdS treatment and the other two treatments. (B) Shoot dry weight at the end of the hydroponic assay (C) Nodule dry weight at the end of the hydroponic assay. Different letters (a–c) correspond to statistically significant differences (p < 0.05) within each group (non-stressed and Mn stressed). * denotes statistically significant differences between the treatments means in the presence and absence of high Mn concentration (** p < 0.001).
Figure 5
Figure 5
Effects of single inoculation (R. leguminosarum bv trifolii ATCC14480T (RL)), and co-inoculation (R. leguminosarum bv trifolii ATCC14480T and Pseudomonas sp. Q1 (RL + Q1) or R. leguminosarum bv trifolii ATCC14480T and Pseudomonas sp. Q1 ΔacdS (RL + ΔacdS Q1)) on subterranean clover plants grown in a vermiculite pot assay for 42 days. (A) Number of nodules of plants. (B) Nodule plus root dry weight of plants. (C) Shoot dry weight of plants. Each point represents the mean and standard error values of five plants per treatment. Different letters (a–c) correspond to statistically significant differences (p < 0.05) within each group (non-stressed and Mn stressed). * denotes statistically significant differences between the treatments means in the presence and absence of high Mn concentration (* p < 0.01).
Figure 6
Figure 6
Effects of single inoculation (E. meliloti ATCC9930T (EM)) and co-inoculation (E. meliloti ATCC9930T and Pseudomonas sp. Q1 (EM + Q1) or E. meliloti ATCC9930T and Pseudomonas sp. Q1 ΔacdS (EM + ΔacdS Q1) on burr medic plants grown in a vermiculite pot assay for 42 days. (A) Number of nodules of plants. (B) Nodule plus root dry weight of plants. (C) Shoot dry weight of plants. Each point represents the mean and standard error values of five plants per treatment. Different letters (a–c) correspond to statistically significant differences (p < 0.05) within each group (non-stressed and Mn stressed). * denotes statistically significant differences between the treatments means in the presence and absence of high Mn concentration (* p < 0.01; ** p < 0.001).
Figure 7
Figure 7
Nodulation kinetics by a hydroponic assay of subterranean clover plants inoculated with R. leguminosarum bv trifolii ATCC14480T (RL), and co-inoculated with R. leguminosarum bv trifolii ATCC14480T and Pseudomonas sp. Q1 (RL + Q1) or R. leguminosarum bv trifolii ATCC14480T and Pseudomonas sp. Q1 ΔacdS (RL + Q1 ΔacdS). (A) Nodulation kinetics of subterranean clover during 18 days under non-stressed conditions. (B) Nodulation kinetics of plants during 18 days under Mn conditions. Each point represents the mean and standard error values of ten plants per treatment. The asterisks correspond to significant differences between the RL + ∆acdS mutant treatment and the other two treatments. (C) Shoot dry weight of subterranean clover at the end of the hydroponics experiments. Different letters (a–b) correspond to statistically significant differences (p < 0.05) within each group (non-stressed and Mn stressed). * denotes statistically significant differences between the treatments means in the presence and absence of high Mn concentration (p < 0.01).

Similar articles

Cited by

References

    1. Sade H., Meriga B., Surapu V., Gadi J., Sunita M.S., Suravajhala P., Kavi Kishor P.B. Toxicity and tolerance of aluminum in plants: Tailoring plants to suit to acid soils. Biometals. 2016;29:187–210. doi: 10.1007/s10534-016-9910-z. - DOI - PubMed
    1. Kochian L.V., Piñeros M.A., Hoekenga O.A. The physiology, genetics and molecular biology of plant aluminum resistance and toxicity. Plant Soil. 2005;274:175–195. doi: 10.1007/s11104-004-1158-7. - DOI
    1. Gupta N., Gaurav S., Kumar A. Molecular basis of aluminium toxicity in plants: A review. Am. J. Plant Sci. 2013;4:21–37. doi: 10.4236/ajps.2013.412A3004. - DOI
    1. Bose J., Babourina O., Ma Y., Zhou M., Shabala S., Rengel Z. Specificity of ion uptake and homeostasis maintenance during acid and aluminium stresses. In: Panda S., Baluška F., editors. Aluminum Stress Adaptation in Plants. Signaling and Communication in Plants. Volume 24. Springer; Cham, Switzerland: 2015. pp. 229–251.
    1. von Uexküll H.R., Mutert E. Global extent, development and economic impact of acid soils. Plant Soil. 1995;171:1–15. doi: 10.1007/BF00009558. - DOI

LinkOut - more resources