The Evolution of Covid-19 in Italy after the Spring of 2020: An Unpredicted Summer Respite Followed by a Second Wave
- PMID: 33255181
- PMCID: PMC7727657
- DOI: 10.3390/ijerph17238708
The Evolution of Covid-19 in Italy after the Spring of 2020: An Unpredicted Summer Respite Followed by a Second Wave
Abstract
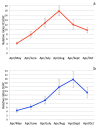
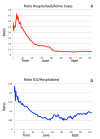
The coronavirus (COVID-19) pandemic was particularly invasive in Italy during the period between March and late April 2020, then decreased in both the number of infections and in the seriousness of the illness throughout the summer of 2020. In this work, we measure the severity of the disease by the ratio of Intensive Care Units (ICU) spaces occupied by COVID-19 patients and the number of Active Cases (AC) each month from April to October 2020. We also use the ratio of the number of Deaths (D) to the number of Active Cases. What clearly emerges, from rigorous statistical analysis, is a progressive decrease in both ratios until August, indicating progressive mitigation of the disease. This is particularly evident when comparing March-April with July-August; during the summer period the two ratios became roughly 18 times lower. We test such sharp decreases against possible bias in counting active cases and we confirm their statistical significance. We then interpret such evidence in terms of the well-known seasonality of the human immune system and the virus-inactivating effect of stronger UV rays in the summer. Both ratios, however, increased again in October, as ICU/AC began to increase in September 2020. These ratios and the exponential growth of infections in October indicate that the virus-if not contained by strict measures-will lead to unsustainable challenges for the Italian health system in the winter of 2020-2021.
Keywords: Covid-19 in Italy; autumn sharp worsening of epidemics; summer mitigation.
Conflict of interest statement
The authors declare no conflict of interest.
Figures


References
-
- Oke J., Heneghan C. Global COVID-19 Case Fatality Rates. Nuffield Department of Primary Care Health Sciences; Oxford, UK: 2020. [(accessed on 23 October 2020)]. Available online: https://www.cebm.net/global-COVID-19-case-fatality-rates/
-
- ISTAT Report, Primi Risultati Sull’indagine di Sieroprevalenza sul Sars-Cov-2. [(accessed on 28 October 2020)];2020 Available online: https://www.istat.it/it/files/2020/08/ReportPrimiRisultatiIndagineSiero.pdf. (In Italian)
-
- Reuters New coronavirus Losing Potency, Top Italian Doctor Says. [(accessed on 23 October 2020)];Thomson Reuters, World News. 2020 May 31; Available online: https://www.reuters.com/article/us-health-coronavirus-italy-virus/new-co....
-
- Vespignani A. Il Sole 24 Ore Infodata. [(accessed on 1 June 2020)];2020 Available online: https://www.infodata.ilsole24ore.com/2020/05/24/covid-19-modeling-italy-...
MeSH terms
LinkOut - more resources
Full Text Sources
Medical
Miscellaneous

