

A Representative GIIA Phospholipase A2 Activates Preadipocytes to Produce Inflammatory Mediators Implicated in Obesity Development
- PMID: 33255269
- PMCID: PMC7760919
- DOI: 10.3390/biom10121593
A Representative GIIA Phospholipase A2 Activates Preadipocytes to Produce Inflammatory Mediators Implicated in Obesity Development
Abstract
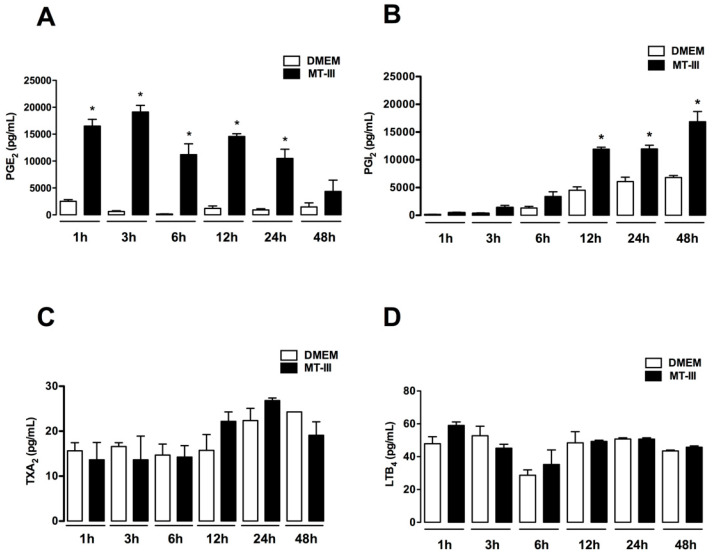
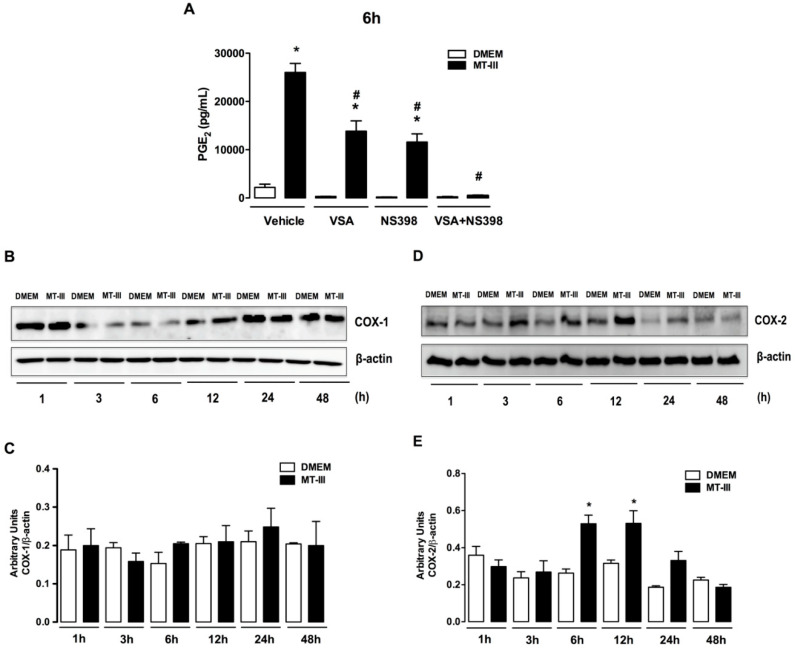
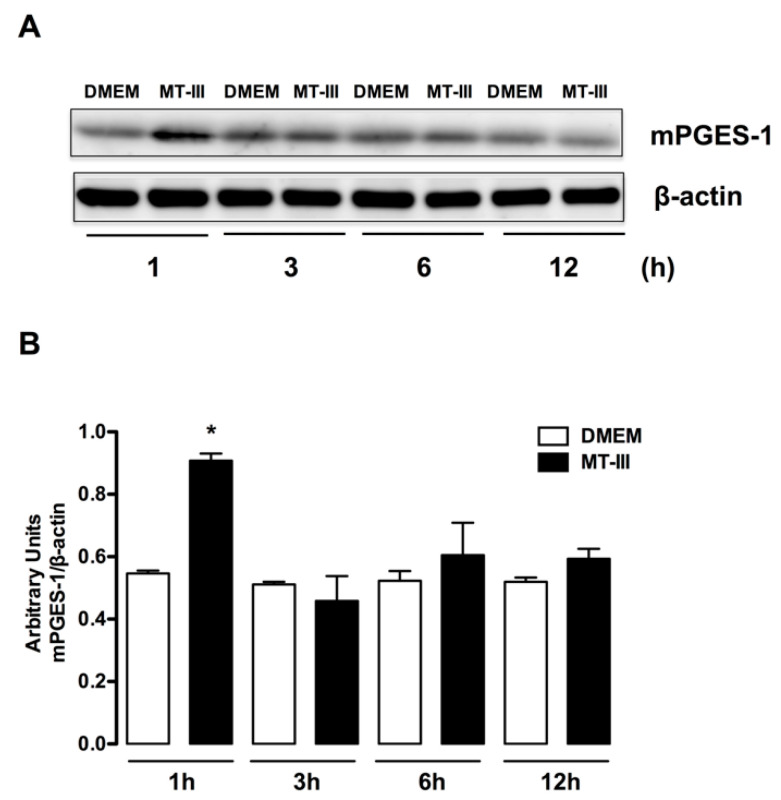
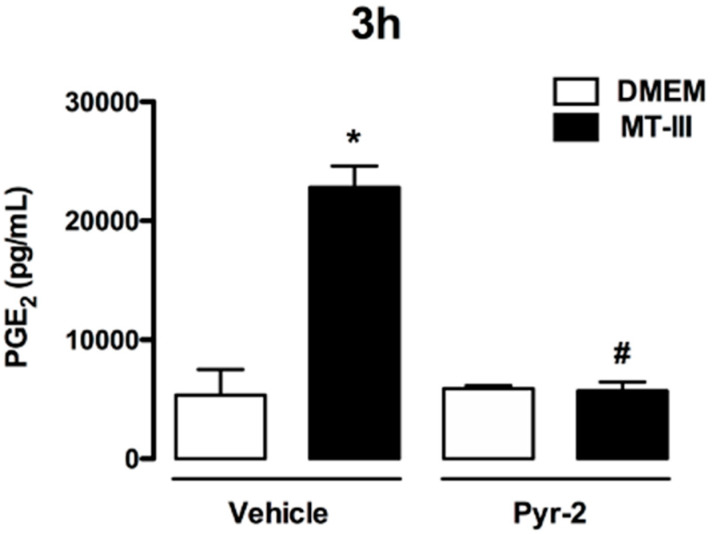
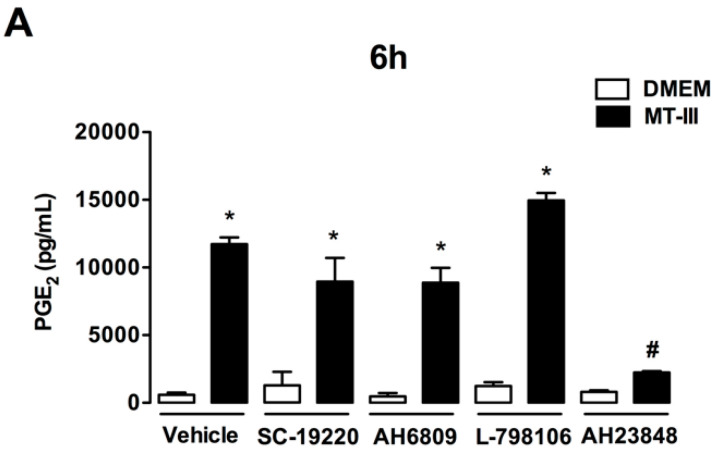
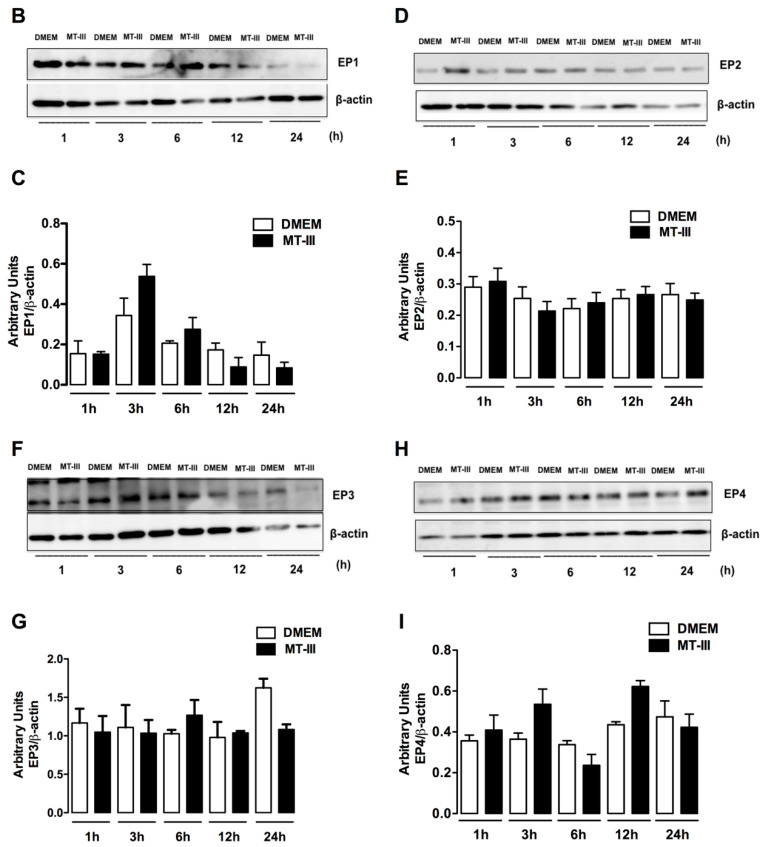
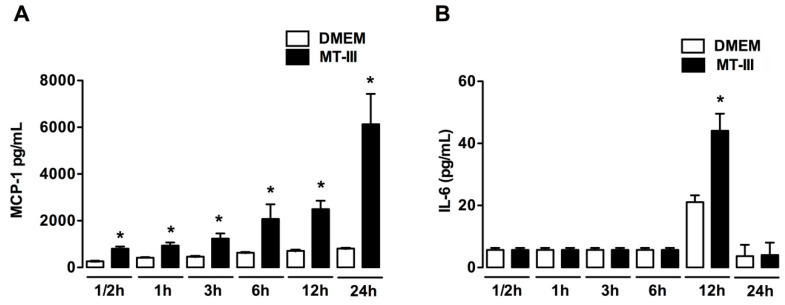
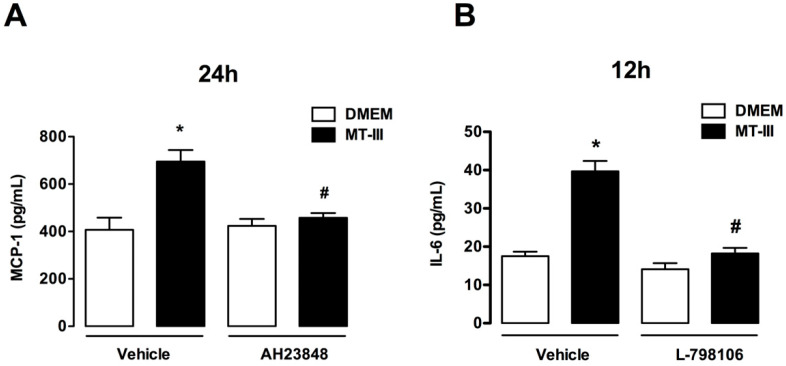
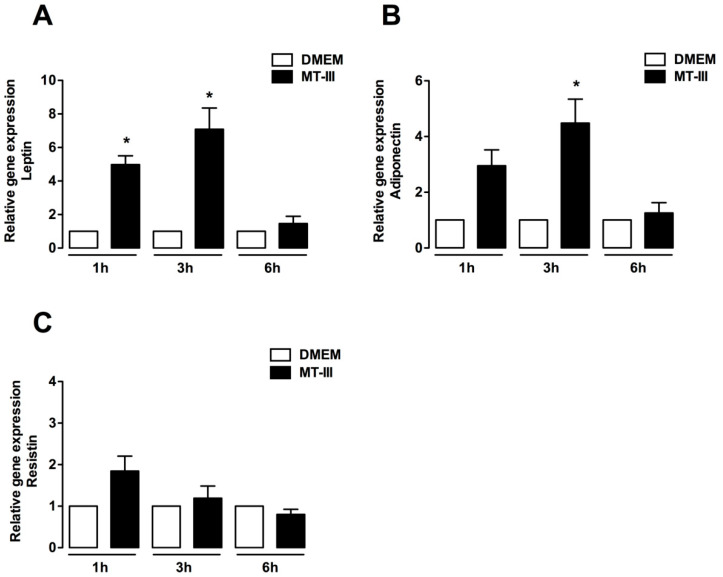
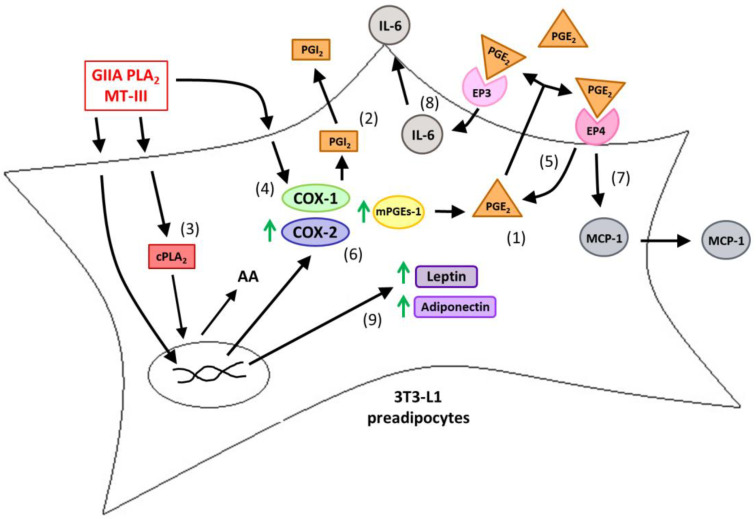
Adipose tissue secretes proinflammatory mediators which promote systemic and adipose tissue inflammation seen in obesity. Group IIA (GIIA)-secreted phospholipase A2 (sPLA2) enzymes are found to be elevated in plasma and adipose tissue from obese patients and are active during inflammation, generating proinflammatory mediators, including prostaglandin E2 (PGE2). PGE2 exerts anti-lipolytic actions and increases triacylglycerol levels in adipose tissue. However, the inflammatory actions of GIIA sPLA2s in adipose tissue cells and mechanisms leading to increased PGE2 levels in these cells are unclear. This study investigates the ability of a representative GIIA sPLA2, MT-III, to activate proinflammatory responses in preadipocytes, focusing on the biosynthesis of prostaglandins, adipocytokines and mechanisms involved in these effects. Our results showed that MT-III induced biosynthesis of PGE2, PGI2, MCP-1, IL-6 and gene expression of leptin and adiponectin in preadipocytes. The MT-III-induced PGE2 biosynthesis was dependent on cytosolic PLA2 (cPLA2)-α, cyclooxygenases (COX)-1 and COX-2 pathways and regulated by a positive loop via the EP4 receptor. Moreover, MT-III upregulated COX-2 and microsomal prostaglandin synthase (mPGES)-1 protein expression. MCP-1 biosynthesis induced by MT-III was dependent on the EP4 receptor, while IL-6 biosynthesis was dependent on EP3 receptor engagement by PGE2. These data highlight preadipocytes as targets for GIIA sPLA2s and provide insight into the roles played by this group of sPLA2s in obesity.
Keywords: EP receptors; adipokines; cytokines; phospholipase A2; preadipocytes; prostaglandins.
Conflict of interest statement
The authors declare no conflict of interest. The funders had no role in the design of the study; in the collection, analyses, or interpretation of data; in the writing of the manuscript, or in the decision to publish the results.
Figures
Similar articles
-
Bothrops moojeni snake venom induces an inflammatory response in preadipocytes: Insights into a new aspect of envenomation.PLoS Negl Trop Dis. 2022 Aug 8;16(8):e0010658. doi: 10.1371/journal.pntd.0010658. eCollection 2022 Aug. PLoS Negl Trop Dis. 2022. PMID: 35939519 Free PMC article.
-
A Metalloproteinase Induces an Inflammatory Response in Preadipocytes with the Activation of COX Signalling Pathways and Participation of Endogenous Phospholipases A2.Biomolecules. 2021 Jun 22;11(7):921. doi: 10.3390/biom11070921. Biomolecules. 2021. PMID: 34206390 Free PMC article.
-
Cytosolic phospholipase A2 is required for cytokine-induced expression of type IIA secretory phospholipase A2 that mediates optimal cyclooxygenase-2-dependent delayed prostaglandin E2 generation in rat 3Y1 fibroblasts.J Biol Chem. 1998 Jan 16;273(3):1733-40. doi: 10.1074/jbc.273.3.1733. J Biol Chem. 1998. PMID: 9430720
-
Prostaglandin E2 as a mediator of fever: synthesis and catabolism.Front Biosci. 2004 May 1;9:1977-93. doi: 10.2741/1383. Front Biosci. 2004. PMID: 14977603 Review.
-
Fever and hypothermia in systemic inflammation: recent discoveries and revisions.Front Biosci. 2005 Sep 1;10:2193-216. doi: 10.2741/1690. Front Biosci. 2005. PMID: 15970487 Review.
Cited by
-
New Insights into Immunopathology Associated to Bothrops lanceolatus Snake Envenomation: Focus on PLA2 Toxin.Int J Mol Sci. 2023 Jun 9;24(12):9931. doi: 10.3390/ijms24129931. Int J Mol Sci. 2023. PMID: 37373079 Free PMC article.
-
Association of Epicardial Adipose Tissue Adipocytes Hypertrophy with Biomarkers of Low-Grade Inflammation and Extracellular Matrix Remodeling in Patients with Coronary Artery Disease.Biomedicines. 2023 Jan 17;11(2):241. doi: 10.3390/biomedicines11020241. Biomedicines. 2023. PMID: 36830779 Free PMC article.
-
Biological Evaluation, Molecular Docking Analyses, and ADME Profiling of Certain New Quinazolinones as Anti-colorectal Agents.ACS Omega. 2022 May 23;7(22):18443-18458. doi: 10.1021/acsomega.2c00812. eCollection 2022 Jun 7. ACS Omega. 2022. PMID: 35694504 Free PMC article.
-
Metabolomics in early life and the association with body composition at age 2 years.Pediatr Obes. 2022 Mar;17(3):e12859. doi: 10.1111/ijpo.12859. Epub 2021 Oct 13. Pediatr Obes. 2022. PMID: 34644810 Free PMC article.
-
Bothrops moojeni snake venom induces an inflammatory response in preadipocytes: Insights into a new aspect of envenomation.PLoS Negl Trop Dis. 2022 Aug 8;16(8):e0010658. doi: 10.1371/journal.pntd.0010658. eCollection 2022 Aug. PLoS Negl Trop Dis. 2022. PMID: 35939519 Free PMC article.
References
-
- Dutour A., Achard V., Sell H., Naour N., Collart F., Gaborit B., Silaghi A., Eckel J., Alessi M.-C., Henegar C., et al. Secretory Type II Phospholipase A2 Is Produced and Secreted by Epicardial Adipose Tissue and Overexpressed in Patients with Coronary Artery Disease. J. Clin. Endocrinol. Metab. 2010;95:963–967. doi: 10.1210/jc.2009-1222. - DOI - PubMed
Publication types
MeSH terms
Substances
LinkOut - more resources
Full Text Sources
Medical
Research Materials
Miscellaneous
