

Epidural Stimulation Combined with Triple Gene Therapy for Spinal Cord Injury Treatment
- PMID: 33255323
- PMCID: PMC7734573
- DOI: 10.3390/ijms21238896
Epidural Stimulation Combined with Triple Gene Therapy for Spinal Cord Injury Treatment
Abstract
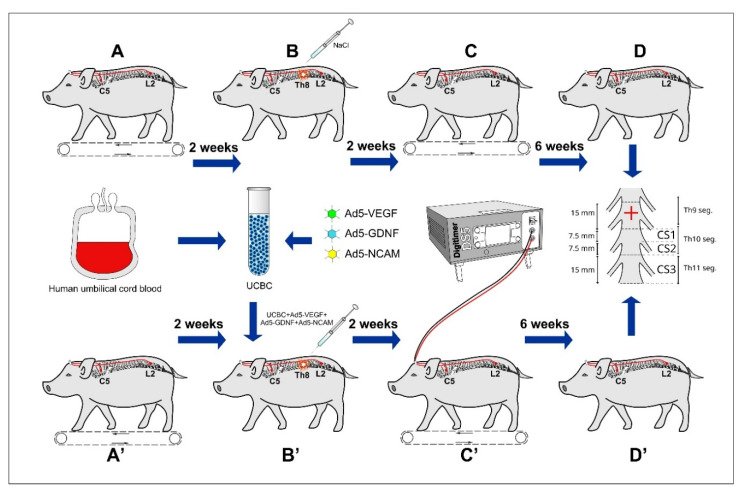
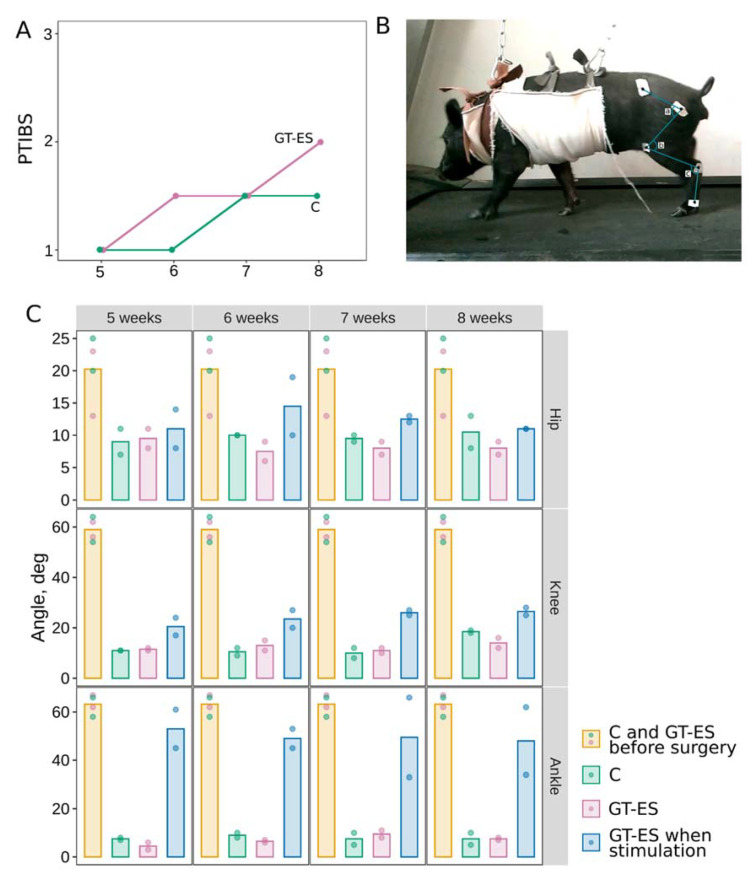
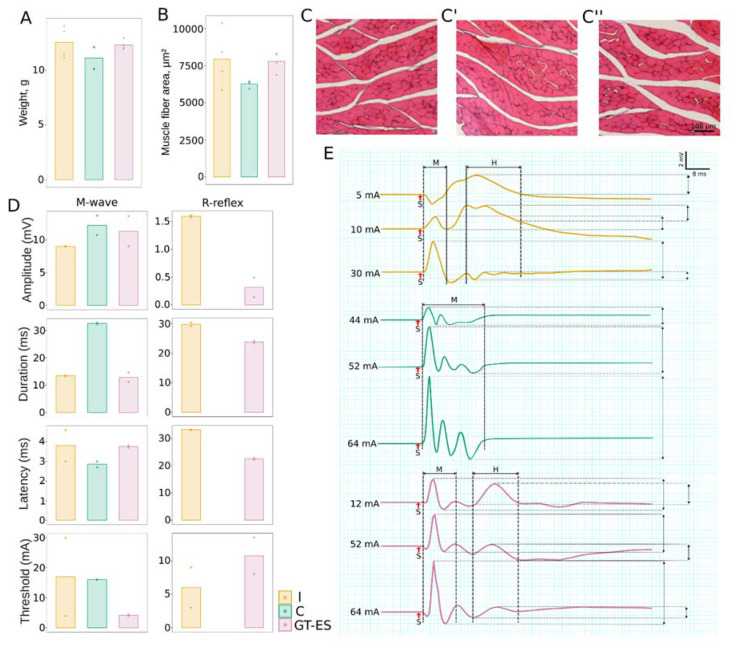
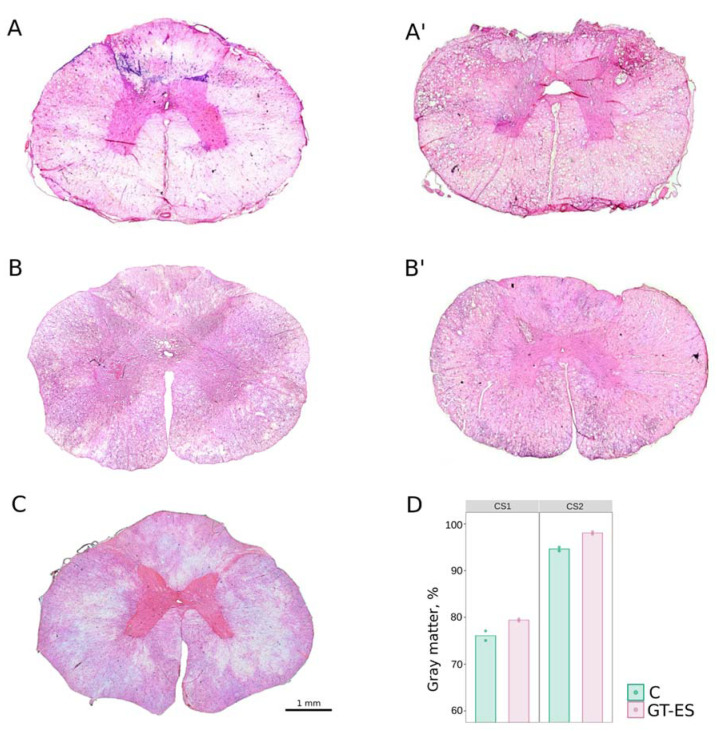
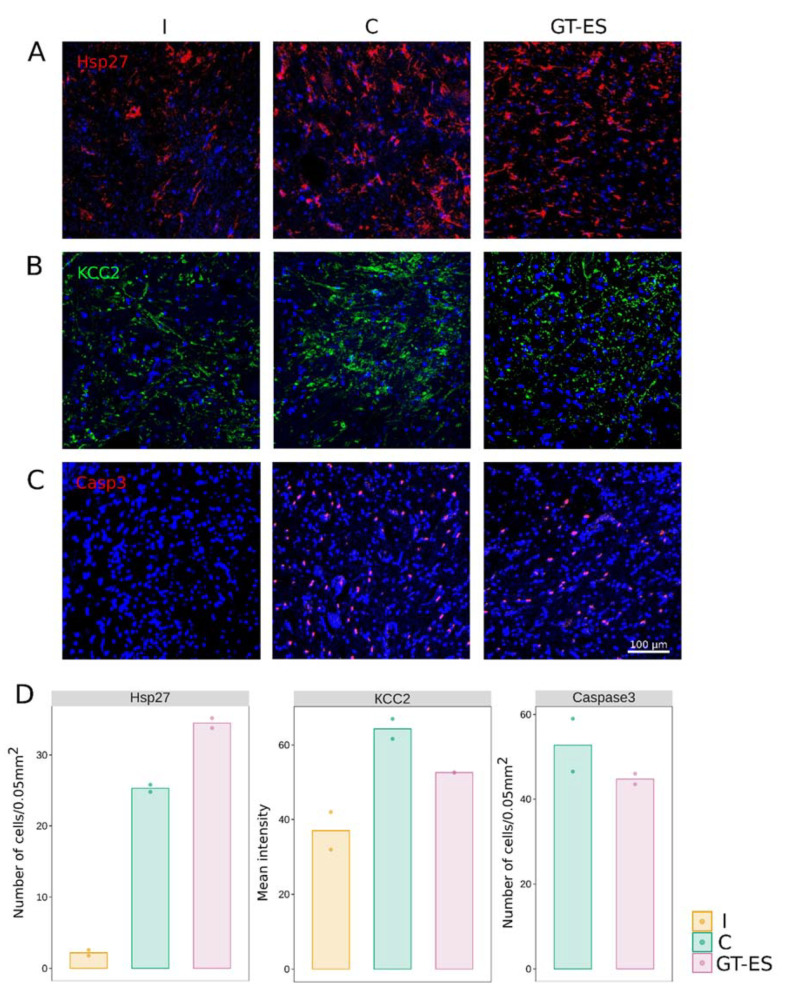
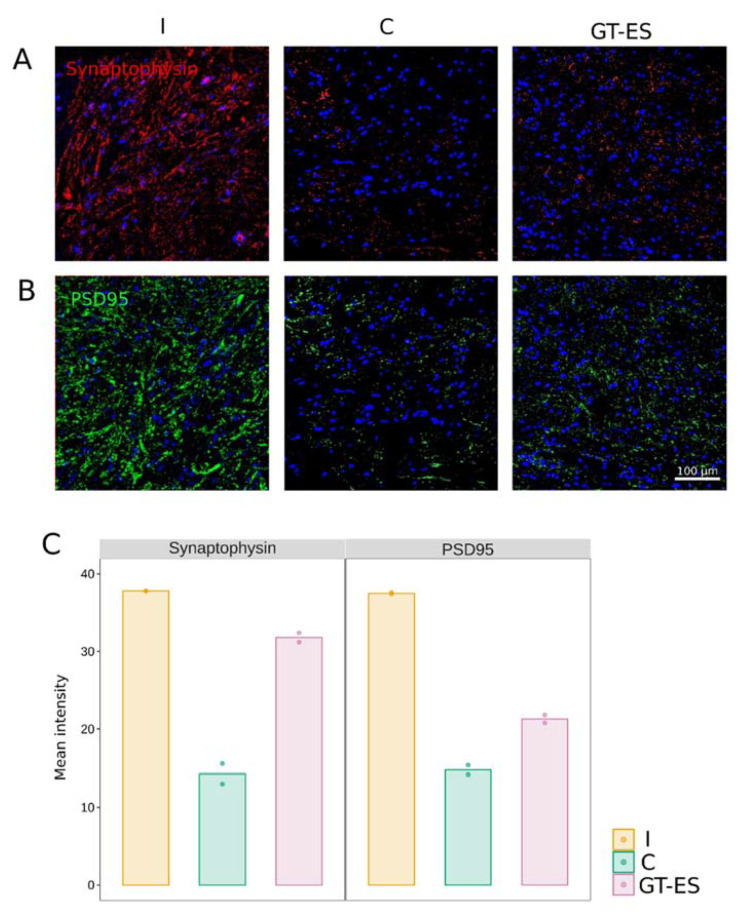
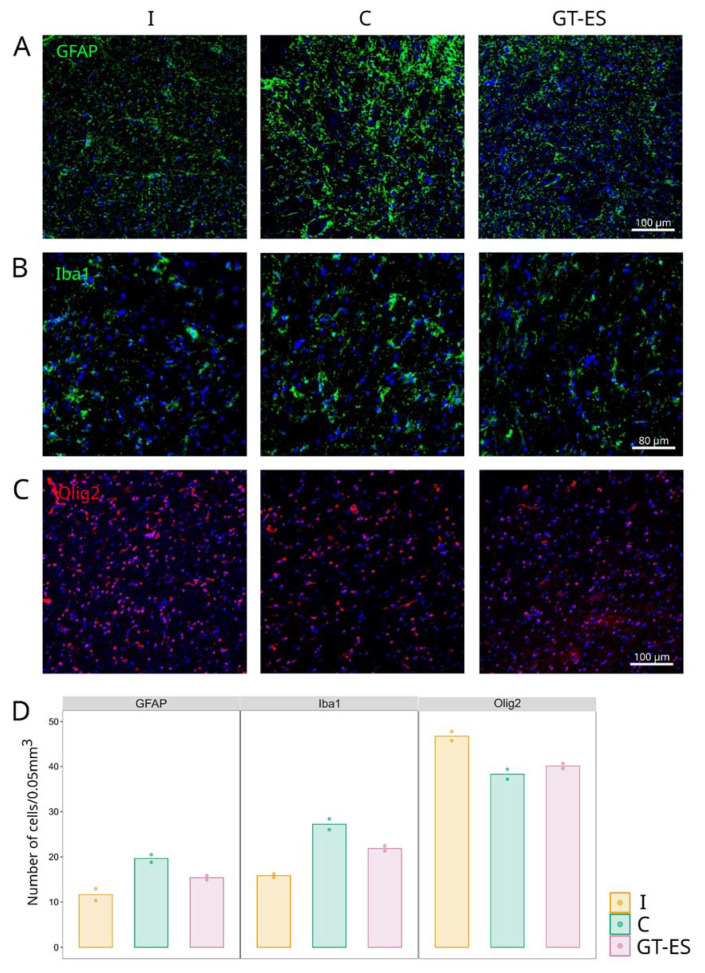
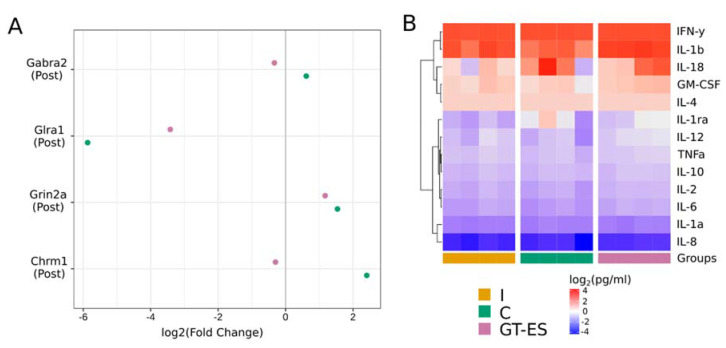
The translation of new therapies for spinal cord injury to clinical trials can be facilitated with large animal models close in morpho-physiological scale to humans. Here, we report functional restoration and morphological reorganization after spinal contusion in pigs, following a combined treatment of locomotor training facilitated with epidural electrical stimulation (EES) and cell-mediated triple gene therapy with umbilical cord blood mononuclear cells overexpressing recombinant vascular endothelial growth factor, glial-derived neurotrophic factor, and neural cell adhesion molecule. Preliminary results obtained on a small sample of pigs 2 months after spinal contusion revealed the difference in post-traumatic spinal cord outcomes in control and treated animals. In treated pigs, motor performance was enabled by EES and the corresponding morpho-functional changes in hind limb skeletal muscles were accompanied by the reorganization of the glial cell, the reaction of stress cell, and synaptic proteins. Our data demonstrate effects of combined EES-facilitated motor training and cell-mediated triple gene therapy after spinal contusion in large animals, informing a background for further animal studies and clinical translation.
Keywords: adenoviral vector; cell-mediated gene therapy; epidural electrical stimulation; glial cell-derived neurotrophic factor; human umbilical cord blood mononuclear cell; neural cell adhesion molecule; pigs; spinal cord injury; vascular endothelial growth factor.
Conflict of interest statement
The authors declare no conflict of interest. Some experiments were carried out as part of the state assignment of the Federal Research Center “Kazan Scientific Center of the Russian Academy of Sciences”.
Figures
Similar articles
-
A pilot study of cell-mediated gene therapy for spinal cord injury in mini pigs.Neurosci Lett. 2017 Mar 22;644:67-75. doi: 10.1016/j.neulet.2017.02.034. Epub 2017 Feb 14. Neurosci Lett. 2017. PMID: 28213069
-
New Therapy for Spinal Cord Injury: Autologous Genetically-Enriched Leucoconcentrate Integrated with Epidural Electrical Stimulation.Cells. 2022 Jan 2;11(1):144. doi: 10.3390/cells11010144. Cells. 2022. PMID: 35011706 Free PMC article.
-
Preventive Triple Gene Therapy Reduces the Negative Consequences of Ischemia-Induced Brain Injury after Modelling Stroke in a Rat.Int J Mol Sci. 2020 Sep 18;21(18):6858. doi: 10.3390/ijms21186858. Int J Mol Sci. 2020. PMID: 32962079 Free PMC article.
-
Emergence of Epidural Electrical Stimulation to Facilitate Sensorimotor Network Functionality After Spinal Cord Injury.Neuromodulation. 2019 Apr;22(3):244-252. doi: 10.1111/ner.12938. Epub 2019 Mar 6. Neuromodulation. 2019. PMID: 30840354 Review.
-
Epidural spinal cord stimulation as an intervention for motor recovery after motor complete spinal cord injury.J Neurophysiol. 2021 Dec 1;126(6):1843-1859. doi: 10.1152/jn.00020.2021. Epub 2021 Oct 20. J Neurophysiol. 2021. PMID: 34669485 Review.
Cited by
-
Precision Recovery After Spinal Cord Injury: Integrating CRISPR Technologies, AI-Driven Therapeutics, Single-Cell Omics, and System Neuroregeneration.Int J Mol Sci. 2025 Jul 20;26(14):6966. doi: 10.3390/ijms26146966. Int J Mol Sci. 2025. PMID: 40725213 Free PMC article. Review.
-
The role of spinal cord neuroanatomy and the variances of epidurally evoked spinal responses.Bioelectron Med. 2024 Jul 17;10(1):17. doi: 10.1186/s42234-024-00149-2. Bioelectron Med. 2024. PMID: 39020366 Free PMC article.
-
Molecular and cellular changes in the post-traumatic spinal cord remodeling after autoinfusion of a genetically-enriched leucoconcentrate in a mini-pig model.Neural Regen Res. 2023 Jul;18(7):1505-1511. doi: 10.4103/1673-5374.360241. Neural Regen Res. 2023. PMID: 36571355 Free PMC article.
-
Porcine Model of Spinal Cord Injury: A Systematic Review.Neurotrauma Rep. 2022 Sep 1;3(1):352-368. doi: 10.1089/neur.2022.0038. eCollection 2022. Neurotrauma Rep. 2022. PMID: 36204385 Free PMC article.
-
Planet of the AAVs: The Spinal Cord Injury Episode.Biomedicines. 2021 May 28;9(6):613. doi: 10.3390/biomedicines9060613. Biomedicines. 2021. PMID: 34071245 Free PMC article. Review.
References
-
- Petrosyan H.A., Alessi V., Hunanyan A.S., Sisto S.A., Arvanian V.L. Spinal electro-magnetic stimulation combined with transgene delivery of neurotrophin NT-3 and exercise: Novel combination therapy for spinal contusion injury. J. Neurophysiol. 2015;114:2923–2940. doi: 10.1152/jn.00480.2015. - DOI - PMC - PubMed
-
- Gerasimenko I.P., Avelev V.D., Nikitin O.A., Lavrov I.A. Initiation of locomotor activity in spinalized cats by epidural stimulation of the spinal cord. Ross. Fiziol. Zhurnal IM Sechenova. 2001;87:1161–1170. - PubMed
MeSH terms
Substances
Grants and funding
LinkOut - more resources
Full Text Sources
Medical
Molecular Biology Databases
