. 2020 Nov 25;10(12):996.
doi: 10.3390/diagnostics10120996.

Manual Muscle Testing-Force Profiles and Their Reproducibility

Affiliations

Manual Muscle Testing-Force Profiles and Their Reproducibility

Frank N Bittmann et al. Diagnostics (Basel). .

Abstract

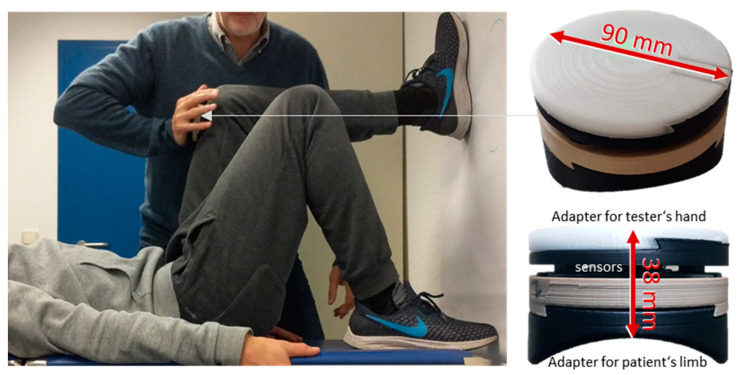
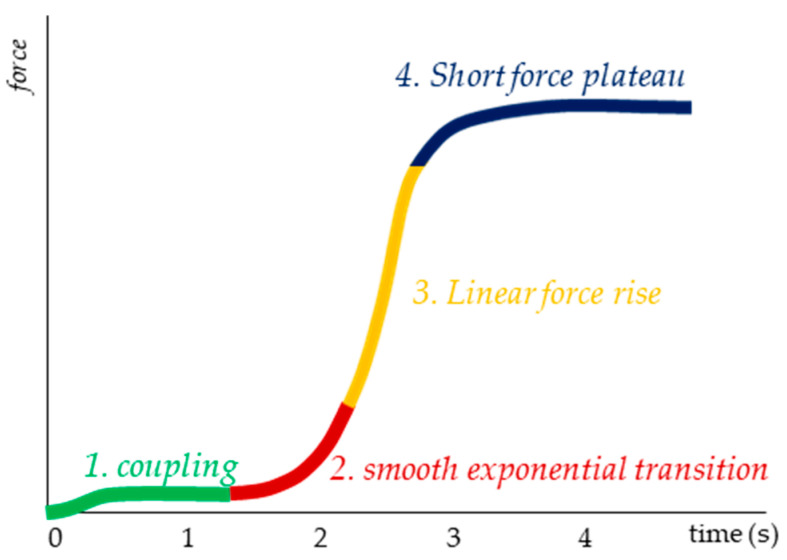
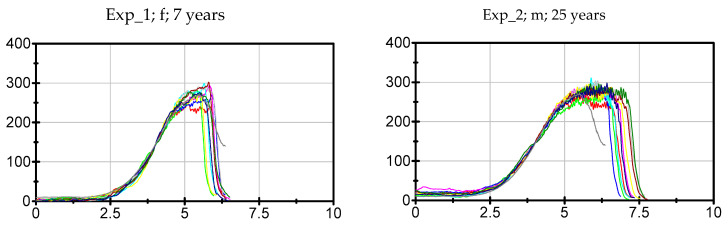
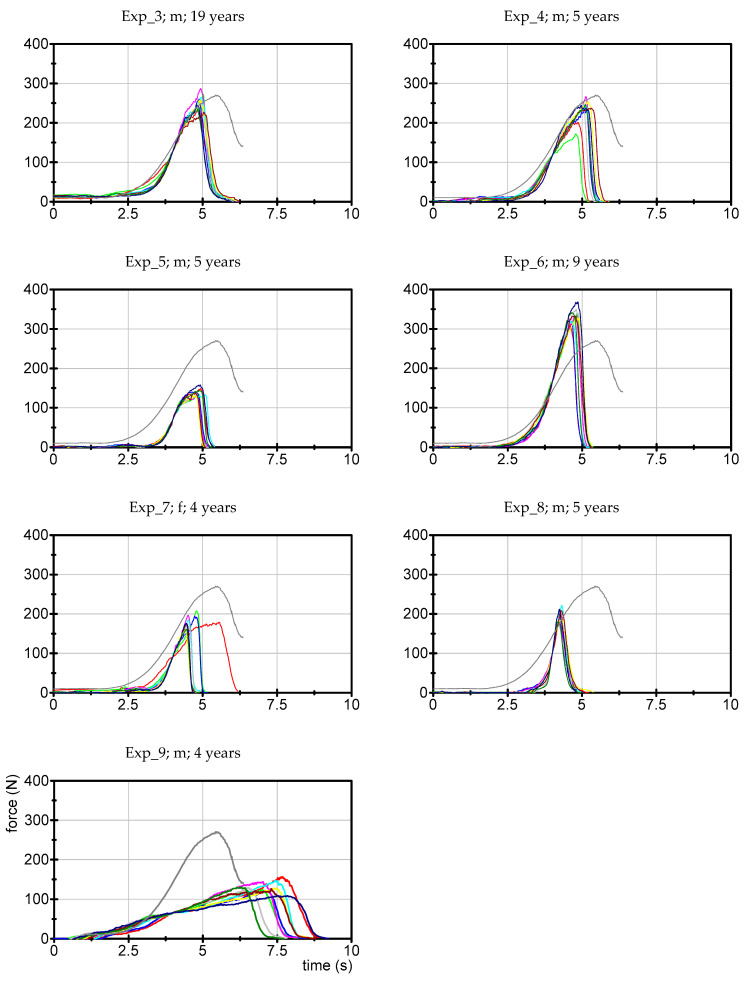
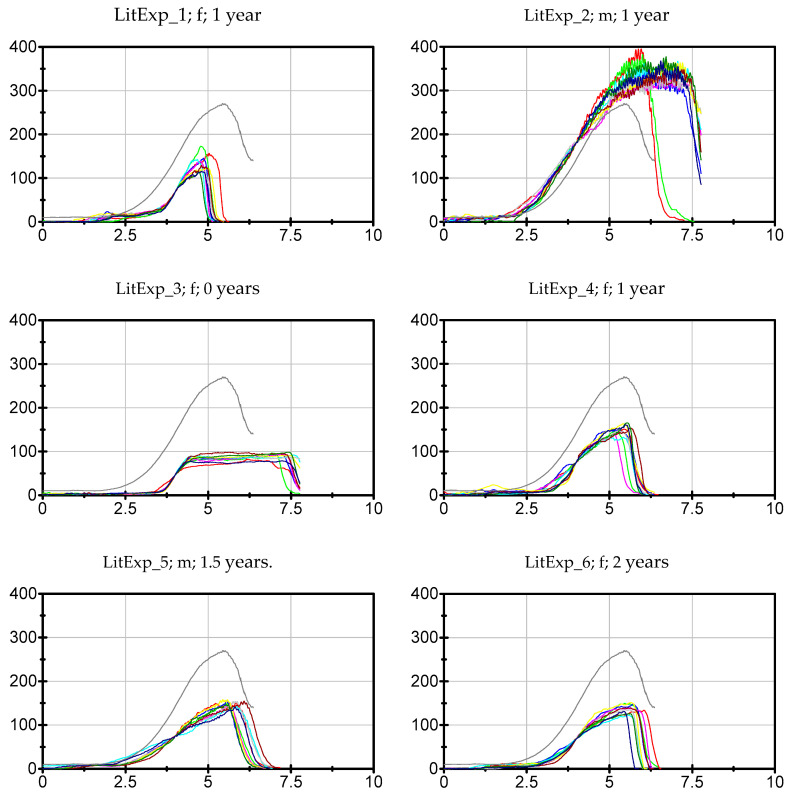
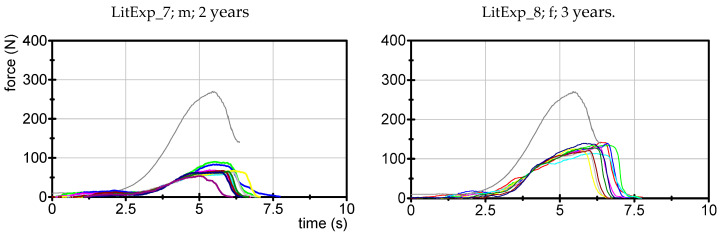
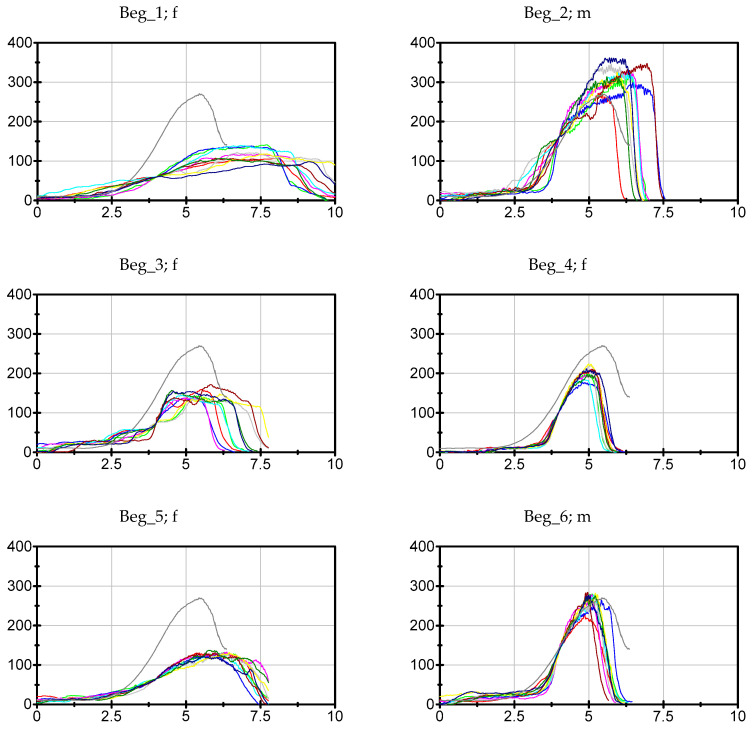
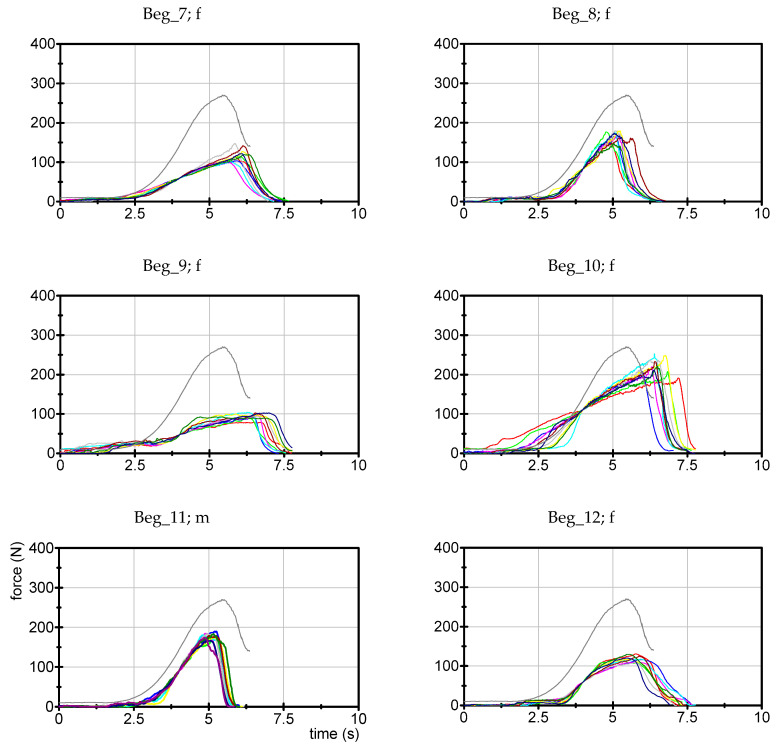
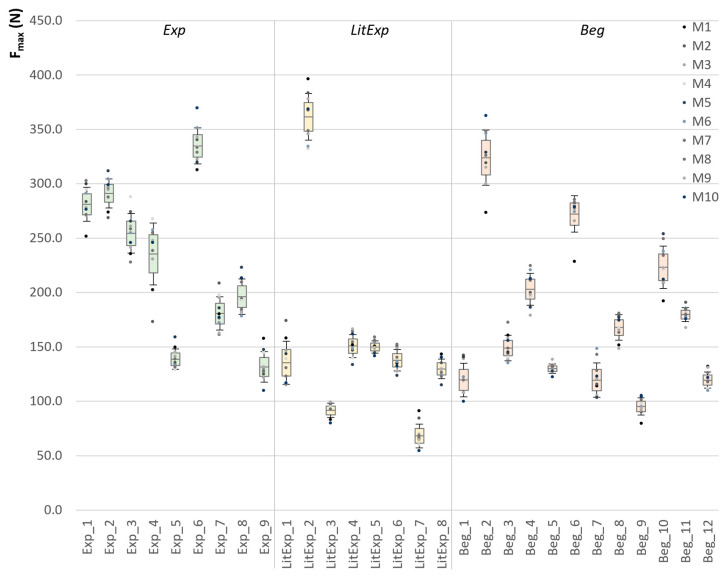
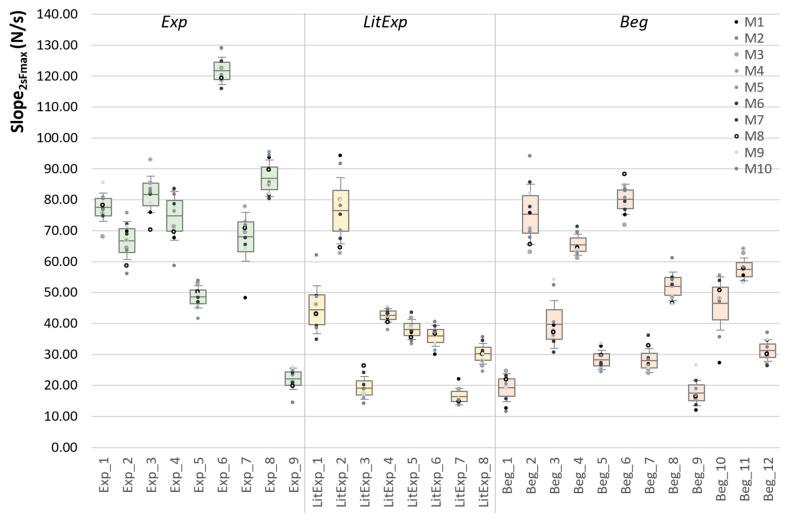
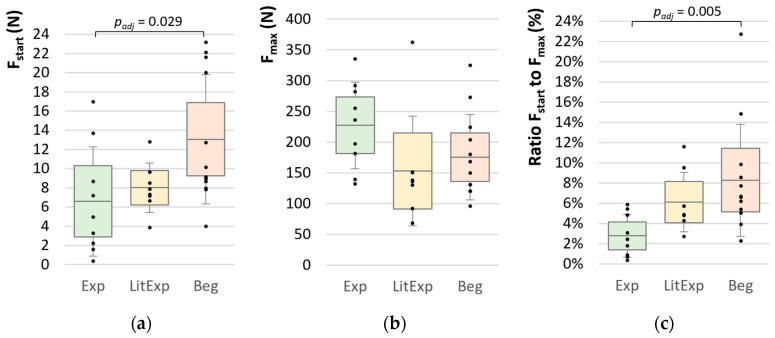
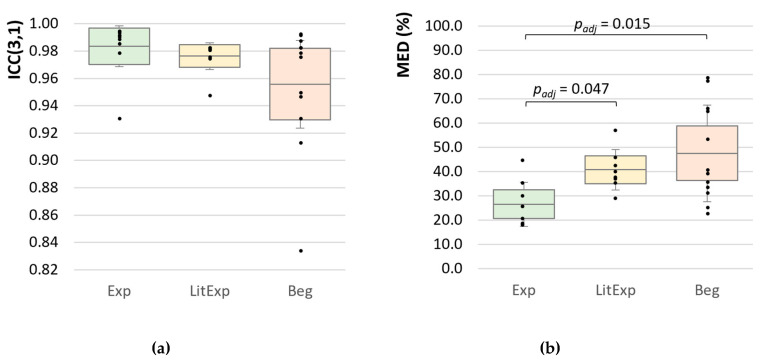
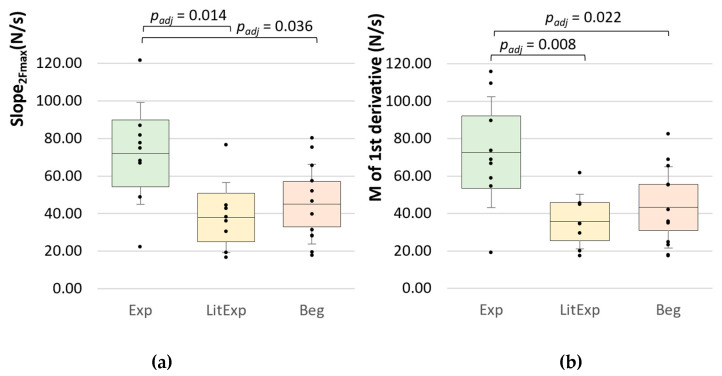
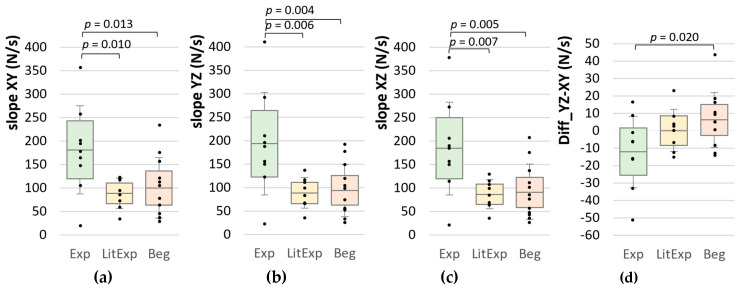
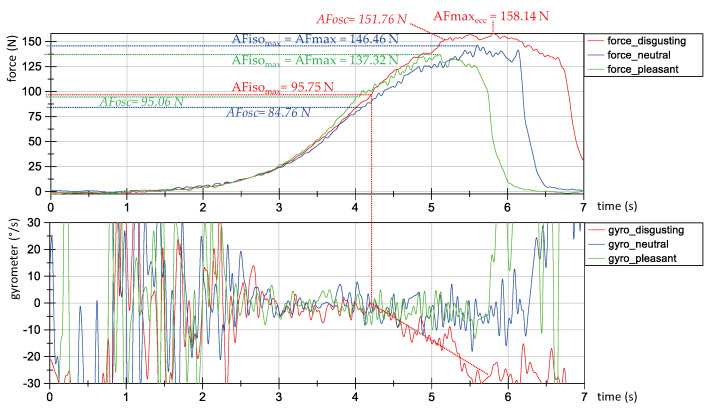
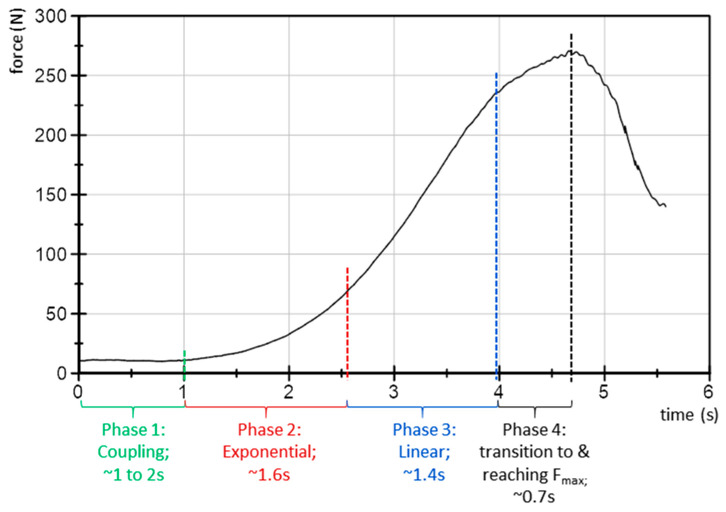
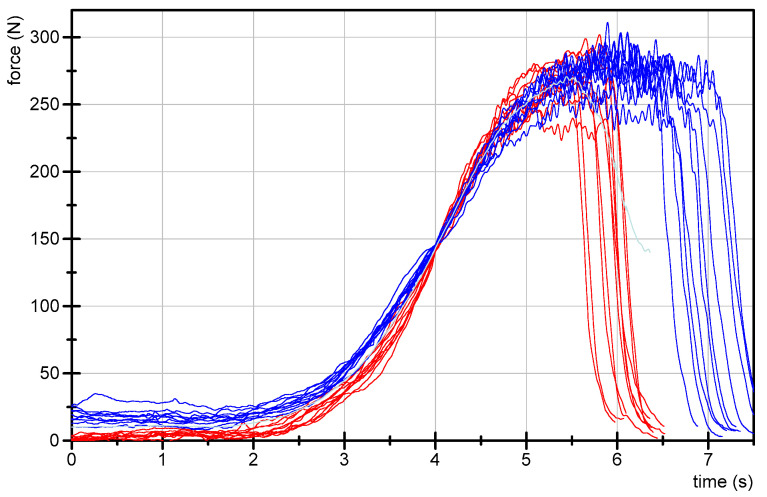
The manual muscle test (MMT) is a flexible diagnostic tool, which is used in many disciplines, applied in several ways. The main problem is the subjectivity of the test. The MMT in the version of a "break test" depends on the tester's force rise and the patient's ability to resist the applied force. As a first step, the investigation of the reproducibility of the testers' force profile is required for valid application. The study examined the force profiles of n = 29 testers (n = 9 experiences (Exp), n = 8 little experienced (LitExp), n = 12 beginners (Beg)). The testers performed 10 MMTs according to the test of hip flexors, but against a fixed leg to exclude the patient's reaction. A handheld device recorded the temporal course of the applied force. The results show significant differences between Exp and Beg concerning the starting force (padj = 0.029), the ratio of starting to maximum force (padj = 0.005) and the normalized mean Euclidean distances between the 10 trials (padj = 0.015). The slope is significantly higher in Exp vs. LitExp (p = 0.006) and Beg (p = 0.005). The results also indicate that experienced testers show inter-tester differences and partly even a low intra-tester reproducibility. This highlights the necessity of an objective MMT-assessment. Furthermore, an agreement on a standardized force profile is required. A suggestion for this is given.

Keywords: adaptive force; force profiles; handheld device; manual muscle testing; neuromuscular diagnostics; reproducibility.


Conflict of interest statement

The authors declare no conflict of interest. The funders had no role in the design of the study; in the collection, analyses, or interpretation of data; in the writing of the manuscript, or in the decision to publish the results.

Figures

Figure 1
Figure 1
Setting of the manual muscle test (MMT) of the hip flexors with fixed leg including the handheld device. The assistant’s leg is fixed against the wall to ensure a stable position also after repeated trials. The tester’s forearm is in a rectangular position to the rectus femoris muscle. The handheld device is located between the tester’s hand and the assistant’s distal thigh to measure the force profile produced by the tester. On the right side, the handheld device with two adapters is illustrated: one for the palm of the tester (white) and one for the limb of the patient (black), which is shaped according to the contours of the limb. Between the adapters, the sensor technology is placed. Dimensions of the handheld device are given in mm.
Figure 2
Figure 2
Schematical force profile including the phases of force rise.
Figure 3
Figure 3
Force profiles of experienced testers. Displayed are the 10 individual force profiles of the n = 9 experienced testers (Exp). The grey curve displays the suggestion of a standardized force profile (see discussion). To have a better comparison, the x- and y-axis are standardized (0–10 s and 0–400 N). The ID (Exp_no.), gender (f = female, m = male) and the years of experience are given per tester.
Figure 3
Figure 3
Force profiles of experienced testers. Displayed are the 10 individual force profiles of the n = 9 experienced testers (Exp). The grey curve displays the suggestion of a standardized force profile (see discussion). To have a better comparison, the x- and y-axis are standardized (0–10 s and 0–400 N). The ID (Exp_no.), gender (f = female, m = male) and the years of experience are given per tester.
Figure 4
Figure 4
Force profiles of little experienced testers. Displayed are the 10 individual force profiles of the n = 8 little experienced testers (LitExp). The grey curve displays the suggestion of a standardized force profile (see discussion). To have a better comparison, the x- and y-axes are standardized (0–10 s and 0–400 N). The ID (LitExp_no.), gender (f = female, m = male) and the years of experience are given per tester. The one tester with zero years of experience had successfully participated at the basis course of “Applied-Kinesiology based Integrative Medicine” in 2019 (3 month prior to measurement) and since then practices with colleagues.
Figure 4
Figure 4
Force profiles of little experienced testers. Displayed are the 10 individual force profiles of the n = 8 little experienced testers (LitExp). The grey curve displays the suggestion of a standardized force profile (see discussion). To have a better comparison, the x- and y-axes are standardized (0–10 s and 0–400 N). The ID (LitExp_no.), gender (f = female, m = male) and the years of experience are given per tester. The one tester with zero years of experience had successfully participated at the basis course of “Applied-Kinesiology based Integrative Medicine” in 2019 (3 month prior to measurement) and since then practices with colleagues.
Figure 5
Figure 5
Force profiles of Beginners. Displayed are the 10 individual force profiles of the n = 12 beginners (Beg). The grey curve displays the suggestion of a standardized force profile (see discussion). To have a better comparison, the x- and y-axes are standardized (0–10 s and 0–400 N). The ID (Beg_no.) and gender (f = female, m = male) are given per tester. The years of experience for each tester is zero.
Figure 5
Figure 5
Force profiles of Beginners. Displayed are the 10 individual force profiles of the n = 12 beginners (Beg). The grey curve displays the suggestion of a standardized force profile (see discussion). To have a better comparison, the x- and y-axes are standardized (0–10 s and 0–400 N). The ID (Beg_no.) and gender (f = female, m = male) are given per tester. The years of experience for each tester is zero.
Figure 6
Figure 6
Overview of Fmax of the repeated trials for each tester. Displayed are the arithmetic means (M), 95%-confidence intervals (CI) and standard deviations (SD; error bars) of the Fmax (N) of the 10 trials of each tester sorted into the groups experienced (Exp; green, n = 9), little experienced (LitExp; yellow, n = 8) and beginners (Beg; orange, n = 12). The analysis of variance for repeated measurements (ANOVA RM) are significant for Beg (p = 0.039) and LitExp (p = 0.033), not for Exp (p > 0.05).
Figure 7
Figure 7
Overall Slope. Displayed are the arithmetic means (M), 95% confidence intervals (CI) and standard deviations (SD; error bars) of the slope_2max (N/s) of the 10 trials of each tester sorted into groups experienced (Exp; green, n = 9), little experienced (LitExp; yellow, n = 8) and beginners (Beg; orange, n = 12).
Figure 8
Figure 8
Comparisons of force parameters between the groups. Displayed are the Ms, SDs (error bars) and 95%-CIs of (a) the starting force (Fstart (N)), (b) the maximum force (Fmax (N)) and (c) the ratio of Fstart to Fmax (%) of the 10 trials in the groups experienced (Exp; green), little experienced (LitExp; yellow) and beginners (Beg; orange). The significant results are displayed by adjusted p-values.
Figure 9
Figure 9
Intraclass correlation coefficient and normalized mean Euclidean distance. Displayed are the Ms, SDs (error bars) and 95%-CIs of (a) the ICC(3,1) and (b) the MED (%) comparing the groups experienced (Exp; green), little experienced (LitExp; yellow) and beginners (Beg; orange). For the significant comparisons adjusted p-values are given.
Figure 10
Figure 10
Inter-group comparisons of the overall slope parameters. Displayed are the Ms, SDs (error bars) and 95%-CIs of (a) the averaged slope from start to Fmax (Slope_2max) (N/s) and (b) the averaged 1st derivative of the 10 force profiles (N/s) comparing the groups Exp (green), LitExp (yellow) and Beg (orange). Significant comparisons are marked with padj-values.
Figure 11
Figure 11
Slope parameters in the linear section XYZ. Displayed are the Ms, SDs (error bars) and 95%-CIs of the slope in the linear part of (a) between XY, (b) between YZ, (c) between XZ and (d) the difference between YZ and XY comparing the groups Exp (green), LitExp (yellow) and Beg (orange). The significant pairwise comparisons are marked with p-values (not adjusted).
Figure 12
Figure 12
Oscillations during MMT measurements in interaction of tester and participant. Exemplary force (above) and gyrometer signals (below) during MMT measurements using the handheld device. An experienced tester performed the MMT of the hip flexors of one female participant during disgusting (red), neutral (blue) and pleasant (green) odors. The force values (N) for the parameters maximum Adaptive Force (AFmax), maximum isometric Adaptive Force (AFisomax) and the Adaptive Force in the moment of oscillation onset (AFosc) are given.
Figure 13
Figure 13
Suggestion for a standardized force profile including the proposed four phases considering the neurophysiological characteristics of forward controlling.
Figure 14
Figure 14
Ten repeated force curves of tester 1 (female, red) and tester 2 (male, blue) against a stable resistance in the MMT setting of the hip flexors with fixed leg (filtered with Butterworth, cut-off frequency 20 Hz, filter degree 5). The grey curve illustrates the average curve of all 20 trials, which is suggested as standardized force profile.

References

    1. Lovett R.W. The Diagnosis, Prognosis and Early Treatment of Poliomyelitis. J. Am. Med. Assoc. 1922;78:1607–1611.
    1. National Institute of Environmental Health Sciences Muscle Strength Testing—Manual Muscle Testing (MMT) [(accessed on 24 October 2020)]; Available online: https://www.niehs.nih.gov/research/resources/imacs/diseaseactivity/index....
    1. Watson N.F., Buchwald D., Goldberg J., Noonan C., Ellenbogen R.G. Neurologic Signs and Symptoms in Fibromyalgia. Arthritis Rheum. 2009;60:2839–2844. doi: 10.1002/art.24772. - DOI - PMC - PubMed
    1. Hickie I., Davenport T., Wakefield D., Vollmer-Conna U., Cameron B., Vernon S.D., Reeves W.C., Lloyd A. Post-Infective and Chronic Fatigue Syndromes Precipitated by Viral and Non-Viral Pathogens: Prospective Cohort Study. BMJ. 2006;333:575. doi: 10.1136/bmj.38933.585764.AE. - DOI - PMC - PubMed
    1. Pietrangelo T., Fulle S., Coscia F., Gigliotti P.V., Fanò-Illic G. Old Muscle in Young Body: An Aphorism Describing the Chronic Fatigue Syndrome. Eur. J. Transl. Myol. 2018;28:7688. doi: 10.4081/ejtm.2018.7688. - DOI - PMC - PubMed