

Inhibition of HDAC Enzymes Contributes to Differential Expression of Pro-Inflammatory Proteins in the TLR-4 Signaling Cascade
- PMID: 33255670
- PMCID: PMC7728096
- DOI: 10.3390/ijms21238943
Inhibition of HDAC Enzymes Contributes to Differential Expression of Pro-Inflammatory Proteins in the TLR-4 Signaling Cascade
Abstract
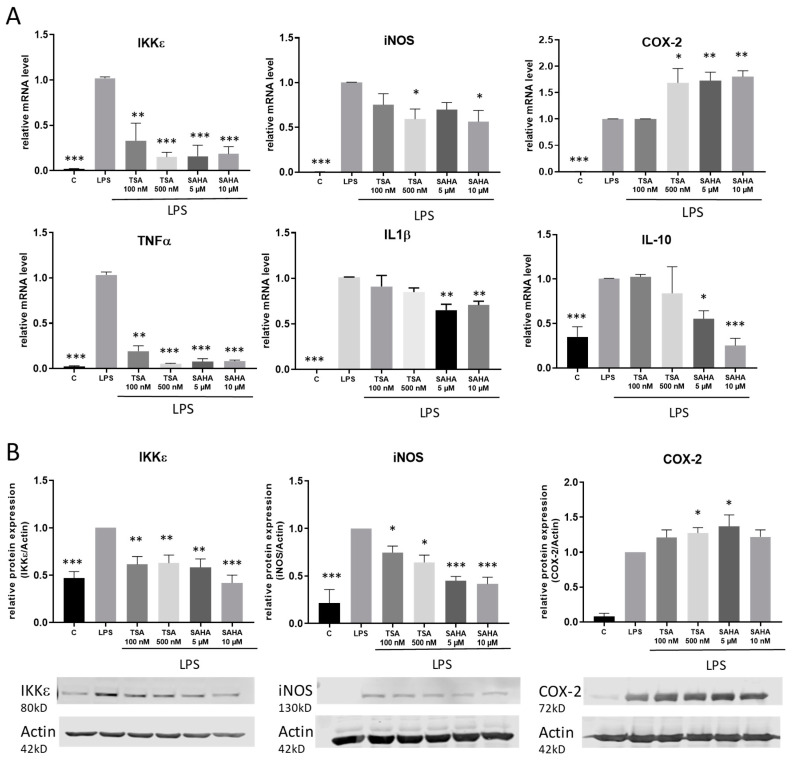
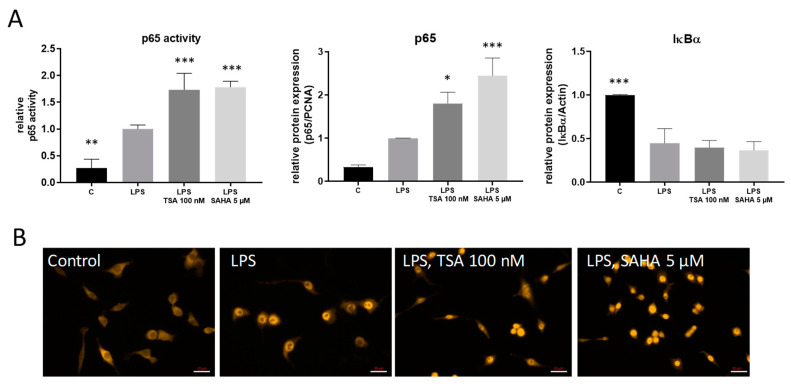
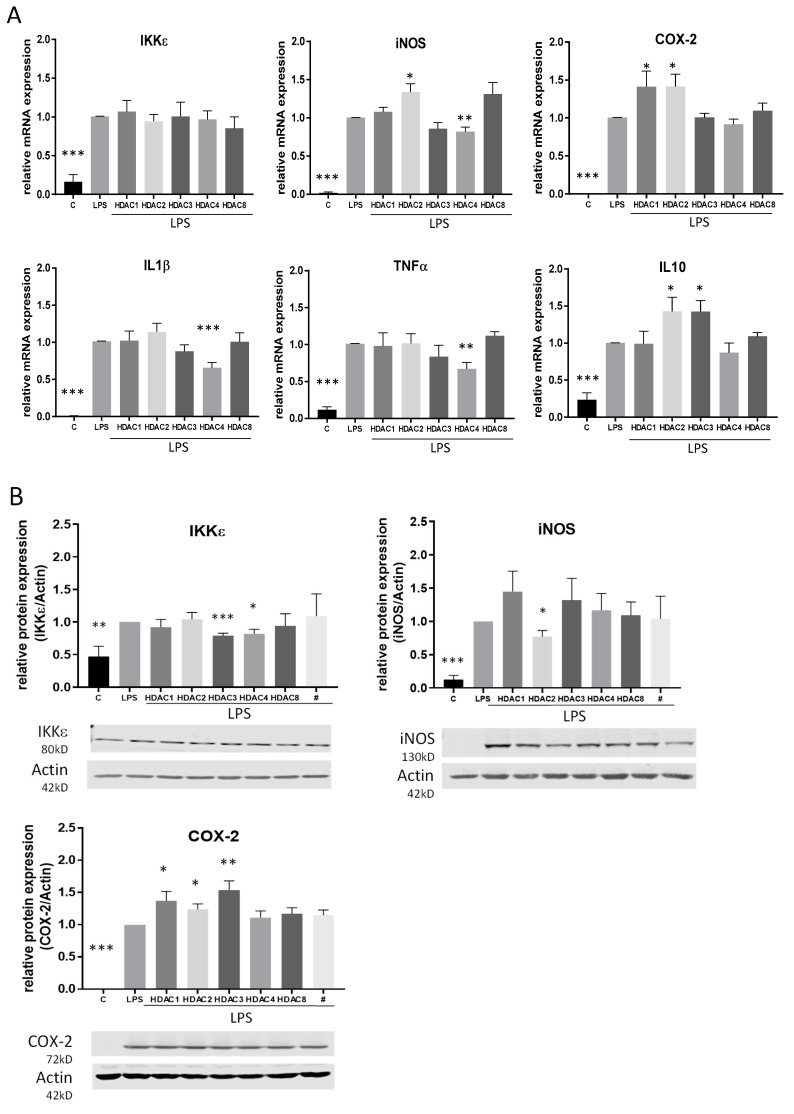
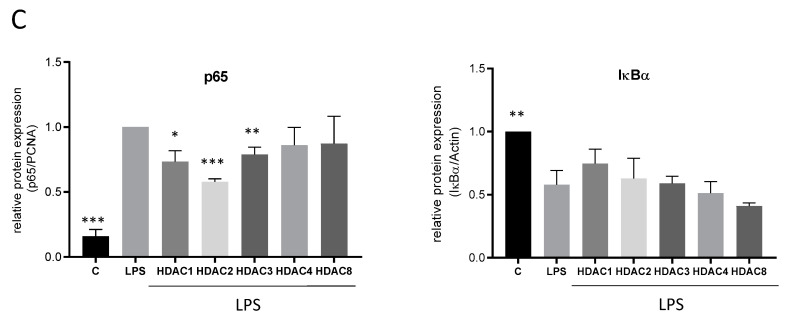
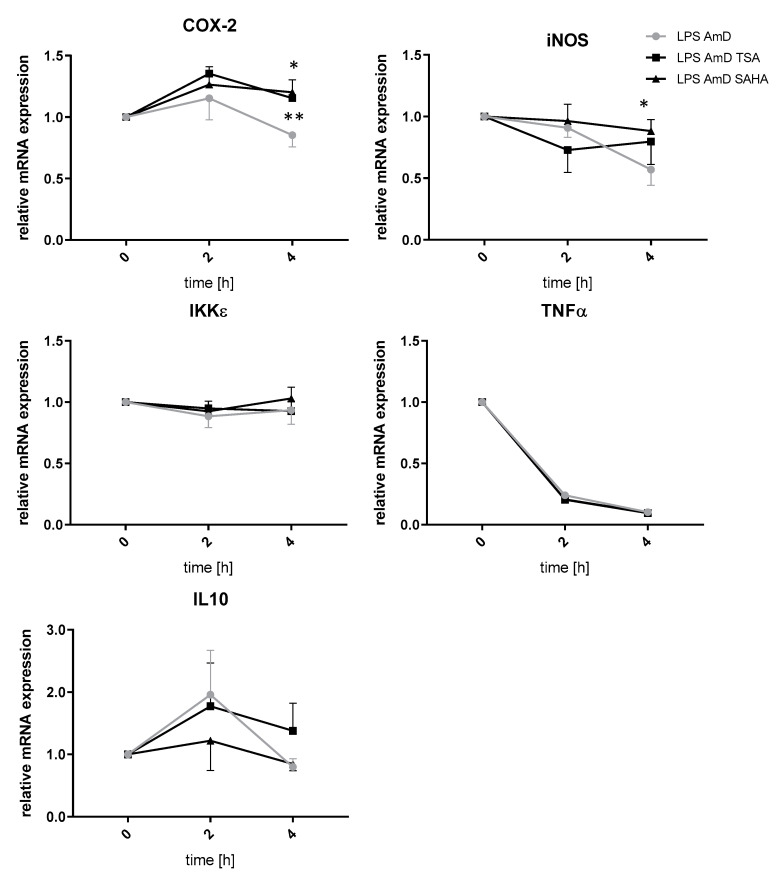
Class I and II histone deacetylases (HDAC) are considered important regulators of immunity and inflammation. Modulation of HDAC expression and activity is associated with altered inflammatory responses but reports are controversial and the specific impact of single HDACs is not clear. We examined class I and II HDACs in TLR-4 signaling pathways in murine macrophages with a focus on IκB kinase epsilon (IKKε) which has not been investigated in this context before. Therefore, we applied the pan-HDAC inhibitors (HDACi) trichostatin A (TSA) and suberoylanilide hydroxamic acid (SAHA) as well as HDAC-specific siRNA. Administration of HDACi reduced HDAC activity and decreased expression of IKKε although its acetylation was increased. Other pro-inflammatory genes (IL-1β, iNOS, TNFα) also decreased while COX-2 expression increased. HDAC 2, 3 and 4, respectively, might be involved in IKKε and iNOS downregulation with potential participation of NF-κB transcription factor inhibition. Suppression of HDAC 1-3, activation of NF-κB and RNA stabilization mechanisms might contribute to increased COX-2 expression. In conclusion, our results indicate that TSA and SAHA exert a number of histone- and HDAC-independent functions. Furthermore, the data show that different HDAC enzymes fulfill different functions in macrophages and might lead to both pro- and anti-inflammatory effects which have to be considered in therapeutic approaches.
Keywords: HDAC; acetylation; inflammation; macrophages.
Conflict of interest statement
The authors declare no conflict of interest.
Figures
Similar articles
-
Dose-dependent dual effects of HDAC inhibitors on glial inflammatory response.Sci Rep. 2025 Apr 10;15(1):12262. doi: 10.1038/s41598-025-96241-x. Sci Rep. 2025. PMID: 40211035 Free PMC article.
-
Histone deacetylase inhibitors increase microRNA-146a expression and enhance negative regulation of interleukin-1β signaling in osteoarthritis fibroblast-like synoviocytes.Osteoarthritis Cartilage. 2013 Dec;21(12):1987-96. doi: 10.1016/j.joca.2013.09.008. Epub 2013 Oct 6. Osteoarthritis Cartilage. 2013. PMID: 24107356
-
Inhibitory selectivity among class I HDACs has a major impact on inflammatory gene expression in macrophages.Eur J Med Chem. 2019 Sep 1;177:457-466. doi: 10.1016/j.ejmech.2019.05.038. Epub 2019 May 18. Eur J Med Chem. 2019. PMID: 31181405
-
Zn(II)-dependent histone deacetylase inhibitors: suberoylanilide hydroxamic acid and trichostatin A.Int J Biochem Cell Biol. 2009 Apr;41(4):736-9. doi: 10.1016/j.biocel.2008.05.026. Epub 2008 Aug 3. Int J Biochem Cell Biol. 2009. PMID: 18725319 Review.
-
[Epigenetic mechanisms and alcohol use disorders: a potential therapeutic target].Biol Aujourdhui. 2017;211(1):83-91. doi: 10.1051/jbio/2017014. Epub 2017 Jul 6. Biol Aujourdhui. 2017. PMID: 28682229 Review. French.
Cited by
-
Inflammation, Fibrosis and Cancer: Mechanisms, Therapeutic Options and Challenges.Cancers (Basel). 2022 Jan 22;14(3):552. doi: 10.3390/cancers14030552. Cancers (Basel). 2022. PMID: 35158821 Free PMC article. Review.
-
Andrographolide Attenuates Gut-Brain-Axis Associated Pathology in Gulf War Illness by Modulating Bacteriome-Virome Associated Inflammation and Microglia-Neuron Proinflammatory Crosstalk.Brain Sci. 2021 Jul 9;11(7):905. doi: 10.3390/brainsci11070905. Brain Sci. 2021. PMID: 34356139 Free PMC article.
-
Pan HDACi Valproic Acid and Trichostatin A Show Apparently Contrasting Inflammatory Responses in Cultured J774A.1 Macrophages.Epigenomes. 2022 Nov 3;6(4):38. doi: 10.3390/epigenomes6040038. Epigenomes. 2022. PMID: 36412793 Free PMC article.
-
HDAC6-selective inhibitor CAY10603 ameliorates cigarette smoke-induced small airway remodeling by regulating epithelial barrier dysfunction and reversing.Respir Res. 2024 Feb 5;25(1):66. doi: 10.1186/s12931-024-02688-3. Respir Res. 2024. PMID: 38317159 Free PMC article.
-
Dose-dependent dual effects of HDAC inhibitors on glial inflammatory response.Sci Rep. 2025 Apr 10;15(1):12262. doi: 10.1038/s41598-025-96241-x. Sci Rep. 2025. PMID: 40211035 Free PMC article.
References
MeSH terms
Substances
LinkOut - more resources
Full Text Sources
Research Materials
