

Optimisation of Urine Sample Preparation for Headspace-Solid Phase Microextraction Gas Chromatography-Mass Spectrometry: Altering Sample pH, Sulphuric Acid Concentration and Phase Ratio
- PMID: 33255680
- PMCID: PMC7760603
- DOI: 10.3390/metabo10120482
Optimisation of Urine Sample Preparation for Headspace-Solid Phase Microextraction Gas Chromatography-Mass Spectrometry: Altering Sample pH, Sulphuric Acid Concentration and Phase Ratio
Abstract
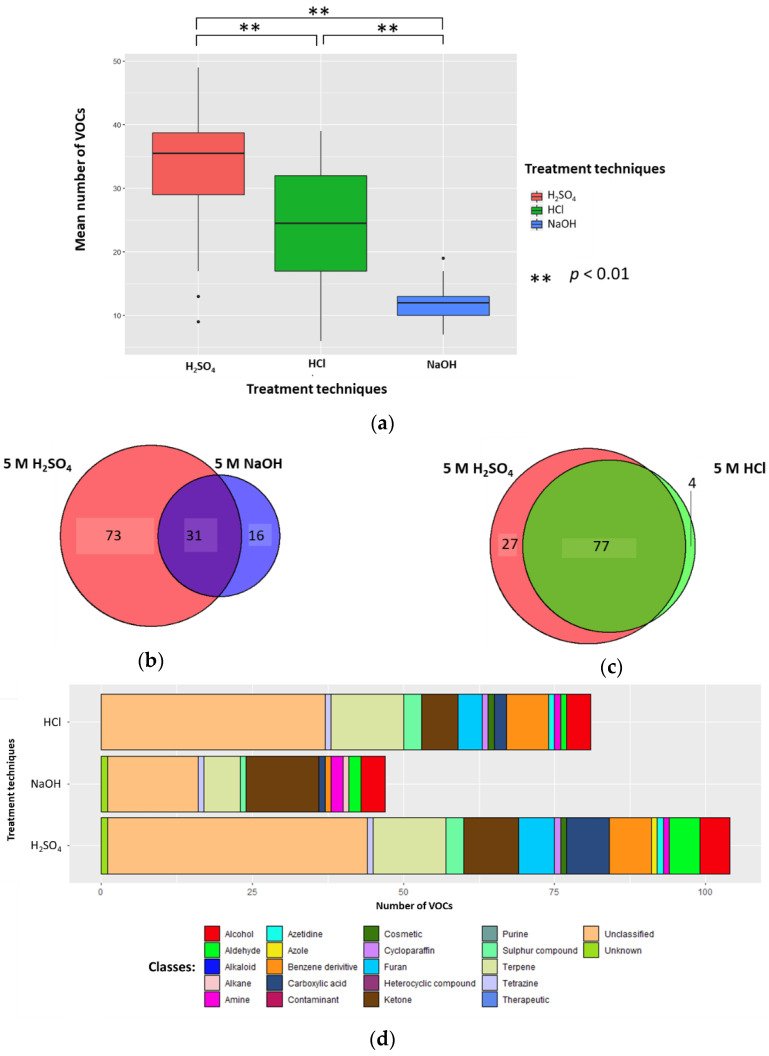
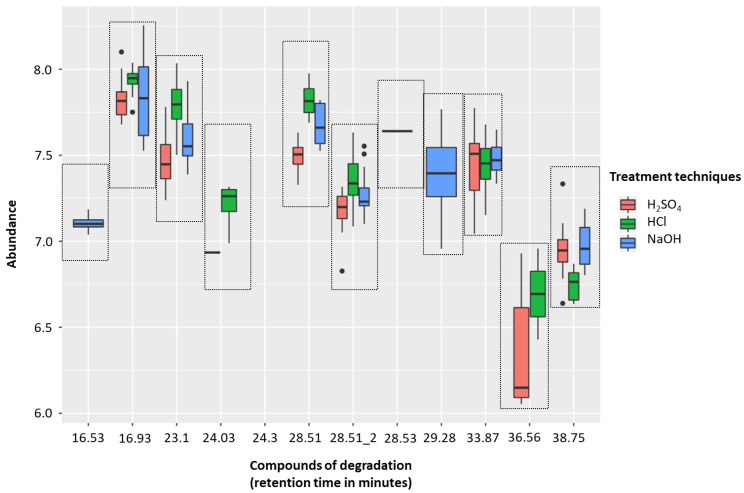
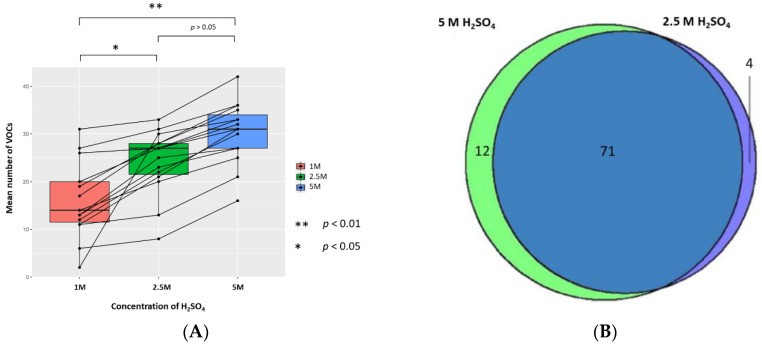
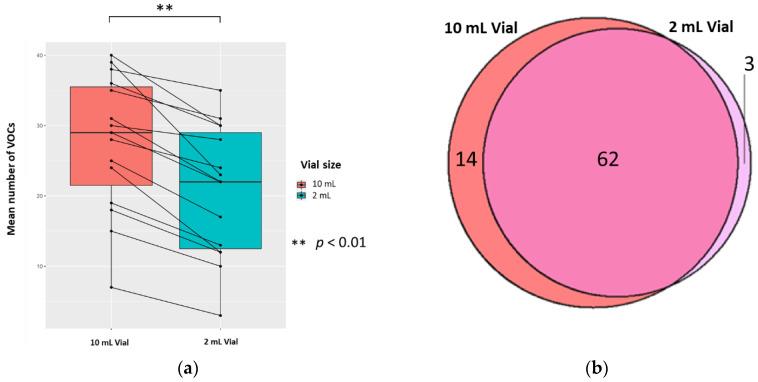
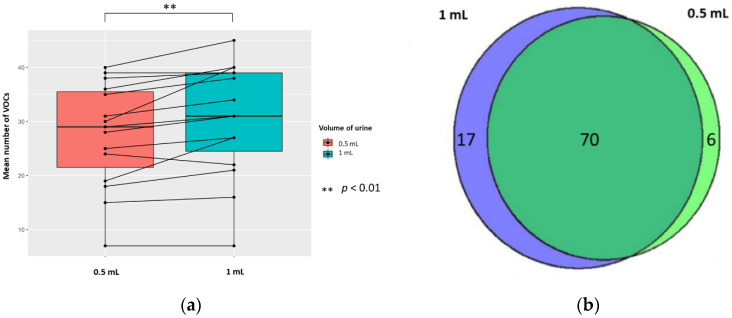
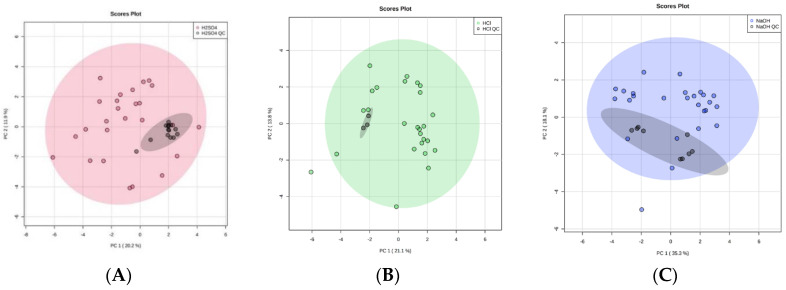
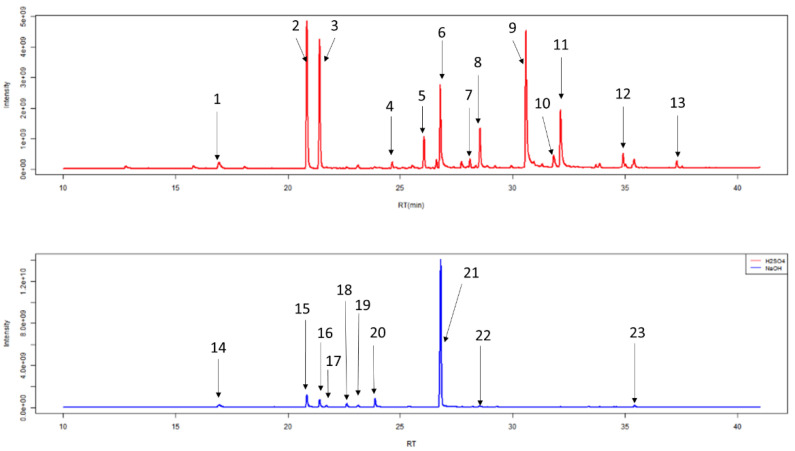
Headspace-solid phase microextraction gas chromatography-mass spectrometry (HS-SPME-GC-MS) can be used to measure volatile organic compounds (VOCs) in human urine. However, there is no widely adopted standardised protocol for the preparation of urine samples for analysis resulting in an inability to compare studies reliably between laboratories. This paper investigated the effect of altering urine sample pH, volume, and vial size for optimising detection of VOCs when using HS-SPME-GC-MS. This is the first, direct comparison of H2SO4, HCl, and NaOH as treatment techniques prior to HS-SPME-GC-MS analysis. Altering urine sample pH indicates that H2SO4 is more effective at optimising detection of VOCs than HCl or NaOH. H2SO4 resulted in a significantly larger mean number of VOCs being identified per sample (on average, 33.5 VOCs to 24.3 in HCl or 12.2 in NaOH treated urine) and more unique VOCs, produced a more diverse range of classes of VOCs, and led to less HS-SPME-GC-MS degradation. We propose that adding 0.2 mL of 2.5 M H2SO4 to 1 mL of urine within a 10 mL headspace vial is the optimal sample preparation prior to HS-SPME-GC-MS analysis. We hope the use of our optimised method for urinary HS-SPME-GC-MS analysis will enhance our understanding of human disease and bolster metabolic biomarker identification.
Keywords: H2SO4; HCl; HS-SPME-GC-MS; NaOH; VOCs; hydrochloric acid; sodium hydroxide; vials; volatile organic compounds.
Conflict of interest statement
The authors declare no conflict of interest.
Figures
Similar articles
-
Freeze-drying: an alternative method for the analysis of volatile organic compounds in the headspace of urine samples using solid phase micro-extraction coupled to gas chromatography - mass spectrometry.Chem Cent J. 2016 Mar 1;10:9. doi: 10.1186/s13065-016-0155-2. eCollection 2016. Chem Cent J. 2016. PMID: 26933445 Free PMC article.
-
Evaluating polyvinylidene fluoride - carbon black composites as solid phase microextraction coatings for the detection of urinary volatile organic compounds by gas chromatography-mass spectrometry.J Chromatogr A. 2022 Dec 6;1685:463606. doi: 10.1016/j.chroma.2022.463606. Epub 2022 Oct 27. J Chromatogr A. 2022. PMID: 36370629
-
[Recent advances in the application of headspace gas chromatography-mass spectrometry].Se Pu. 2018 Oct 8;36(10):962-971. doi: 10.3724/SP.J.1123.2018.05013. Se Pu. 2018. PMID: 30378354 Review. Chinese.
-
A comparison of sample preparation methods for extracting volatile organic compounds (VOCs) from equine faeces using HS-SPME.Metabolomics. 2018;14(2):19. doi: 10.1007/s11306-017-1315-7. Epub 2018 Jan 4. Metabolomics. 2018. PMID: 29367839 Free PMC article.
-
Analysis of urinary VOCs using mass spectrometric methods to diagnose cancer: A review.Clin Mass Spectrom. 2020 Oct 31;18:27-37. doi: 10.1016/j.clinms.2020.10.004. eCollection 2020 Nov. Clin Mass Spectrom. 2020. PMID: 34820523 Free PMC article. Review.
Cited by
-
A Complete Pipeline for Untargeted Urinary Volatolomic Profiling with Sorptive Extraction and Dual Polar and Nonpolar Column Methodologies Coupled with Gas Chromatography Time-of-Flight Mass Spectrometry.Anal Chem. 2023 Jan 17;95(2):758-765. doi: 10.1021/acs.analchem.2c02873. Epub 2023 Jan 5. Anal Chem. 2023. PMID: 36602225 Free PMC article.
-
Quantification of cancer biomarkers in urine using volatilomic approach.Heliyon. 2024 Oct 5;10(19):e39028. doi: 10.1016/j.heliyon.2024.e39028. eCollection 2024 Oct 15. Heliyon. 2024. PMID: 39435108 Free PMC article.
-
Differences in the Volatilomic Urinary Biosignature of Prostate Cancer Patients as a Feasibility Study for the Detection of Potential Biomarkers.Curr Oncol. 2023 May 10;30(5):4904-4921. doi: 10.3390/curroncol30050370. Curr Oncol. 2023. PMID: 37232828 Free PMC article.
-
Analysis of urinary volatile organic compounds for prostate cancer diagnosis: A systematic review.BJUI Compass. 2024 Aug 6;5(9):822-833. doi: 10.1002/bco2.423. eCollection 2024 Sep. BJUI Compass. 2024. PMID: 39323924 Free PMC article. Review.
-
Volatilomics: An Emerging and Promising Avenue for the Detection of Potential Prostate Cancer Biomarkers.Cancers (Basel). 2022 Aug 17;14(16):3982. doi: 10.3390/cancers14163982. Cancers (Basel). 2022. PMID: 36010975 Free PMC article. Review.
References
-
- Raftery D. Mass Spectrometry in Metabolomics: Methods and Protocols. Humana Press; Totowa, NJ, USA: 2014. - DOI
Grants and funding
LinkOut - more resources
Full Text Sources
Miscellaneous
