

Bone Morphogenetic Protein 2 (BMP-2) Aggregates Can be Solubilized by Albumin-Investigation of BMP-2 Aggregation by Light Scattering and Electrophoresis
- PMID: 33255722
- PMCID: PMC7760923
- DOI: 10.3390/pharmaceutics12121143
Bone Morphogenetic Protein 2 (BMP-2) Aggregates Can be Solubilized by Albumin-Investigation of BMP-2 Aggregation by Light Scattering and Electrophoresis
Abstract
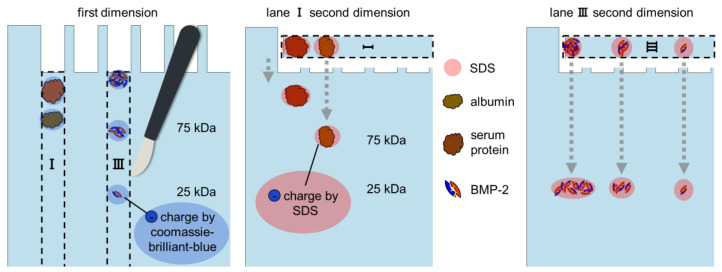
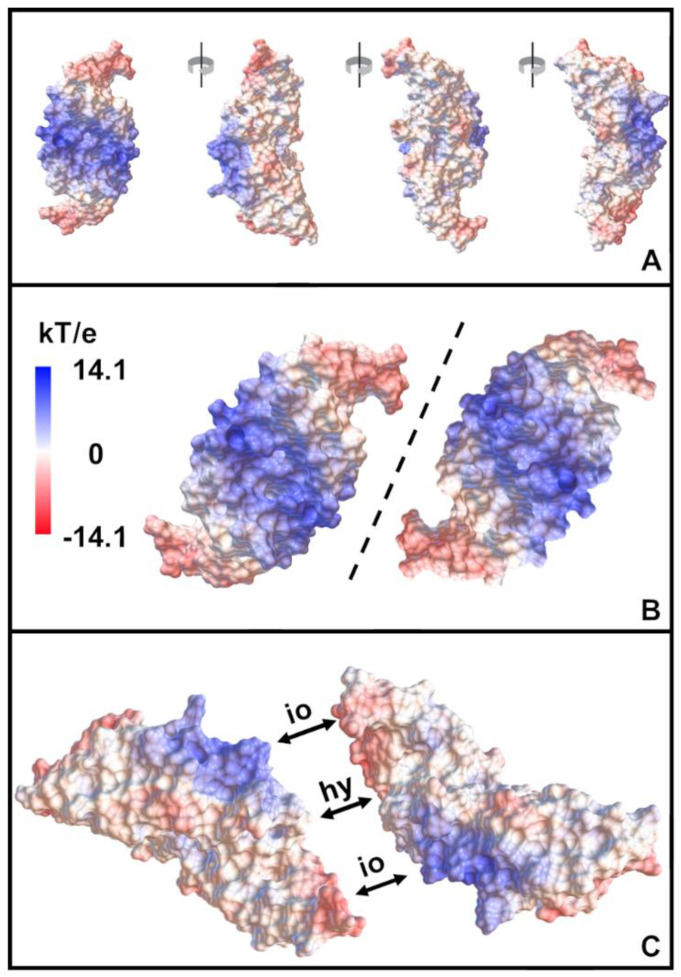
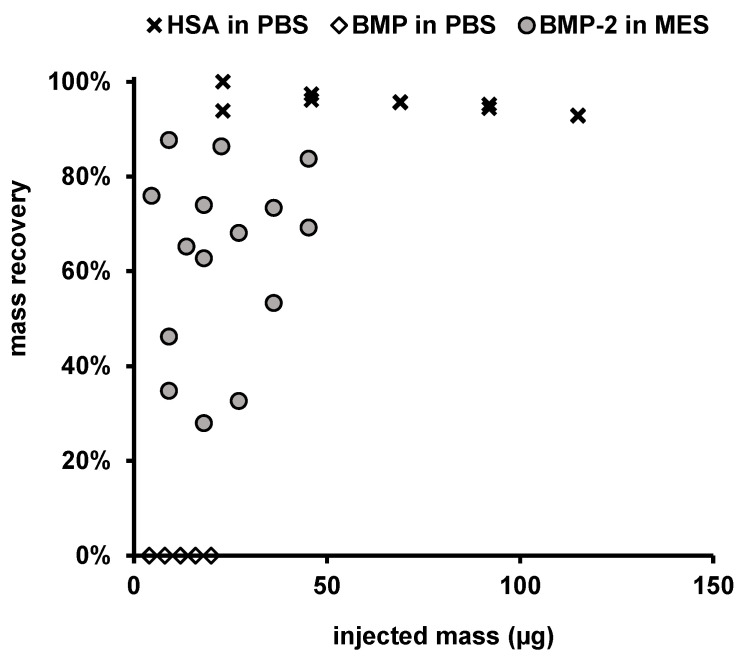
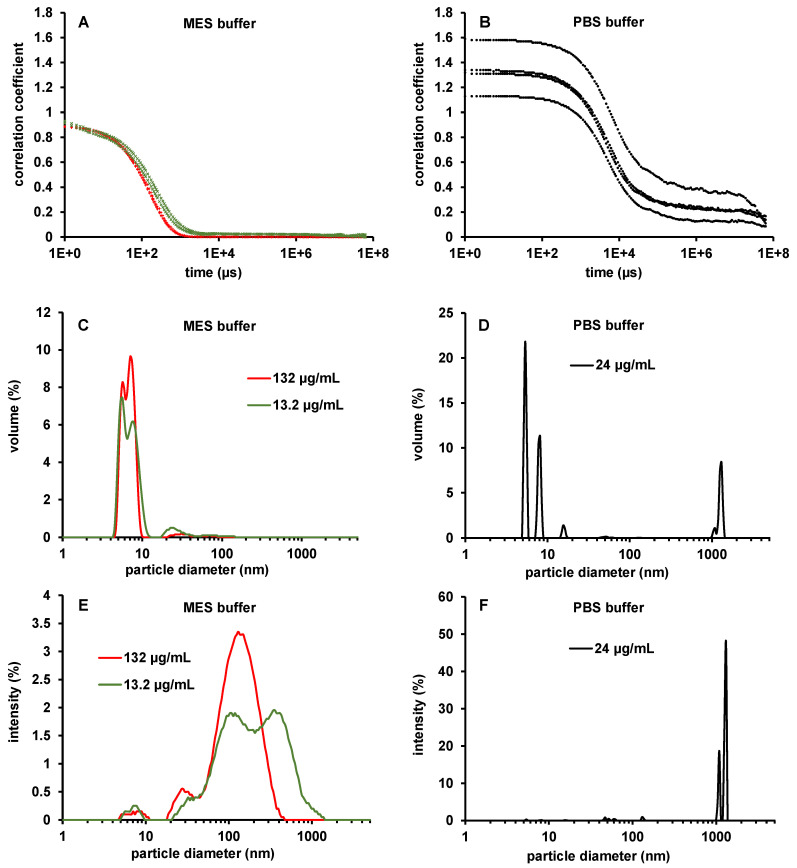
Bone morphogenetic protein 2 (BMP-2) has a high tendency to aggregate at physiological pH and physiological ionic strength, which can complicate the development of growth factor delivery systems. The aggregation behavior in differently concentrated BMP-2 solutions was investigated using dynamic and static light scattering. It was found that at higher concentrations larger aggregates are formed, whose size decreases again with increasing dilution. A solubilizing effect and therefore less aggregation was observed upon the addition of albumin. Imaged capillary isoelectric focusing and the simulation of the surface charges of BMP-2 were used to find a possible explanation for the unusually low solubility of BMP-2 at physiological pH. In addition to hydrophobic interactions, attractive electrostatic interactions might be decisive in the aggregation of BMP-2 due to the particular distribution of surface charges. These results help to better understand the solubility behavior of BMP-2 and thus support future pharmaceutical research and the development of new strategies for the augmentation of bone healing.
Keywords: BMP-2; albumin; protein aggregation; protein solubilization; protein-protein interactions.
Conflict of interest statement
The authors declare no conflict of interest.
Figures


Similar articles
-
ELISA- and Activity Assay-Based Quantification of BMP-2 Released In Vitro Can Be Biased by Solubility in "Physiological" Buffers and an Interfering Effect of Chitosan.Pharmaceutics. 2021 Apr 19;13(4):582. doi: 10.3390/pharmaceutics13040582. Pharmaceutics. 2021. PMID: 33921903 Free PMC article.
-
Rational design of viscosity reducing mutants of a monoclonal antibody: hydrophobic versus electrostatic inter-molecular interactions.MAbs. 2015;7(1):212-30. doi: 10.4161/19420862.2014.985504. MAbs. 2015. PMID: 25559441 Free PMC article.
-
Solubilized bone morphogenetic protein (BMP) from mouse osteosarcoma and rat demineralized bone matrix.Clin Orthop Relat Res. 1980 May;(148):281-90. Clin Orthop Relat Res. 1980. PMID: 6929747
-
Nonnative aggregation of an IgG1 antibody in acidic conditions, part 2: nucleation and growth kinetics with competing growth mechanisms.J Pharm Sci. 2011 Jun;100(6):2104-19. doi: 10.1002/jps.22447. Epub 2011 Jan 6. J Pharm Sci. 2011. PMID: 21213307
-
Bone morphogenetic protein signalling in pulmonary hypertension: advances and therapeutic implications.Exp Physiol. 2017 Sep 1;102(9):1083-1089. doi: 10.1113/EP086041. Epub 2017 Jun 6. Exp Physiol. 2017. PMID: 28449240 Review.
Cited by
-
Injectable phase-separated tetra-armed poly(ethylene glycol) hydrogel scaffold allows sustained release of growth factors to enhance the repair of critical bone defects.Regen Ther. 2023 Nov 25;25:24-34. doi: 10.1016/j.reth.2023.11.008. eCollection 2024 Mar. Regen Ther. 2023. PMID: 38108043 Free PMC article.
-
ELISA- and Activity Assay-Based Quantification of BMP-2 Released In Vitro Can Be Biased by Solubility in "Physiological" Buffers and an Interfering Effect of Chitosan.Pharmaceutics. 2021 Apr 19;13(4):582. doi: 10.3390/pharmaceutics13040582. Pharmaceutics. 2021. PMID: 33921903 Free PMC article.
-
Self-Prepared Hyaluronic Acid/Alkaline Gelatin Composite with Nano-Hydroxyapatite and Bone Morphogenetic Protein for Cranial Bone Formation.Int J Mol Sci. 2023 Jan 6;24(2):1104. doi: 10.3390/ijms24021104. Int J Mol Sci. 2023. PMID: 36674618 Free PMC article.
-
Focused Ultrasound-Mediated Release of Bone Morphogenetic Protein 2 from Hydrogels for Bone Regeneration.Gels. 2025 Feb 6;11(2):120. doi: 10.3390/gels11020120. Gels. 2025. PMID: 39996663 Free PMC article.
-
One-Step Preparation of an Injectable Hydrogel Scaffold System Capable of Sequential Dual-Growth Factor Release to Maximize Bone Regeneration.Adv Healthc Mater. 2023 Feb;12(4):e2202401. doi: 10.1002/adhm.202202401. Epub 2022 Dec 11. Adv Healthc Mater. 2023. PMID: 36453668 Free PMC article.
References
-
- Porter T.J., Rathore S., Rouse J., Denton M. Biomolecules in tissue engineered medical products (TEMPs): A case study of recombinant human bone morphogenetic protein-2 (rhBMP-2) J. ASTM Int. 2004;1:1–24. doi: 10.1520/JAI11517. - DOI
-
- Uludag H., D’Augusta D., Golden J., Timony G., Li J., Riedel R., Wozney J.M. Implantation of recombinant human bone morphogenetic proteins with biomaterial carriers: A correlation between protein pharmacokinetics and osteoinduction in the rat ectopic model. J. Biomed. Mater. Res. 2000;50:227–238. doi: 10.1002/(SICI)1097-4636(200005)50:2<227::AID-JBM18>3.0.CO;2-2. - DOI - PubMed
Grants and funding
LinkOut - more resources
Full Text Sources
Other Literature Sources
