. 2020 Nov 26;10(12):909.
doi: 10.3390/brainsci10120909.

Differential Timing and Coordination of Neurogenesis and Astrogenesis in Developing Mouse Hippocampal Subregions

Affiliations

Differential Timing and Coordination of Neurogenesis and Astrogenesis in Developing Mouse Hippocampal Subregions

Allison M Bond et al. Brain Sci. .

Abstract

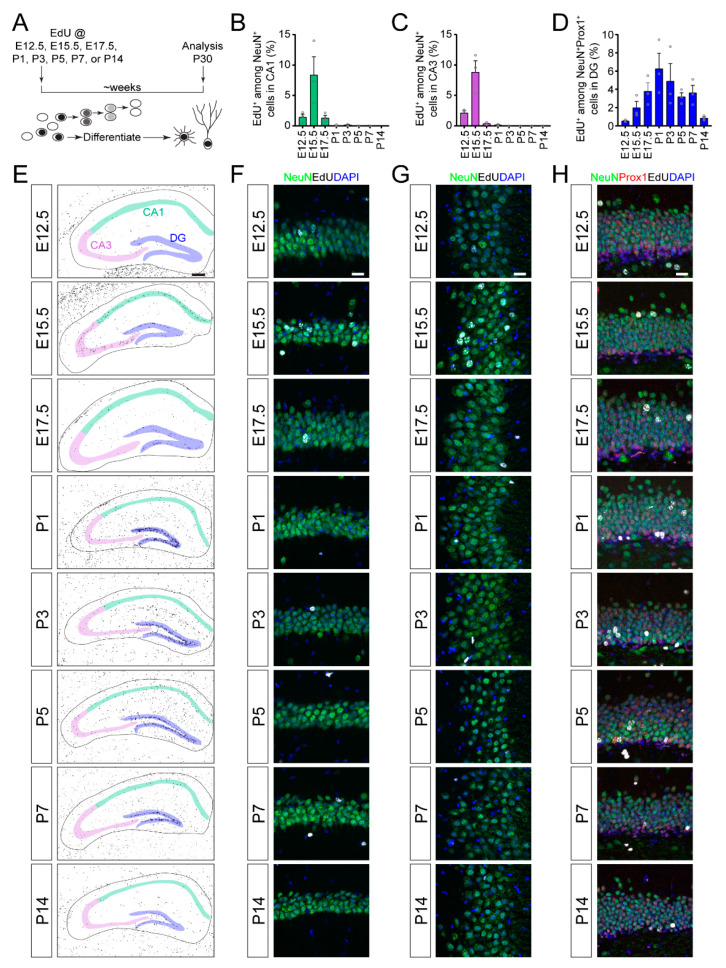
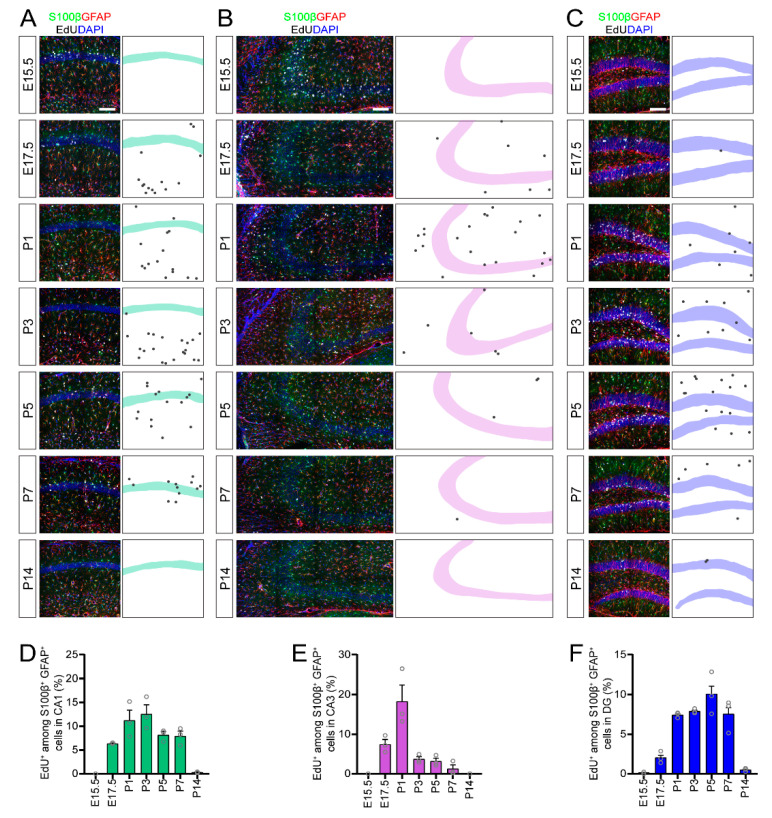
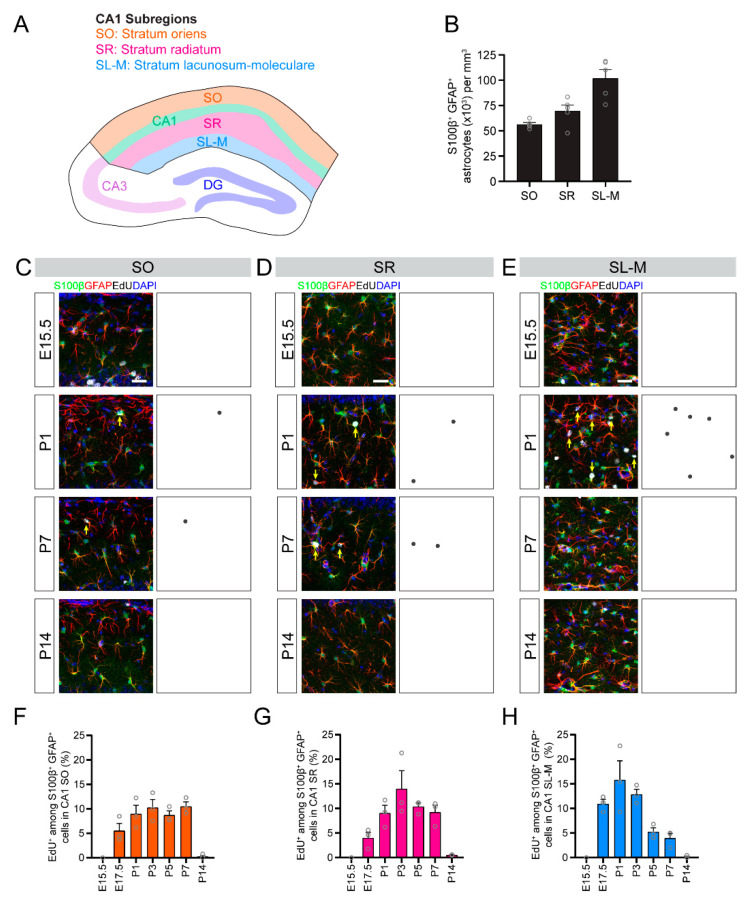
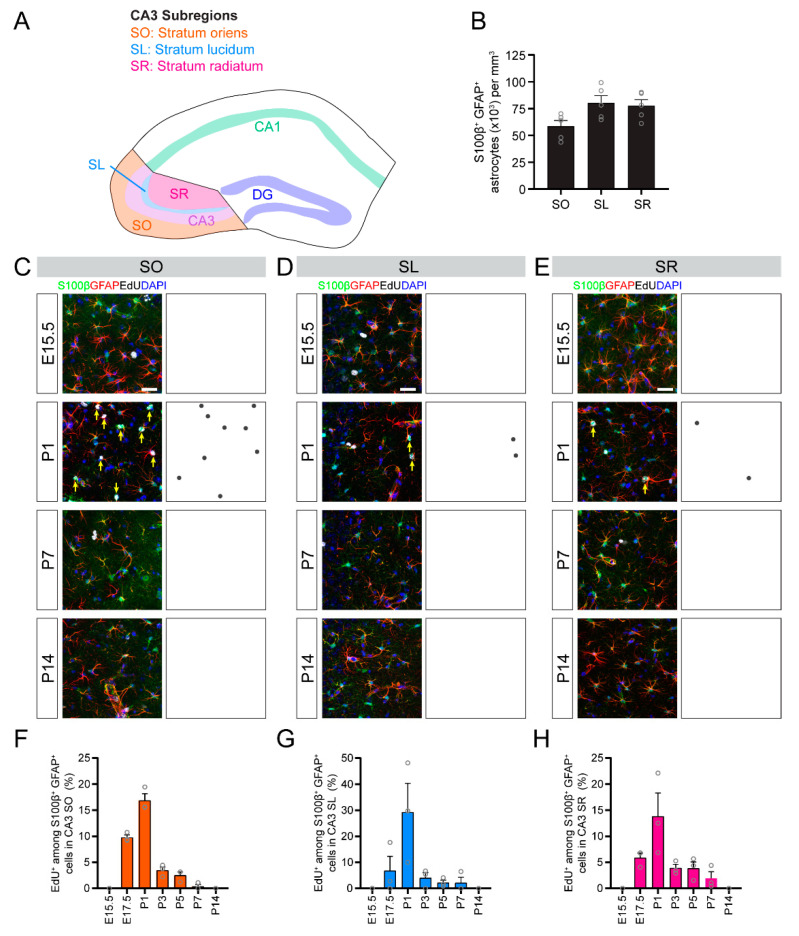
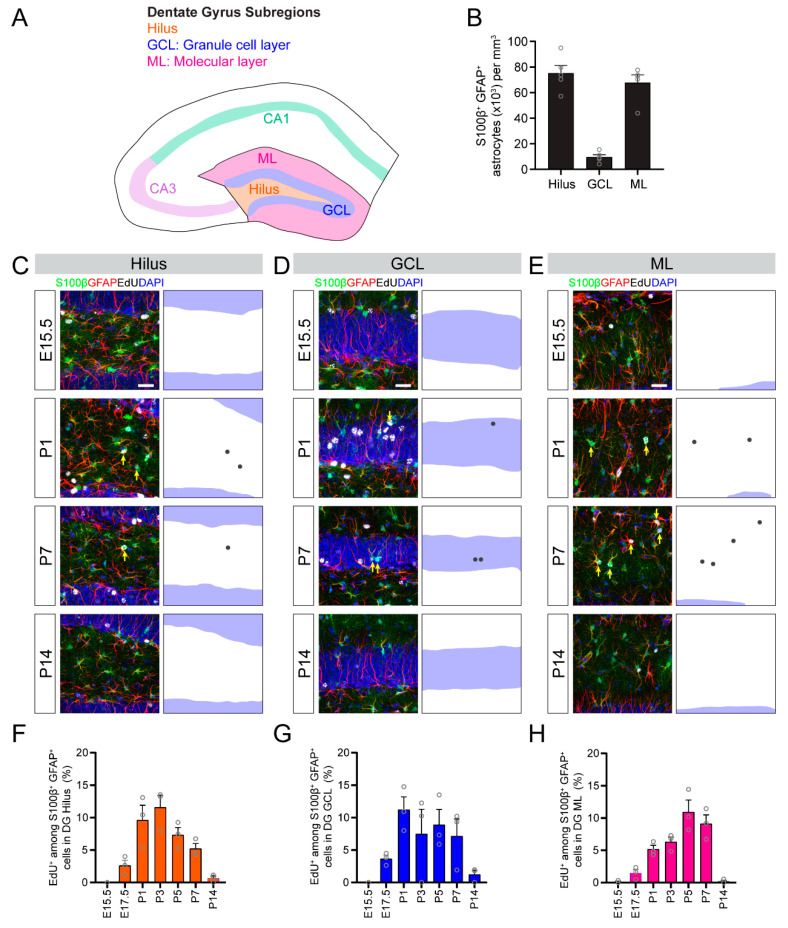
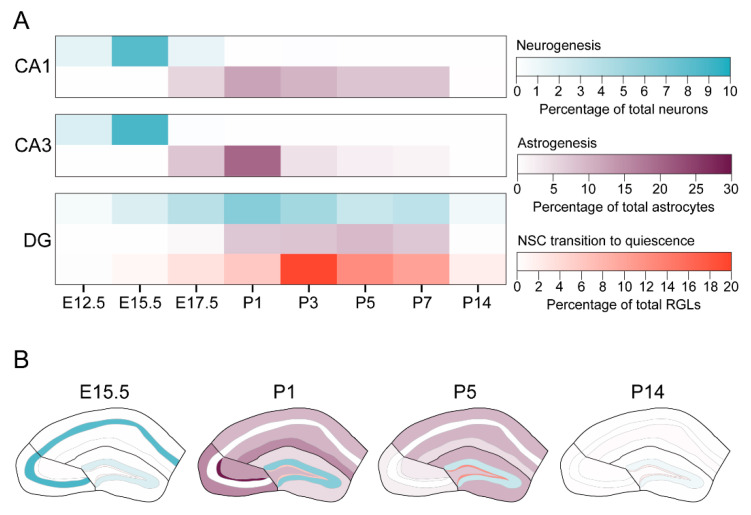
Neocortical development has been extensively studied and therefore is the basis of our understanding of mammalian brain development. One fundamental principle of neocortical development is that neurogenesis and gliogenesis are temporally segregated processes. However, it is unclear how neurogenesis and gliogenesis are coordinated in non-neocortical regions of the cerebral cortex, such as the hippocampus, also known as the archicortex. Here, we show that the timing of neurogenesis and astrogenesis in the Cornu Ammonis (CA) 1 and CA3 regions of mouse hippocampus mirrors that of the neocortex; neurogenesis occurs embryonically, followed by astrogenesis during early postnatal development. In contrast, we find that neurogenesis in the dentate gyrus begins embryonically but is a protracted process which peaks neonatally and continues at low levels postnatally. As a result, astrogenesis, which occurs during early postnatal development, overlaps with the process of neurogenesis in the dentate gyrus. During all stages, neurogenesis overwhelms astrogenesis in the dentate gyrus. In addition, we find that the timing of peak astrogenesis varies by hippocampal subregion. Together, our results show differential timing and coordination of neurogenesis and astrogenesis in developing mouse hippocampal subregions and suggest that neurogenesis and gliogenesis occur simultaneously during dentate gyrus development, challenging the conventional principle that neurogenesis and gliogenesis are temporally separated processes.

Keywords: astrogenesis; birth-dating; cytogenesis; hippocampus; neurogenesis.


Conflict of interest statement

The authors declare no conflict of interest.

Figures

Figure 1
Figure 1
Neurogenesis in the developing mouse hippocampus. (A) A schematic illustration of the experimental paradigm for 5-ethynyl-2′-deoxyuridine (EdU) birth-dating of neurons and astrocytes. EdU was administered on a single day during development (E for embryonic day of gestation and P for postnatal day after birth) followed by a chase period until analysis at P30. (BD) Quantification of neurogenesis in hippocampal subregions. Quantification of the proportions of NeuN+ pyramidal neurons in CA1 (B) or CA3 (C) regions, or the proportion of NeuN+Prox1+ dentate granule neurons in the DG (D) region that retained an EdU label at P30 from EdU injected at different times during development (x-axis). Values represent mean ± SEM, each sample value represented by a gray circle (n = 3 mice). (E) Black and white rendered images of EdU labeling (black) throughout the hippocampus at P30 when injected with EdU at the indicated time during development. Scale bar: 200 µm. CA1: cornu ammonis 1, CA3: cornu ammonis 3, DG: dentate gyrus. EdU+ neurons were quantified within the highlighted CA1, CA3 and DG regions for (BD). (FH) Sample projection confocal images of NeuN+EdU+ pyramidal neurons in CA1 (F) or CA3 (G) and NeuN+Prox1+EdU+ dentate granule neurons in DG (H) at P30 when injected with EdU at the indicated time during development. Scale bars: 20 µm. NeuN: neuronal nuclear protein.
Figure 2
Figure 2
Astrogenesis in the developing mouse hippocampus. (AC) Sample projection confocal images (left panels) and corresponding diagrams (right panel) of S100β+GFAP+EdU+ astrocytes in CA1 (A), CA3 (B) and DG (C) regions at P30 when injected with EdU at the indicated time during development. Black dots in the right panels highlight the location of S100β+GFAP+EdU+ astrocytes in the left panels. Scale bars: 100 µm. (DF) Quantification of astrogenesis in hippocampal subregions. Quantifications of the proportion of S100β+GFAP+ astrocytes in whole CA1 (D), CA3 (E) and DG (F) regions that retained an EdU label at P30 from EdU injected at different times during development (x-axis). Values represent mean ± SEM, each sample value represented by a gray circle (n = 3 mice). GFAP: glial fibrillary acidic protein.
Figure 3
Figure 3
Astrogenesis in the developing CA1 subregions. (A) A schematic illustration of CA1 subregions. (B) Quantification of the S100β+GFAP+ astrocyte density in CA1 subregions. (CE) Sample projection confocal images (left panels) and corresponding diagrams (right panel) of S100β+GFAP+EdU+ astrocytes in CA1 stratum oriens (SO; C), stratum radiatum (SR; D) and stratum lacunosum–moleculare (SL-M; E) at P30 when injected with EdU at the indicated time during development. Yellow arrows indicate S100β+GFAP+EdU+ astrocytes. Scale bars: 25 µm. (FH) Quantification of astrogenesis in CA1 subregions. Quantification of the proportions of S100β+GFAP+ astrocytes in stratum oriens (F), stratum radiatum (G) and stratum lacunosum-moleculare (H) that retained an EdU label at P30 from EdU injected at different times during development (x-axis). Values represent mean ± SEM, each sample value represented by a gray circle (n = 5 mice in (B) and n = 3 mice in (FH)).
Figure 4
Figure 4
Astrogenesis in the developing CA3 subregions. (A) A schematic illustration of CA3 subregions. (B) Quantification of the S100β+GFAP+ astrocyte density in CA3 subregions. (CE) Sample projection confocal images (left panels) and corresponding diagrams (right panel) of S100β+GFAP+EdU+ astrocytes in CA3 stratum oriens (SO; C), stratum lucidum (SL; D) and stratum radiatum (SR; E) at P30 when injected with EdU at the indicated time during development. Yellow arrows indicate S100β+GFAP+EdU+ astrocytes. Scale bars: 25 µm. (FH) Quantification of astrogenesis in CA1 subregions. Shown are quantifications of the proportion of S100β+GFAP+ astrocytes in stratum oriens (F), stratum lucidum (G) and stratum radiatum (H) that retained an EdU label at P30 from EdU injected at different times during development (x-axis). Values represent mean ± SEM, each sample value represented by a gray circle (n = 5 mice in (B) and n = 3 mice in (FH)).
Figure 5
Figure 5
Astrogenesis in the developing dentate gyrus subregions. (A) A schematic illustration of dentate gyrus subregions. (B) Quantification of the S100β+GFAP+ astrocyte density in dentate gyrus subregions. (CE) Sample projection confocal images confocal images (left panels) and corresponding diagrams (right panel) of S100β+GFAP+EdU+ astrocytes in the hilus (C), the granule cell layer (GCL; D) and the molecular layer (ML; E) at P30 when injected with EdU at the indicated time during development. Yellow arrows indicate S100β+GFAP+EdU+ astrocytes. Scale bars: 25 µm. Blue shade indicates granule cell layer (FH) Quantification of astrogenesis in dentate gyrus subregions. Quantifications of the proportion of S100β+GFAP+ astrocytes in the hilus (F), the dentate granule cell layer (G) and the molecular layer (H) that retained an EdU label at P30 from EdU injected at different times during development (x-axis). Values represent mean ± SEM, each sample value represented by a gray circle (n = 5 mice in (B) and n = 3 mice in (FH)).
Figure 6
Figure 6
The timing of developmental neurogenesis and astrogenesis by hippocampal subregion. (A) Heatmap diagrams summarizing the developmental timing of neurogenesis (blue) and astrogenesis (purple) in the CA1, CA3 and dentate gyrus of the mouse hippocampus. Neurogenesis and astrogenesis occur sequentially and are largely nonoverlapping in the CA1 and CA3 regions. In contrast, neurogenesis and astrogenesis occur simultaneously in the dentate gyrus, and at the same time that dentate gyrus neural stem cells (NSCs) transition into quiescence (red). NSC transition to quiescence data are from Berg et al., 2019. (B) Heatmap diagrams summarizing the developmental timing of neurogenesis (blue) and astrogenesis (purple) in subregions of the CA1, CA3 and dentate gyrus, as well as the NSC transition to quiescence in the subgranular zone of the dentate gyrus (red). Colors correspond to the same legend in (A). Neurogenesis in the CA1 and CA3 regions dominates during embryonic development. Neurogenesis in the dentate gyrus and astrogenesis throughout the hippocampal regions occurs during early postnatal development, but the timing of peak astrogenesis varies by subregion. In addition, dentate gyrus NSCs in the subgranular zone transition into quiescence during early postnatal development. Finally, most cytogenesis in the hippocampus has ceased by P14, except for low levels of neurogenesis and astrogenesis in the dentate gyrus, which continues throughout adulthood.

References

    1. Götz M., Huttner W.B. The cell biology of neurogenesis. Nat. Rev. Mol. Cell Biol. 2005;6:777–788. doi: 10.1038/nrm1739. - DOI - PubMed
    1. Falk S., Götz M. Glial control of neurogenesis. Curr. Opin. Neurobiol. 2017;47:188–195. doi: 10.1016/j.conb.2017.10.025. - DOI - PubMed
    1. Namba T., Huttner W.B. Neural progenitor cells and their role in the development and evolutionary expansion of the neocortex. Wiley Interdiscip. Rev. Dev. Biol. 2017;6:e256. doi: 10.1002/wdev.256. - DOI - PubMed
    1. Kriegstein A., Alvarez-Buylla A. The Glial Nature of Embryonic and Adult Neural Stem Cells. Annu. Rev. Neurosci. 2009;32:149–184. doi: 10.1146/annurev.neuro.051508.135600. - DOI - PMC - PubMed
    1. Miller F.D., Gauthier A.S. Timing Is Everything: Making Neurons versus Glia in the Developing Cortex. Neuron. 2007;54:357–369. doi: 10.1016/j.neuron.2007.04.019. - DOI - PubMed